Inglewood Duplex: Investment
For Sale
$850,000
3314 -3316 W Imperial Hwy, Inglewood, CA 90303
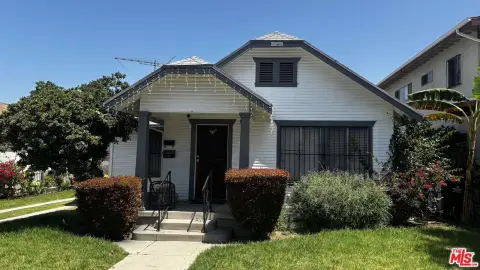
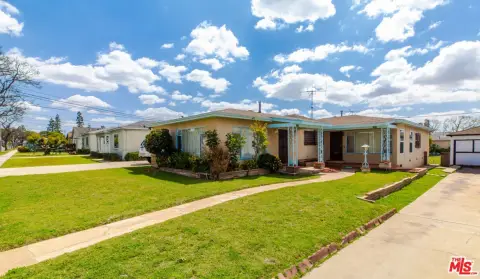
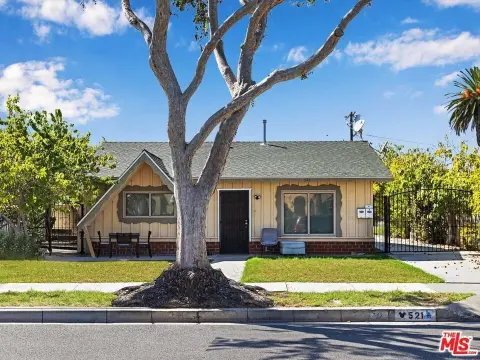
Well-maintained duplex in a rapidly evolving Inglewood neighborhood.
Property Size1,802 SF
Days on Market379
Property Features for 3314 -3316 W Imperial Hwy
General Information
Standard status
Active
Size
1,802 SF
Property subtype
Duplex
Amenities
Floor Furnace
Wall Furnace
Building Details
Building Size
1,802 SF
Year Built
1947
Stories
1
Listing Agency:
Engel & Volkers La Canada
Listed By:
Terre Watson
(626) 483-4814
Source:
Kw
Added: Oct 1, 2025
Changed: Oct 13
Last Checked: Oct 12 at 6:33PM
Displayed information is deemed reliable but is not guaranteed and should be independently verified. All listing content including descriptions, pricing, images are the copyrighted material of Engel & Volkers La Canada
Investment Insights
Based on property information with market context.
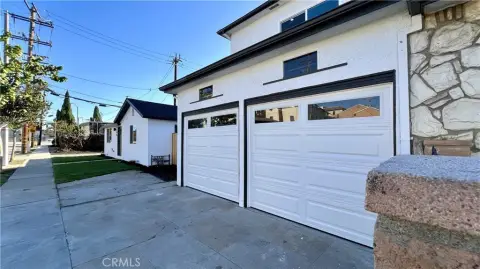
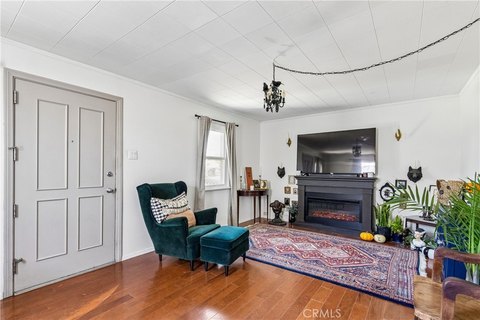
This well-maintained duplex presents an opportunity in a rapidly evolving neighborhood of Inglewood. Situated on a generous lot, the property offers flexibility for investors and owner-occupants. Each unit features 2 bedrooms and 1 bath, with layouts that maximize comfort and functionality. Recent upgrades include a new cool roof and windows. Both units are tenant-occupied, providing immediate rental income. The property is located minutes from SoFi Stadium, Intuit Dome, the Kia Forum, and the Metro Crenshaw Line, with easy access to LAX, major freeways, shopping, dining, and local parks. This duplex delivers location, upgrades, and long-term upside in the heart of a vibrant community.
Key Highlights
- Prime location minutes from SoFi Stadium, Intuit Dome, Kia Forum, and the Metro Crenshaw Line.
- Income‑generating duplex with both units currently tenant‑occupied, providing immediate rental income.
- Recent upgrades include a new cool roof and windows.
Financial Insights
Estimated NOI and Cap Rate
NOI / Yr
$25,563
Cap Rate
3.01%
Suggested Prices Based on Cap Rates
Cap Rate 5%
$511,260
$511.3K
Cap Rate 7%
$365,186
$365.2K
Cap Rate 9%
$284,033
$284.0K
Market Conditions
NOI Build-Up for 1,802 SF
Gross rent
$36.8K $20.40/SF
− Vacancy
−$243 −$0.13/SF
EGI
$36.5K $20.27/SF
− OpEx
−$11.0K −$6.08/SF
NOI
$25.6K $14.19/SF
Area
Inglewood, CA
Vacancy
0.66%
Lease Rate
$20.40 /SF/Yr
Expense Ratio
30.00%
Simulate Cap Rate and NOI
Suggested Prices Based on Cap Rates
Cap Rate 5%
$511,260
Cap Rate 7%
$365,186
Cap Rate 9%
$284,033
Alternative Uses
Best Use
Multifamily LT 5
$365.2K
$319.5K – $426.1K
NOI $25,563 @ 7.0% cap · market cap 3.01%
Second Best
Apartment 5plus
$318.9K
$279.0K – $372.0K
NOI $22,321 @ 7.0% cap · market cap 2.63%
Theoretical Best
Office A
$735.2K
$643.3K – $857.8K
NOI $51,465 @ 7.0% cap · market cap 6.05%
Zoning and permitted uses should be independently verified with authorities.
How Realmo checks its estimates
Property Analytics
Unlock full access to Insights
Subscribe to Realmo Intelligence
Open Analytics
Current Use
Location Intelligence
Trade Area within ½ mile
799
Businesses Nearby
Explore this area
Business Placement
Demographics for 90303, CA
24,490
Population
7,354
Households
3.3
Avg Household Size
35
Median Age
18%
College-Educated
73%
High-School Grad
1.9 sq mi
ZIP Area
12,889
Density / Sq Mi
$70,853
Median Household Income
$36,292
Median Earnings
$1,709
Median Rent
$764,200
Median Home Value
Check the figures for this property
Cap Rate, Value Estimation, Potential NOI and more
View Realmo Analytics
Market
Vacancy Rate% for Multifamily in West region

Questions? Ask Rey
Realmo’s AI knows this listing — price, zoning, demand, history. Ask anything.





Frequently Asked Questions
What type of property is this?
Duplex - Well-maintained duplex in a rapidly evolving Inglewood neighborhood.
Where is this duplex located?
The property is located at 3314 -3316 W Imperial Hwy Inglewood, CA.
What is the asking price?
The asking price for this property is $850,000.
What are key features of this property?
This property features: Prime location minutes from SoFi Stadium, Intuit Dome, Kia Forum, and the Metro Crenshaw Line.; Income‑generating duplex with both units currently tenant‑occupied, providing immediate rental income.; Recent upgrades include a new cool roof and windows.


