Renovated Single-Story Flex
For Sale
$279,000
325 E Market St, York, PA 17403
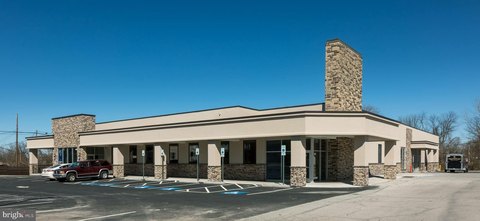
Office, production, and storage areas occupy a visible downtown commercial property with dedicated parking.
Property Size3,800 SF
Price / SF$73.42
Days on Market63
Property Features for 325 E Market St
General Information
Standard status
Active
Size
3,800 SF
Total Parking Spaces
8
Additional Details
Road Access
Yes
Power
200 amps
Building Details
Year Built
1900
Buildings
1
Stories
1
Listing Agency:
Bennett Williams Realty, Inc.
Listed By:
Keith A Kahlbaugh · License #AB067648
(717) 887-9668
Source:
Selltheshore
Added: Aug 12
Changed: Oct 9
Last Checked: Oct 7 at 3:27PM
Displayed information is deemed reliable but is not guaranteed and should be independently verified. All listing content including descriptions, pricing, images are the copyrighted material of Bennett Williams Realty, Inc.
Investment Insights
Based on property information with market context.
Renovated single-story flex space totaling 3,800 square feet combines office, production, and storage functionality. The front portion includes an open-concept office area, a loft-style private office, and a side room that can serve as reception or additional workspace. Two restrooms support staff and visitors, while the rear production area has 200-amp electrical service and an exterior loading platform.
The property is located at 325 E Market St along Route 462 in downtown York, with access to a private parking lot containing 8 spaces and on-street metered parking. The surrounding area includes the York County Courthouse, York County Judicial Center, Yorktowne Hotel by Hilton, and Central Market House, all identified as within walking distance. Originally built in 1900, the building has been renovated for office, studio, light production, storage, or retail use.
The property is located at 325 E Market St along Route 462 in downtown York, with access to a private parking lot containing 8 spaces and on-street metered parking. The surrounding area includes the York County Courthouse, York County Judicial Center, Yorktowne Hotel by Hilton, and Central Market House, all identified as within walking distance. Originally built in 1900, the building has been renovated for office, studio, light production, storage, or retail use.
Key Highlights
- 3,800‑square‑foot renovated single‑story flex building
- Open front office, loft‑style private office, and flexible side room
- Rear production area with 200‑amp electrical service
Financial Insights
Estimated NOI and Cap Rate
NOI / Yr
$22,172
Cap Rate
7.95%
Suggested Prices Based on Cap Rates
Cap Rate 5%
$443,440
$443.4K
Cap Rate 7%
$316,743
$316.7K
Cap Rate 9%
$246,356
$246.4K
Market Conditions
NOI Build-Up for 3,800 SF
Gross rent
$33.6K $8.83/SF
− Vacancy
−$1.9K −$0.49/SF
EGI
$31.7K $8.34/SF
− OpEx
−$9.5K −$2.50/SF
NOI
$22.2K $5.83/SF
Area
York County, PA
Vacancy
5.60%
Lease Rate
$8.83 /SF/Yr
Expense Ratio
30.00%
Simulate Cap Rate and NOI
Suggested Prices Based on Cap Rates
Cap Rate 5%
$443,440
Cap Rate 7%
$316,743
Cap Rate 9%
$246,356
Alternative Uses
Best Use
Office B
$865.5K
$757.3K – $1.01M
NOI $60,583 @ 7.0% cap · market cap 21.71%
Second Best
Industrial
$316.7K
$277.2K – $369.5K
NOI $22,172 @ 7.0% cap · market cap 7.95%
Theoretical Best
Office A
$1.10M
$962.7K – $1.28M
NOI $77,016 @ 7.0% cap · market cap 27.60%
Zoning and permitted uses should be independently verified with authorities.
How Realmo checks its estimates
Property Analytics
Unlock full access to Insights
Subscribe to Realmo Intelligence
Open Analytics
Current Use
Lease Details
Yes
Paved road access
Location Intelligence
Trade Area within ½ mile
2,308
Businesses Nearby
Under-served
Demand for This Use
Explore this area
Business Placement
Demographics for 17403, PA
40,344
Population
16,490
Households
2.4
Avg Household Size
37
Median Age
32%
College-Educated
89%
High-School Grad
20.6 sq mi
ZIP Area
1,958
Density / Sq Mi
$72,233
Median Household Income
$38,105
Median Earnings
$1,072
Median Rent
$206,900
Median Home Value
Check the figures for this property
Cap Rate, Value Estimation, Potential NOI and more
View Realmo Analytics
Market
Vacancy Rate% for Office in Northeast region

Questions? Ask Rey
Realmo’s AI knows this listing — price, zoning, demand, history. Ask anything.


Similar Off Market Nearby
- Nonna's Italian Catering — 37 W Clarke Ave, York, PA 17401
- Altland House Catering & Events — 142 n george st, york, pa 17401
- Hector Arias Flair Bartender — 347 E Market St, York, PA 17403
- Central Family Restaurant — 400 N George St, York, PA 17401
Frequently Asked Questions
What type of property is this?
Flex space - Office, production, and storage areas occupy a visible downtown commercial property with dedicated parking.
Where is this flex space located?
The property is located at 325 E Market St York, PA.
What is the asking price?
The asking price for this property is $279,000.
What are key features of this property?
This property features: 3,800‑square‑foot renovated single‑story flex building; Open front office, loft‑style private office, and flexible side room; Rear production area with 200‑amp electrical service


