Move-in Ready Orlando Office
For Sale
$819,000
314 E Anderson St, Orlando, FL 32801
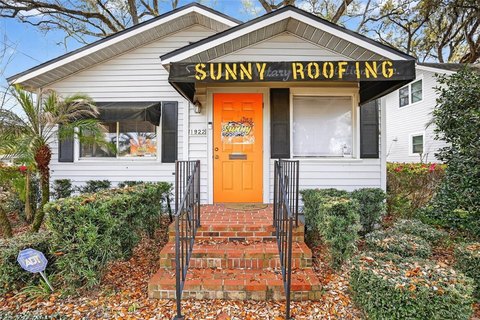
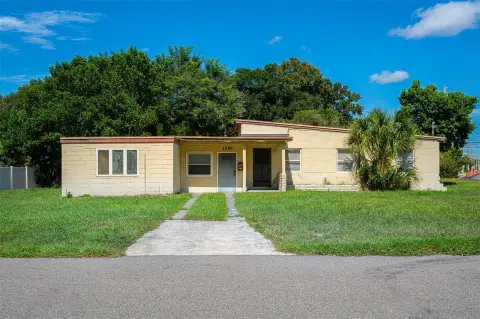
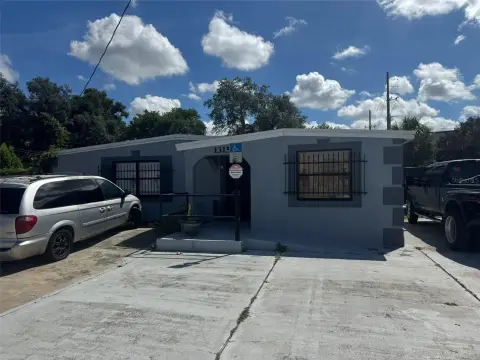
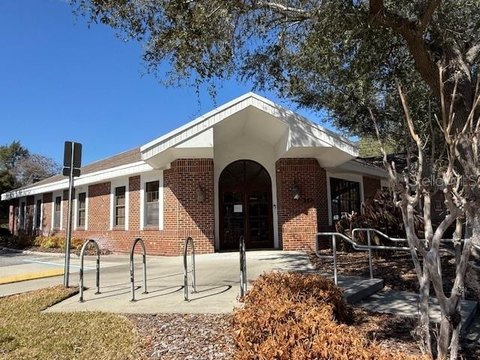
2,625 SF office building ideal for professional services.
Property Size2,625 SF
Price / SF$312
Days on Market201
Property Features for 314 E Anderson St
General Information
Standard status
Active
Size
2,625 SF
Class
B
Property subtype
Office
Building Details
Building Size
2,625 SF
Year Built
1920
Listing Agency:
Millenia Partners
Listed By:
Josiah Moore · License #FL #SL3601941
(407) 304-8485
Source:
Millenia-partners
Added: Mar 27
Changed: Oct 5
Last Checked: Oct 12 at 6:47PM
Displayed information is deemed reliable but is not guaranteed and should be independently verified. All listing content including descriptions, pricing, images are the copyrighted material of Millenia Partners
Investment Insights
Based on property information with market context.
This 2,625 SF office building, constructed in 1920, presents a move-in-ready investment opportunity for owner-users. The property is suited for lawyers, real estate professionals, and other professional services. The building, formerly home to Liberty Management Services, combines classic charm with modern functionality. Its O-1/HP/T/AN zoning provides flexibility for businesses seeking a prime location in Orlando. The location offers proximity to businesses, dining, and entertainment options. Situated south of downtown, the sub-market provides access to Lake Eola Park, Amway Center, and Thornton Park. The area features corporate centers, cultural venues, and eateries, offering a strategic presence in a flourishing economic center. This well-priced office site is suitable for legal, executive, or professional services practices.
Key Highlights
- Move‑in‑ready 2,625 SF office building ideal for owner‑user investment.
- Prime Orlando location south of downtown, close to Lake Eola Park, Amway Center, and Thornton Park.
- Flexible O‑1/HP/T/AN zoning allows for a wide range of professional services.
Financial Insights
Estimated NOI and Cap Rate
NOI / Yr
$49,022
Cap Rate
5.99%
Suggested Prices Based on Cap Rates
Cap Rate 5%
$980,440
$980.4K
Cap Rate 7%
$700,314
$700.3K
Cap Rate 9%
$544,689
$544.7K
Market Conditions
NOI Build-Up for 2,625 SF
Gross rent
$78.8K $30.00/SF
− Vacancy
−$13.4K −$5.10/SF
EGI
$65.4K $24.90/SF
− OpEx
−$16.3K −$6.23/SF
NOI
$49.0K $18.67/SF
Area
Orlando, FL
Vacancy
17.00%
Lease Rate
$30.00 /SF/Yr
Expense Ratio
25.00%
Simulate Cap Rate and NOI
Suggested Prices Based on Cap Rates
Cap Rate 5%
$980,440
Cap Rate 7%
$700,314
Cap Rate 9%
$544,689
Alternative Uses
Best Use
Office B
$700.3K
$612.8K – $817.0K
NOI $49,022 @ 7.0% cap · market cap 5.99%
Second Best
—
—
no second resolved use
Theoretical Best
Office A
$845.6K
$739.9K – $986.5K
NOI $59,192 @ 7.0% cap · market cap 7.23%
Zoning and permitted uses should be independently verified with authorities.
How Realmo checks its estimates
Property Analytics
Unlock full access to Insights
Subscribe to Realmo Intelligence
Open Analytics
Current Use
Location Intelligence
Trade Area within ½ mile
8,061
Businesses Nearby
Explore this area
Business Placement
Demographics for 32801, FL
17,728
Population
12,133
Households
1.5
Avg Household Size
36
Median Age
63%
College-Educated
95%
High-School Grad
2.2 sq mi
ZIP Area
8,058
Density / Sq Mi
$77,626
Median Household Income
$63,090
Median Earnings
$1,773
Median Rent
$397,600
Median Home Value
Check the figures for this property
Cap Rate, Value Estimation, Potential NOI and more
View Realmo Analytics
Market
Vacancy Rate% for Office in Orlando, FL

Questions? Ask Rey
Realmo’s AI knows this listing — price, zoning, demand, history. Ask anything.






Frequently Asked Questions
What type of property is this?
Office building - 2,625 SF office building ideal for professional services.
Where is this office building located?
The property is located at 314 E Anderson St Orlando, FL.
What is the asking price?
The asking price for this property is $819,000.
What are key features of this property?
This property features: Move‑in‑ready 2,625 SF office building ideal for owner‑user investment.; Prime Orlando location south of downtown, close to Lake Eola Park, Amway Center, and Thornton Park.; Flexible O‑1/HP/T/AN zoning allows for a wide range of professional services.


