Residential Income Property with
For Sale
$364,900
3109 BRIDGEFORD Drive, Orlando, FL 32812
Residential, ORLANDO, FL
Property Size1,624 SF
Lot Size0.10 Acres
Price / SF$224.69
Days on Market67
Property Features for 3109 BRIDGEFORD Drive
General Information
Property type
Residential Multi Family
Property subtype
Duplex
Zoning
R-3A/AN
Bedrooms
3
Bathrooms
3
Full bathrooms
2
Half bathrooms
1
Rooms
Bathroom 2, Bathroom 3, Bedroom 3, Family Room, Dining Room, Bedroom 2, Bathroom 1, Bedroom 1
Patio and Porch features
Patio
Pets allowed
Dogs OK, Cats OK
Interior features
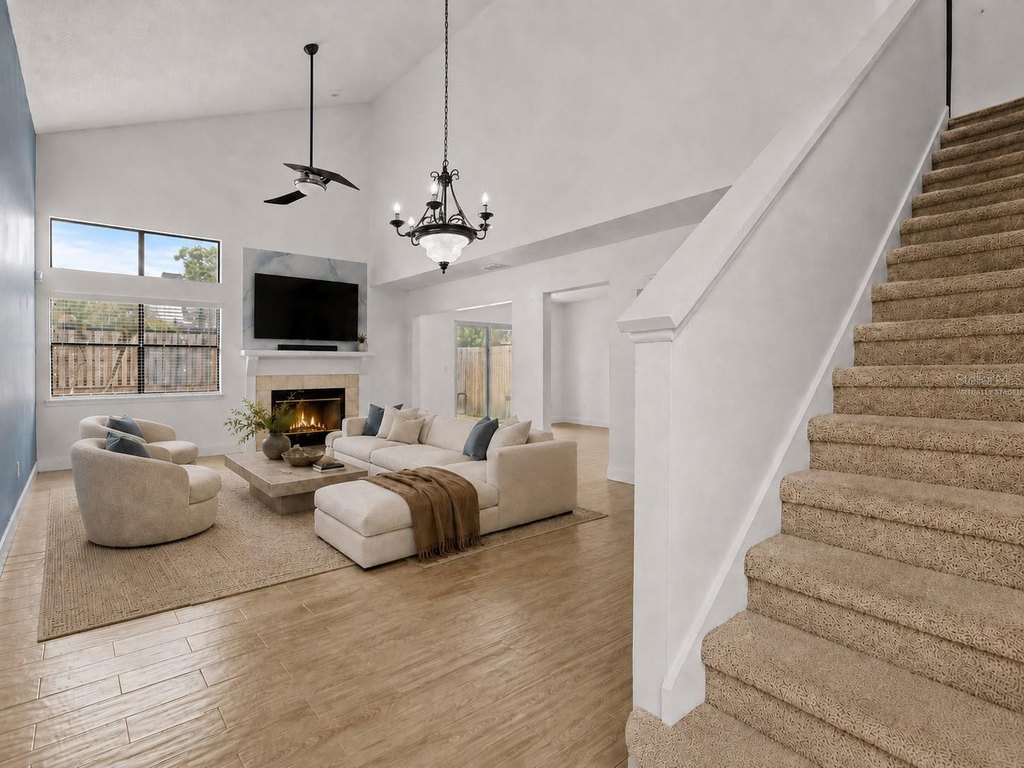
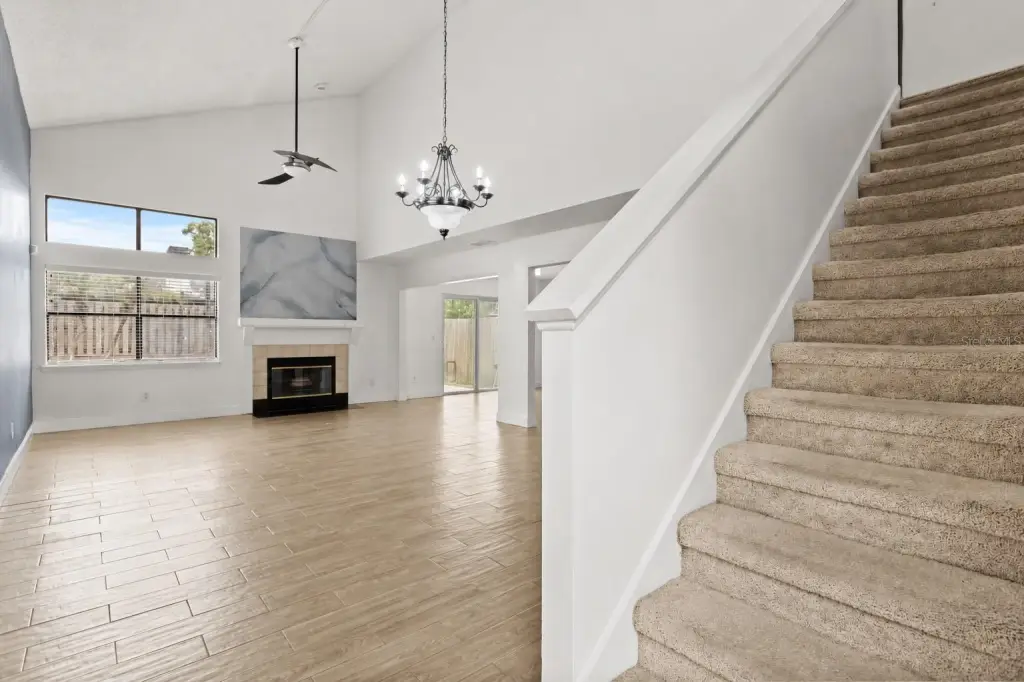
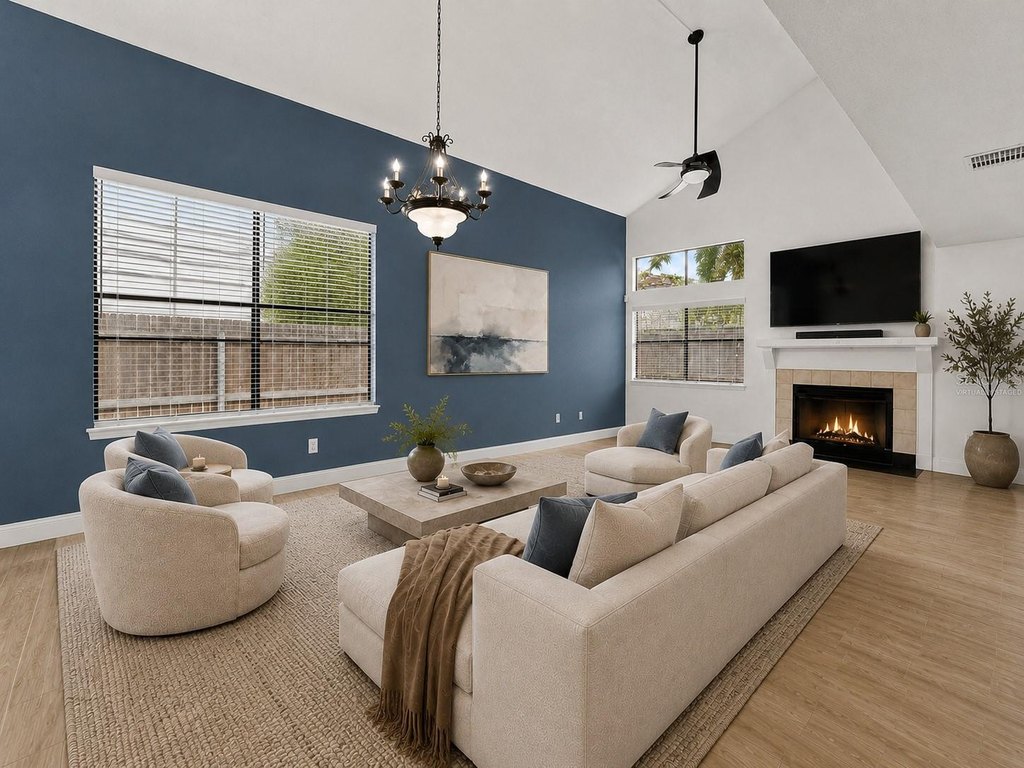
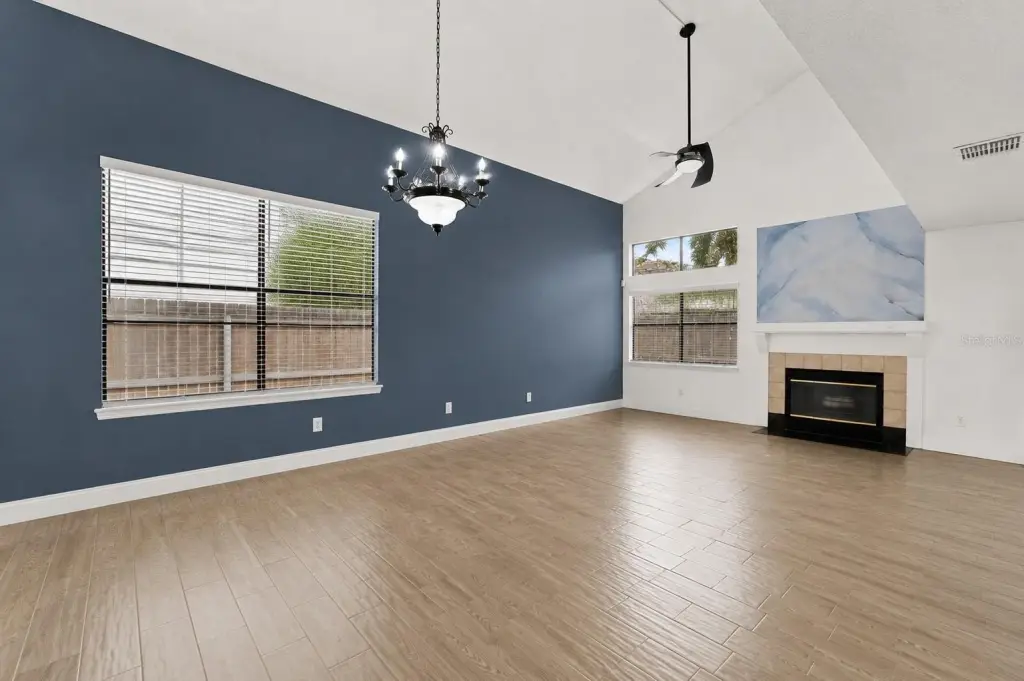
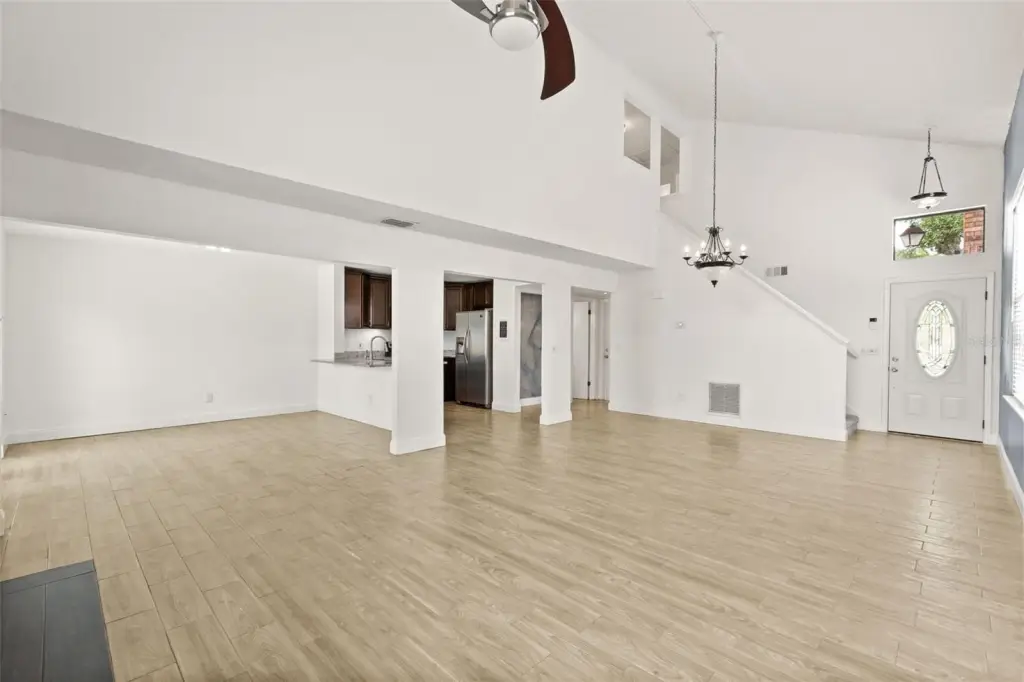
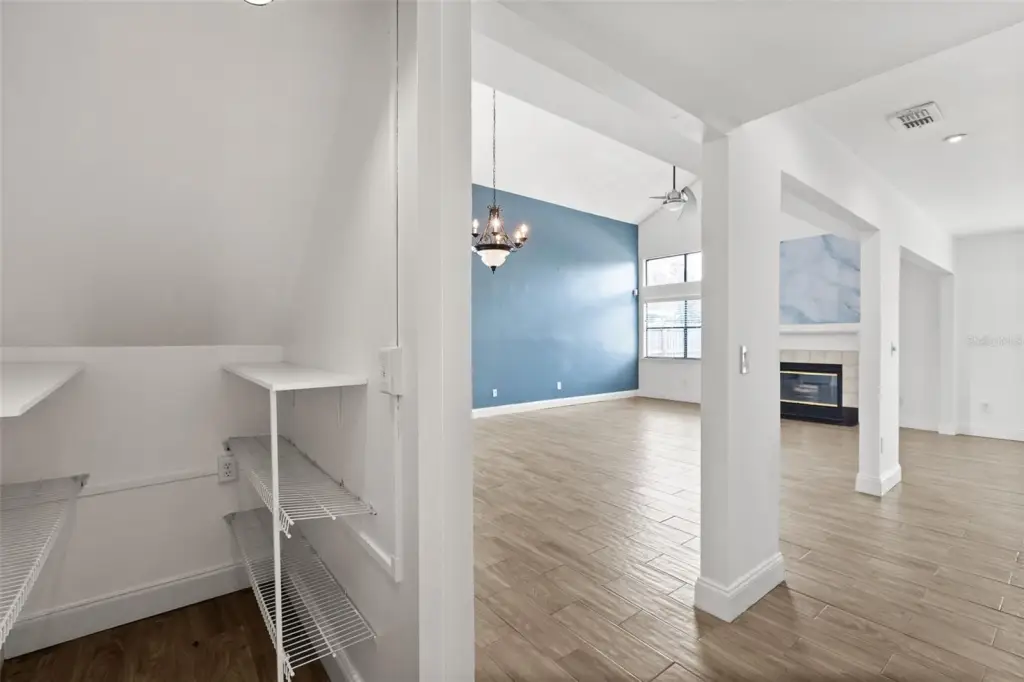
Ceiling Fans(s), High Ceilings, Kitchen/Family Room Combo, Open Floorplan, Vaulted Ceiling(s), Walk-In Closet(s)
Fireplace
1
Appliances
Dishwasher, Dryer, Microwave, Range, Refrigerator, Washer
Subdivision
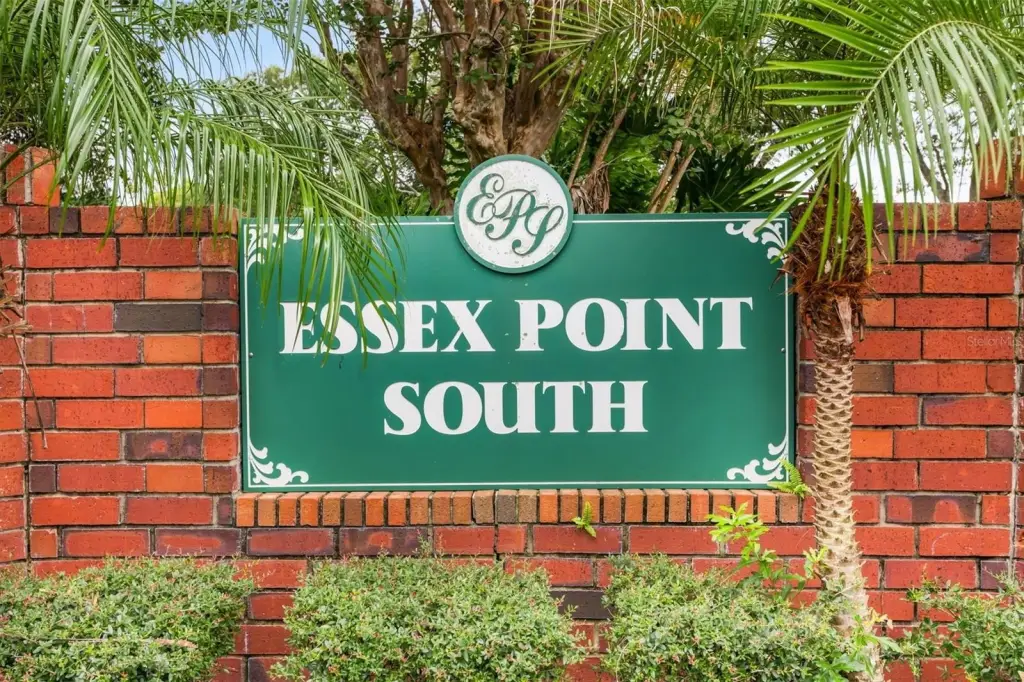
ESSEX POINT SOUTH
Elementary school
Lake George Elem
Middle school
Conway Middle
High school
Boone High
Directions
From S Semoran Blvd/SR 436; head west on Michigan St, left on Dixie Belle Dr, right on Halifax Dr, right on Bridgeford Dr.
Standard status
Active
APN
04-23-30-2523-00-150
Size
1,624 SF
Lot size
0.10 Acres
Taxes and HOA fees
Tax Year
2025
Tax Description
ESSEX POINT SOUTH 19/119 LOT 15
Tax Annual Amount
4025
Legal Description
ESSEX POINT SOUTH 19/119 LOT 15
Utilities
Sewer type
Public Sewer
Heating system
Central, Electric (Heating)
Cooling system
Central Air
Water source
Public
Amenities
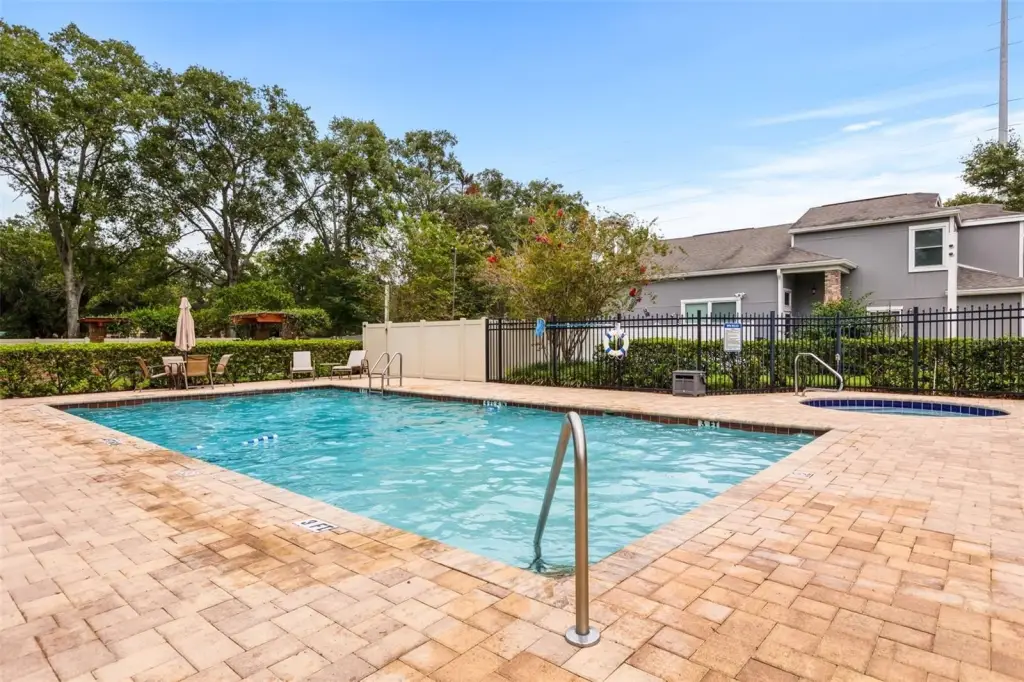
pool
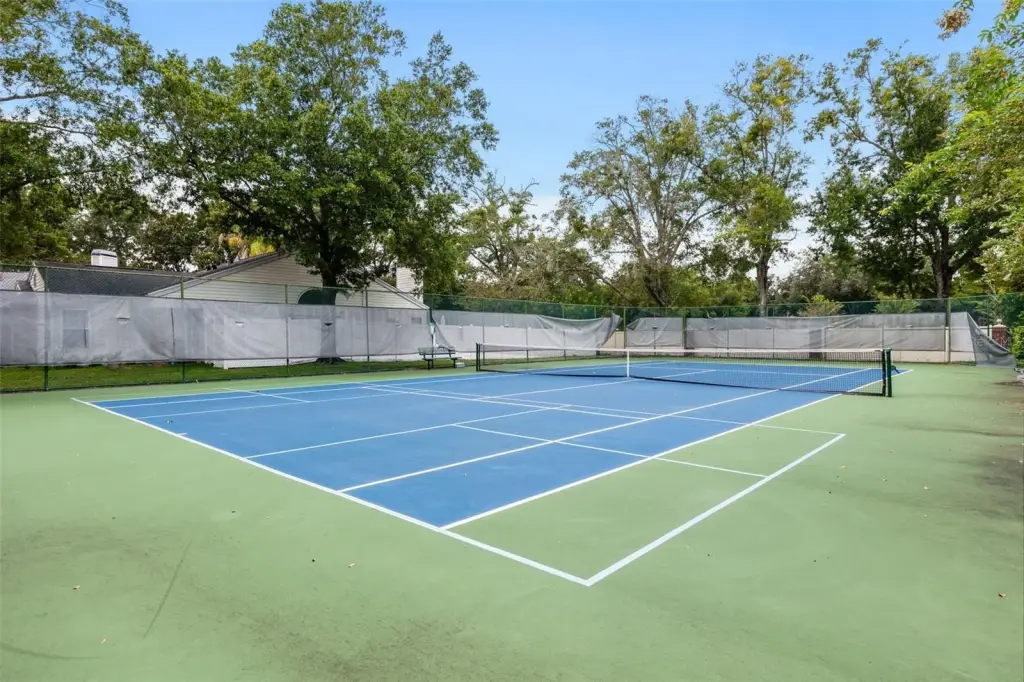
tennis court
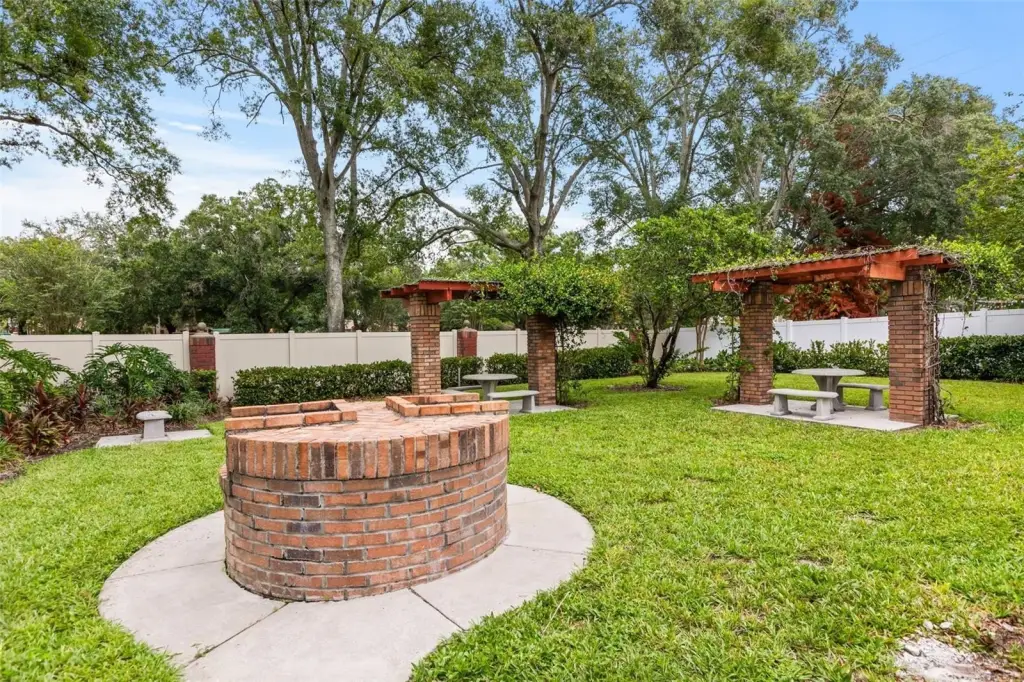
covered picnic pavilion with brick barbecue grills
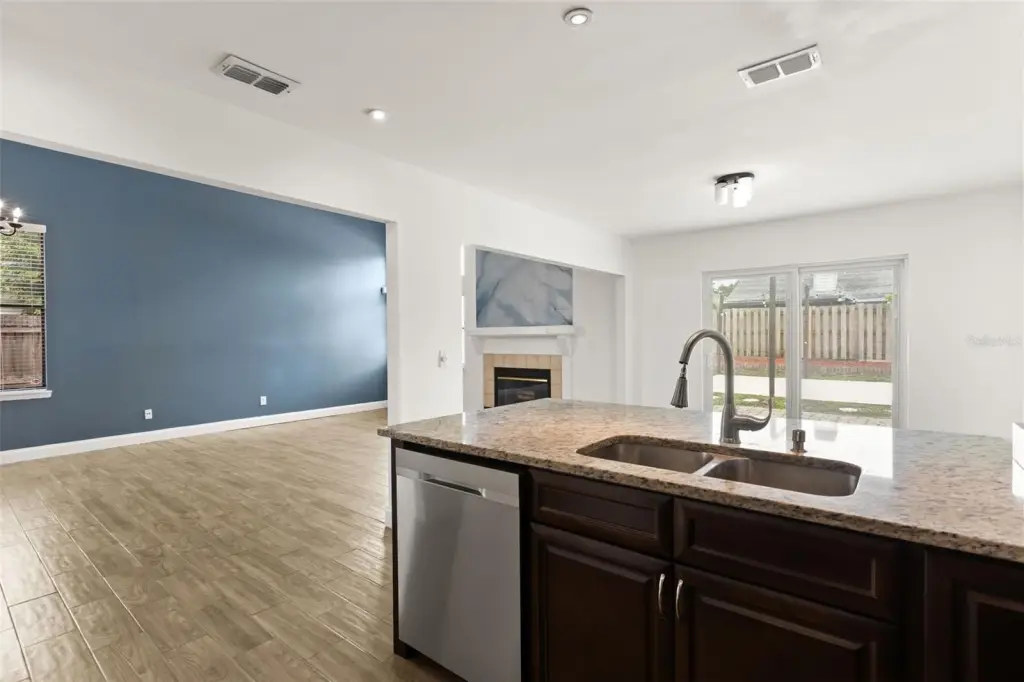
wood-burning fireplace
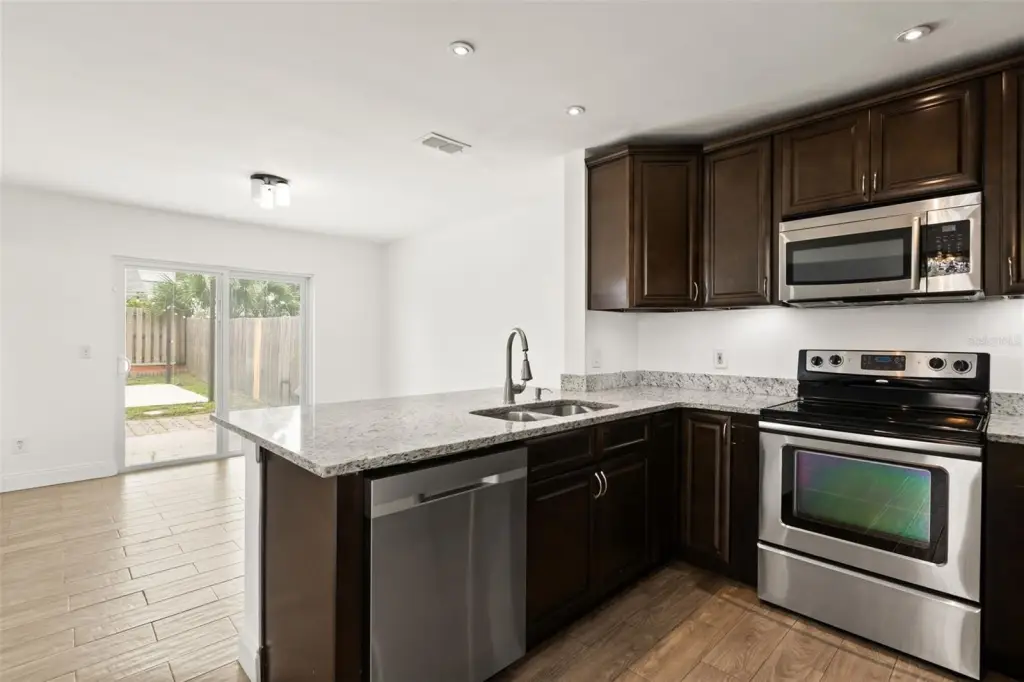
granite counters
stainless appliances
breakfast bar
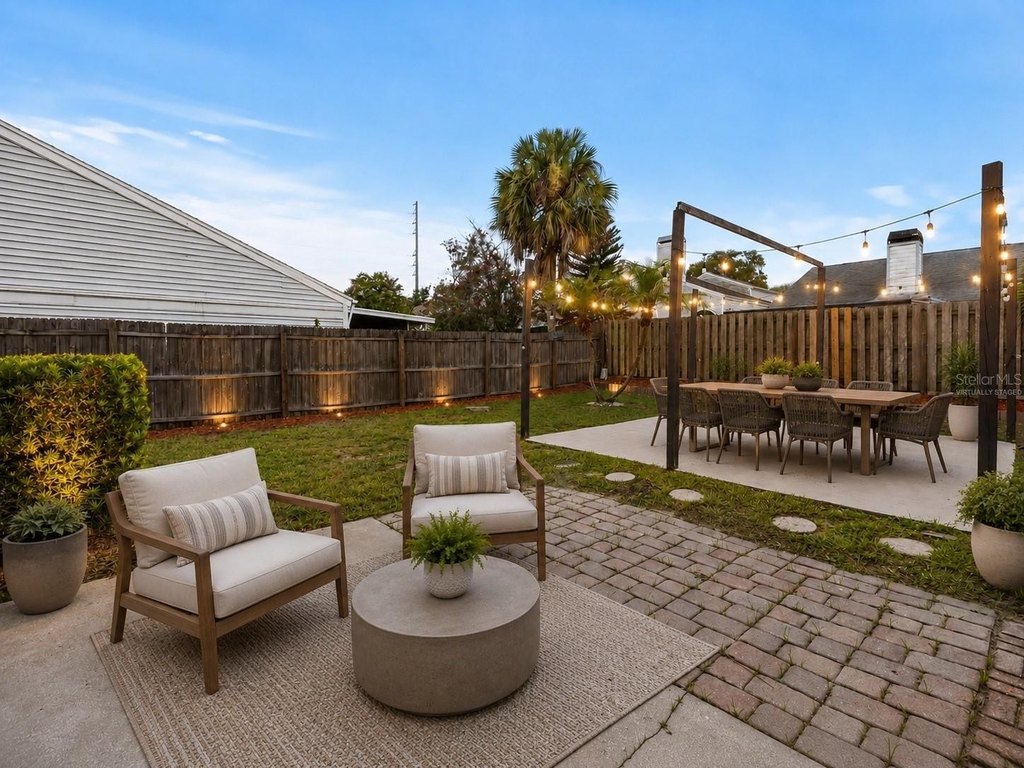
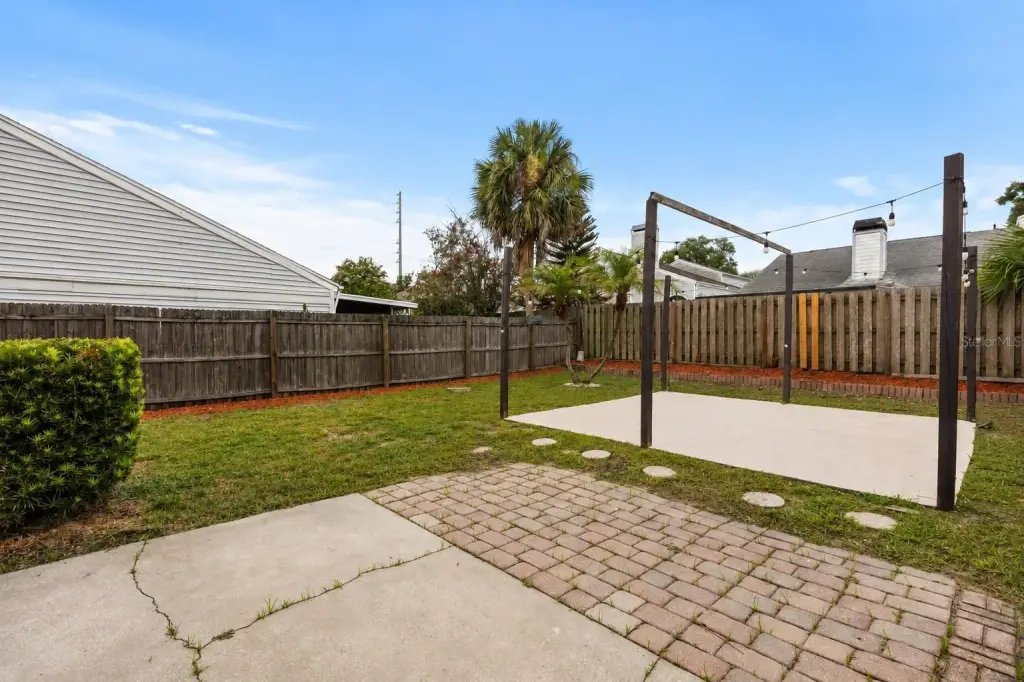
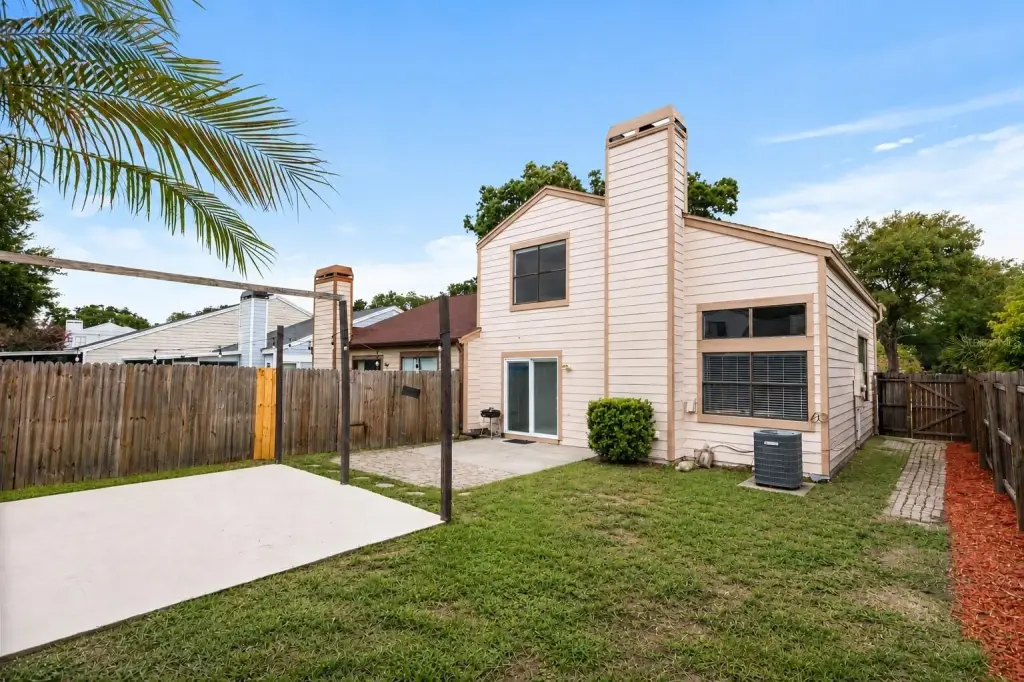
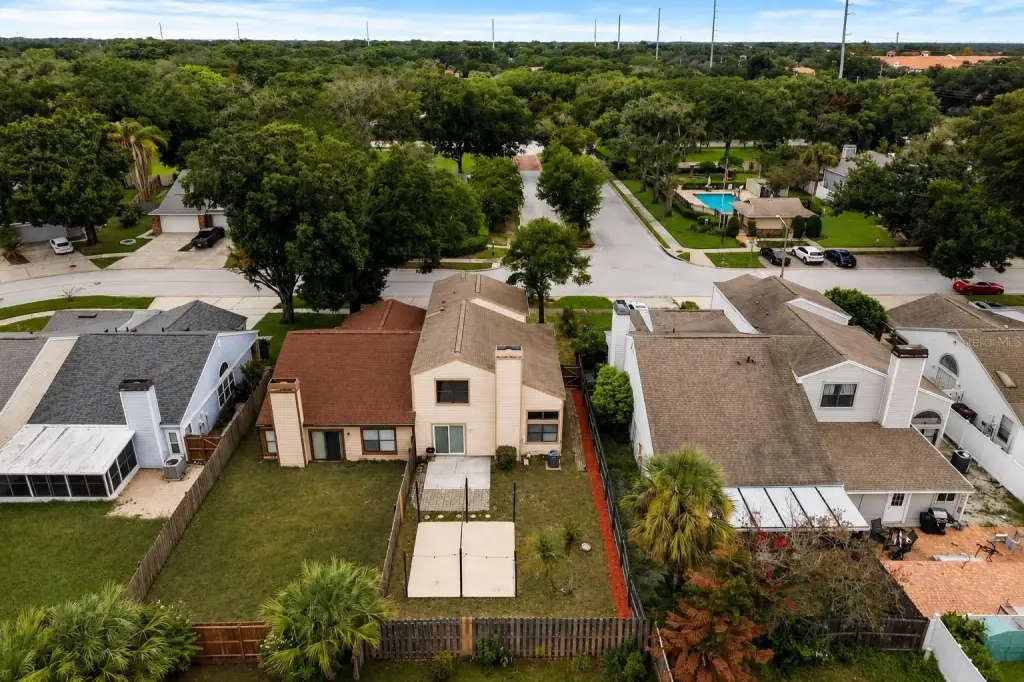
fully fenced backyard
paver patio
pergola
laundry
Building Details
Year built
1989
Floors in Building
2
Flooring type
Carpet, Tile - Ceramic, Laminate, Tile
Building materials
Block, Cement Siding
Roof type
Shingle
Listing Agency:
TOP FLORIDA HOMES
(855) 919-0458
Listed By:
Isabelle Goncalves
(407) 495-8970
Added: Aug 13
Changed: Oct 18
Last Checked: Oct 18 at 9:06PM
MLS# O6431022
Copyright © 2026 Stellar MLS. All rights reserved. All information provided by the listing agent/broker is deemed reliable but is not guaranteed and should be independently verified.

Ask AI about this property
Review the available facts, identify missing information and prepare questions for the agent.
Investment Insights
Based on property information with market context.
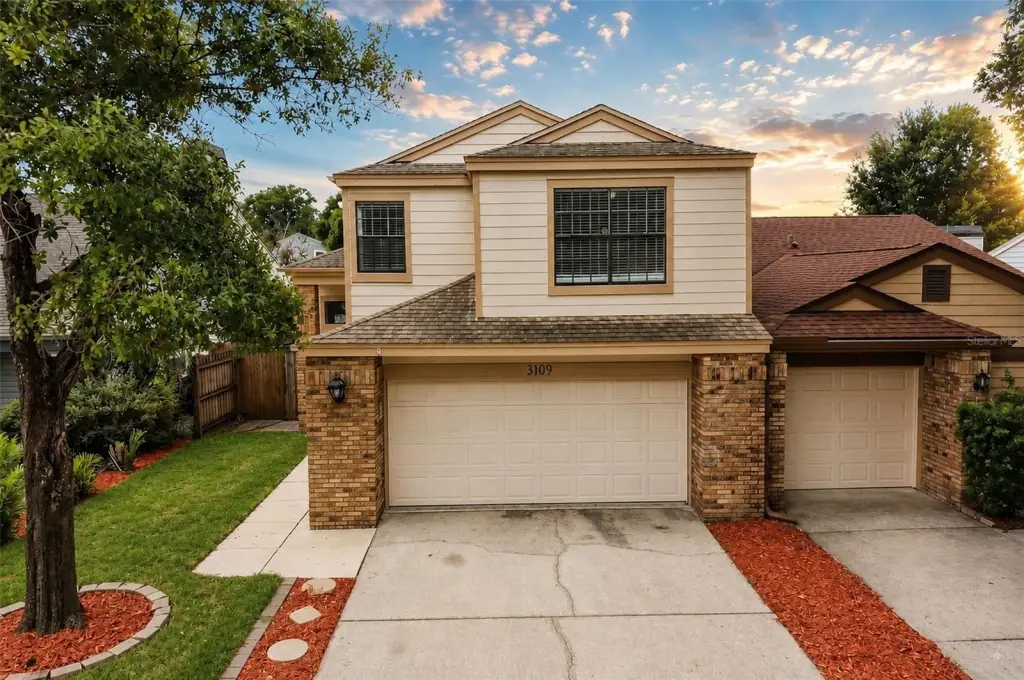
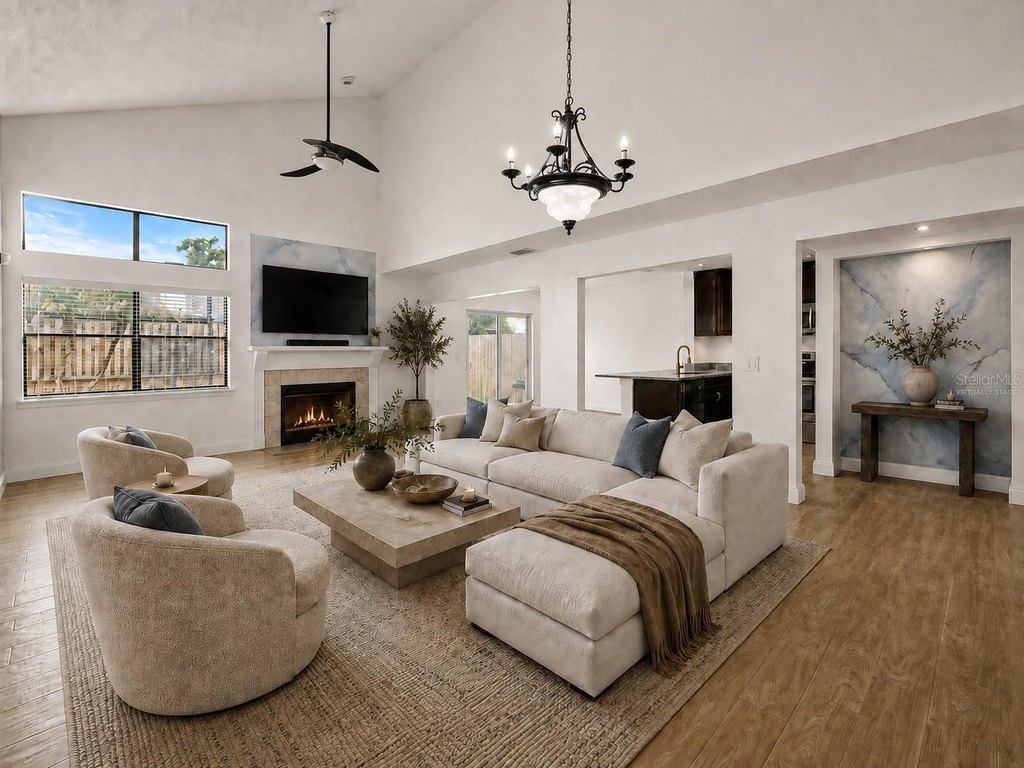
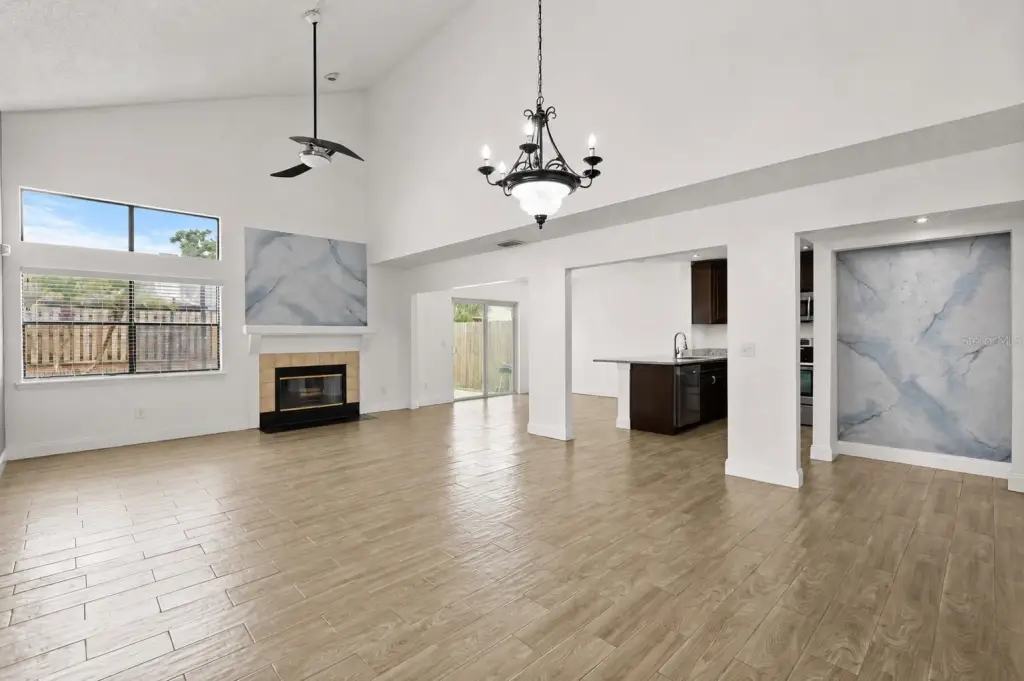
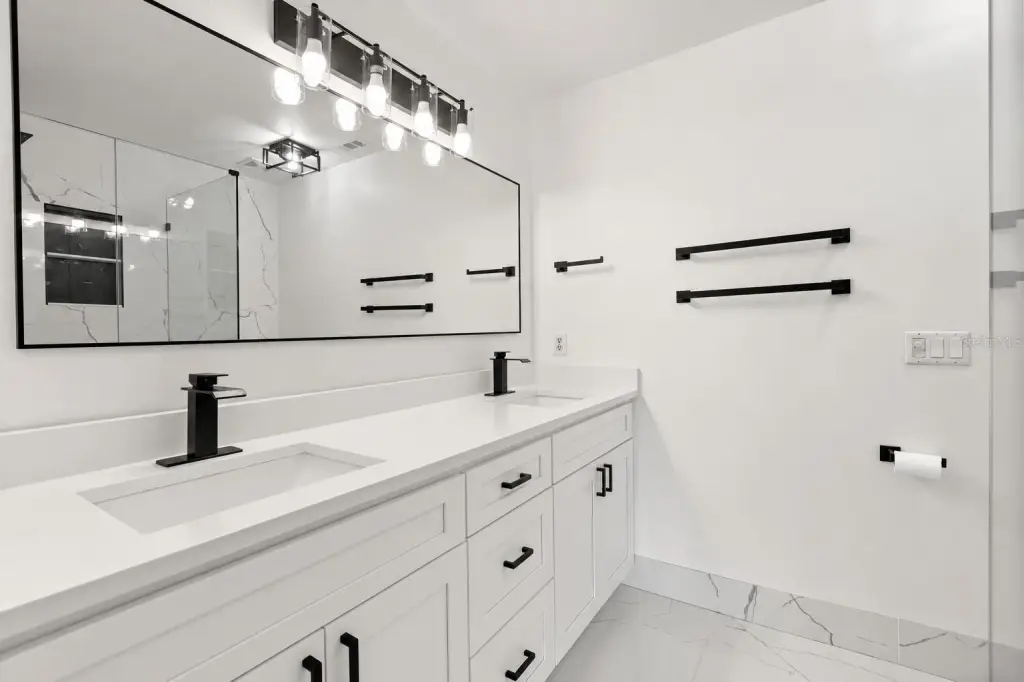
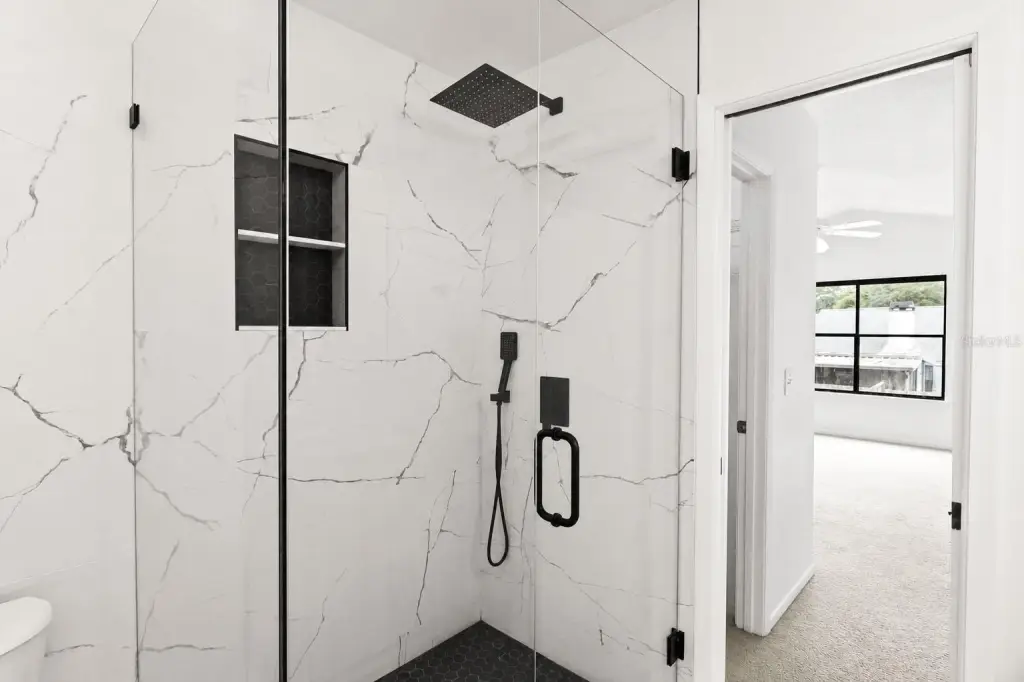
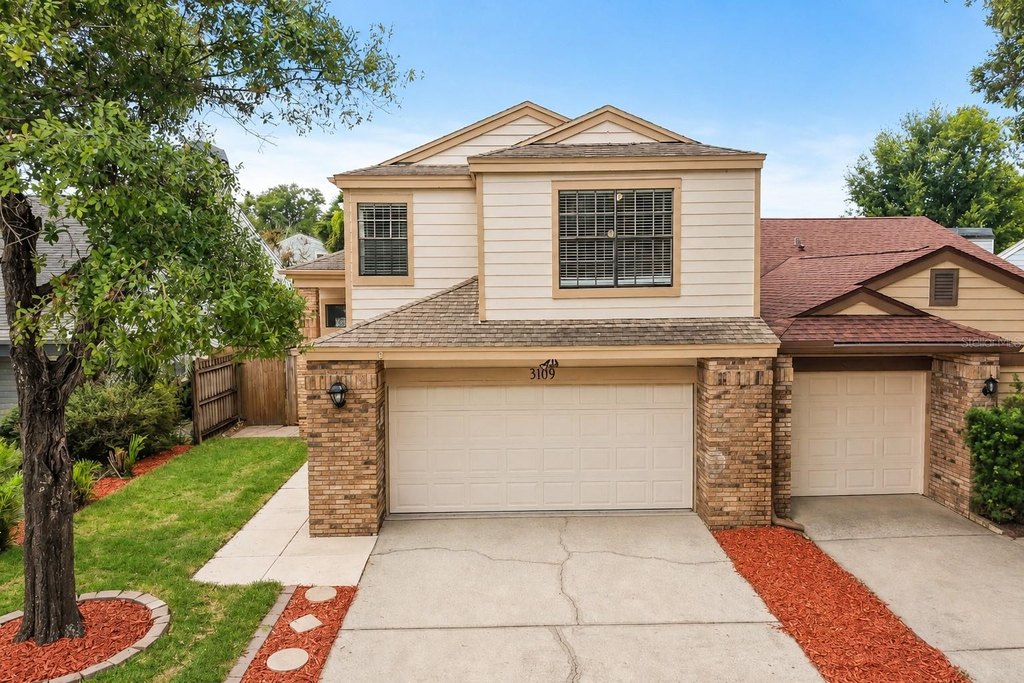
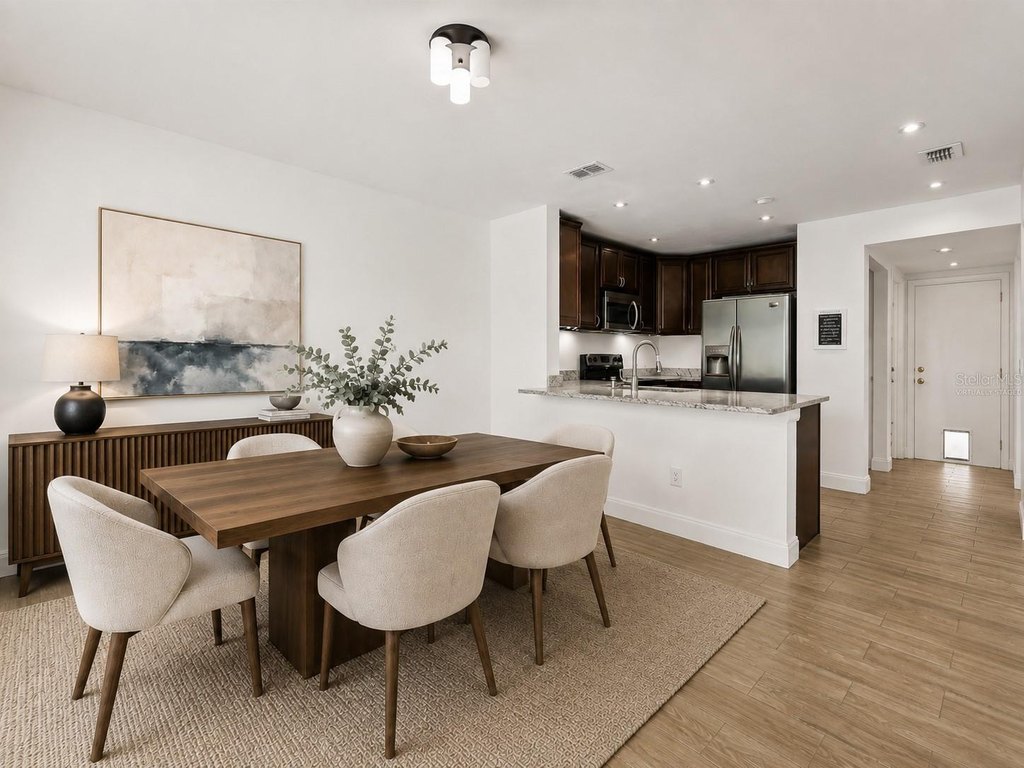
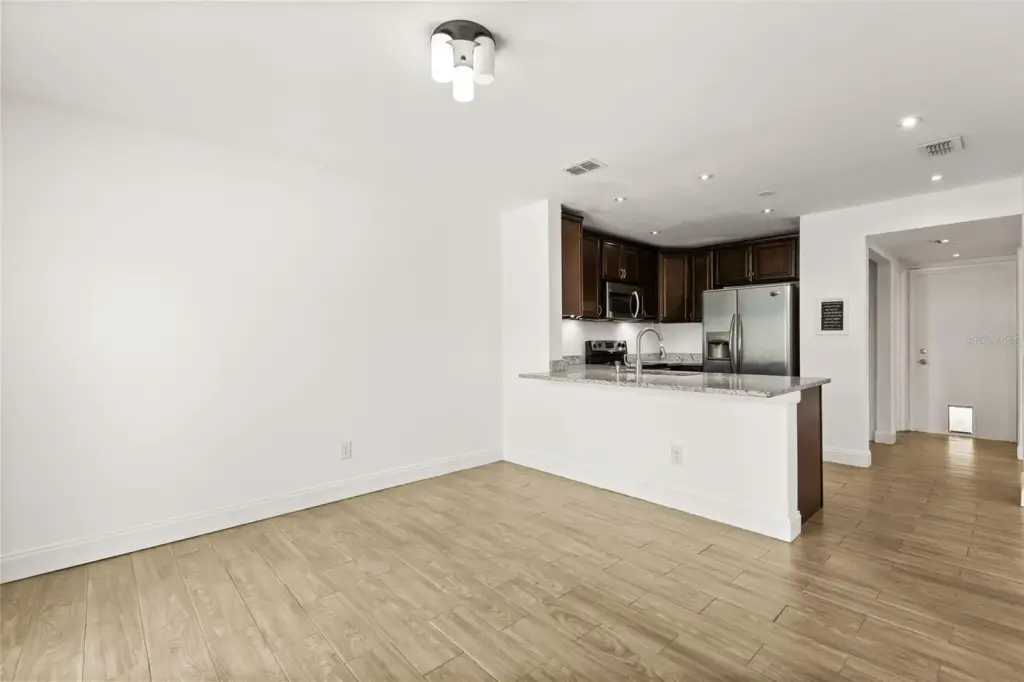
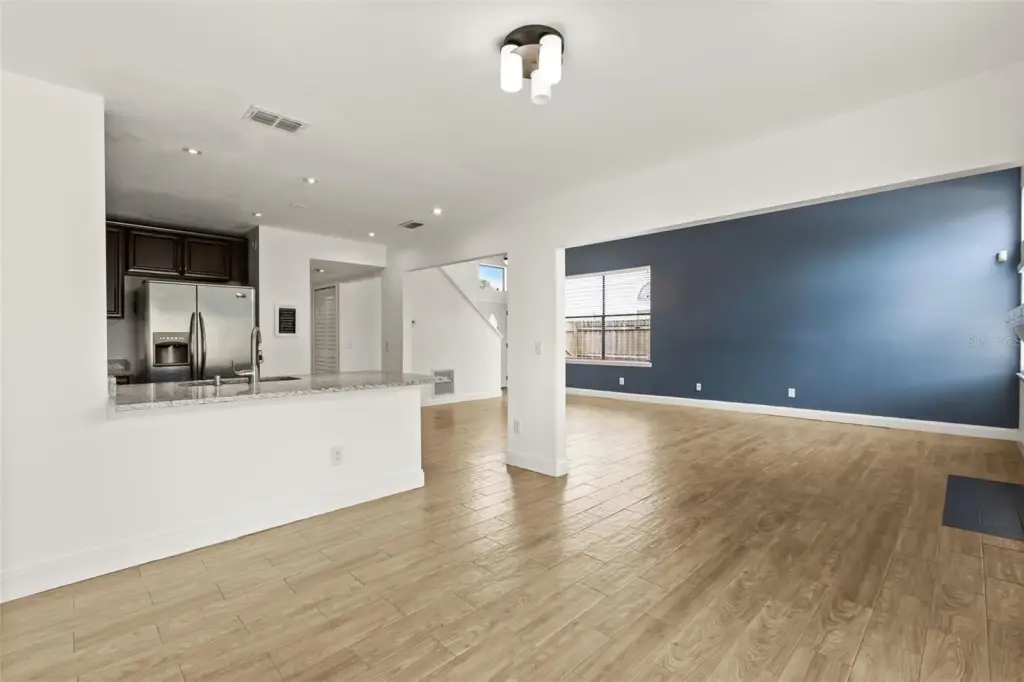
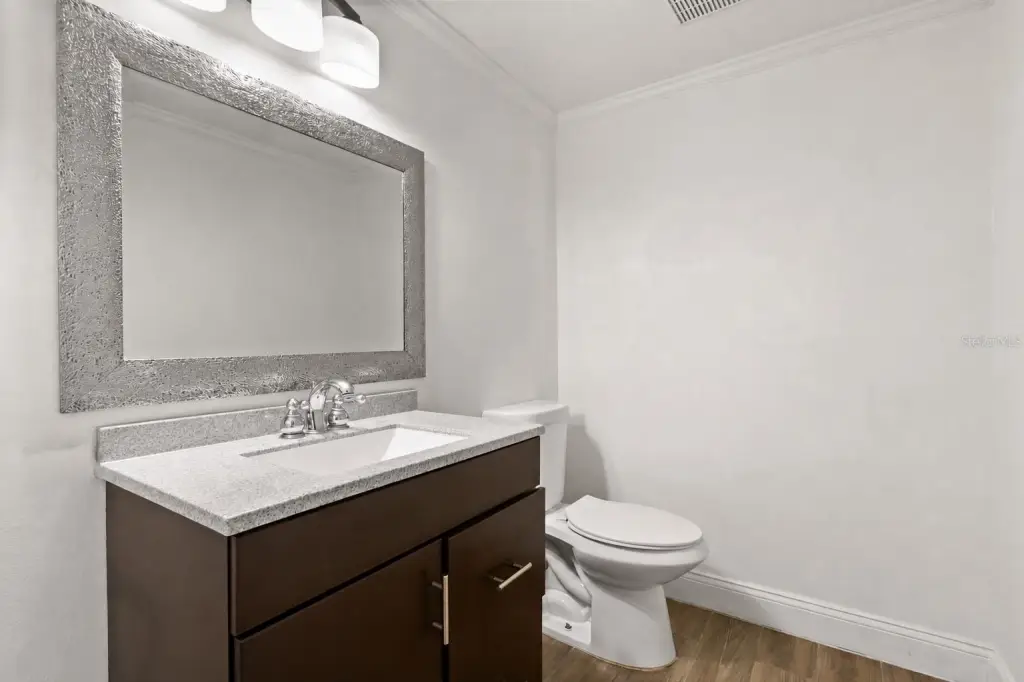
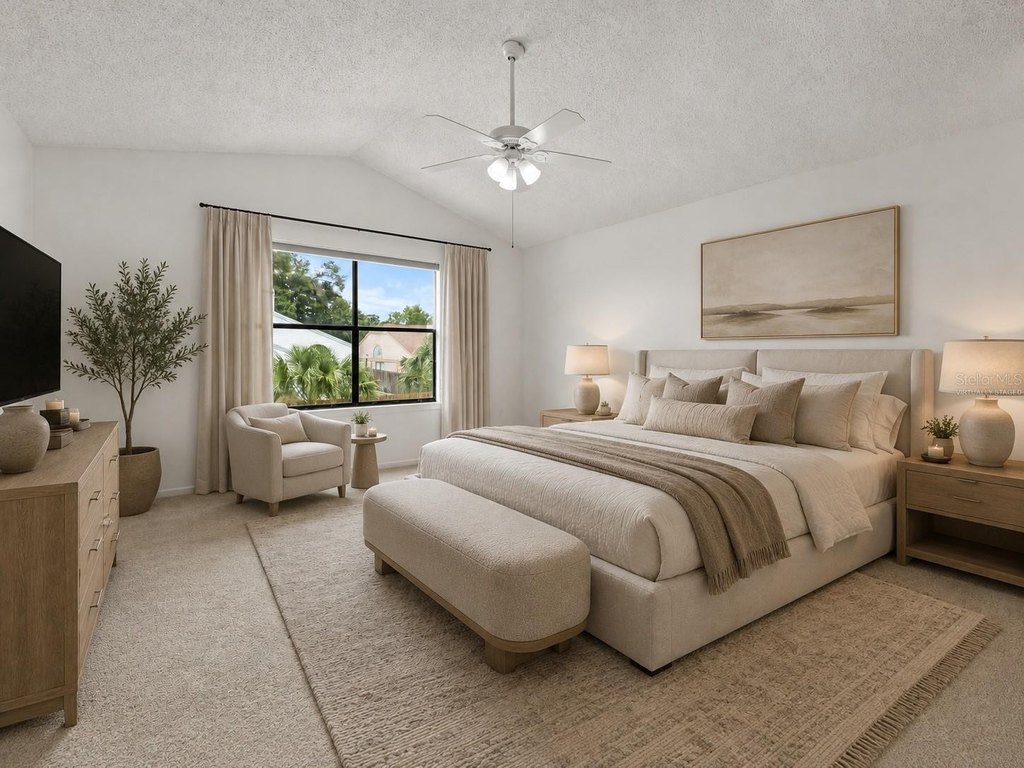
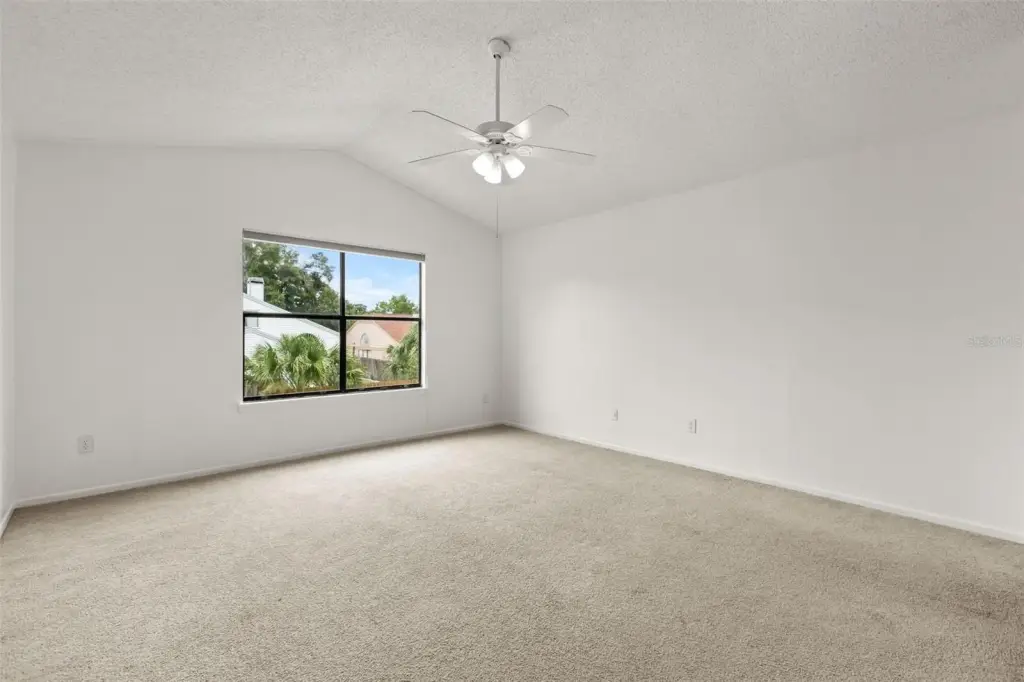
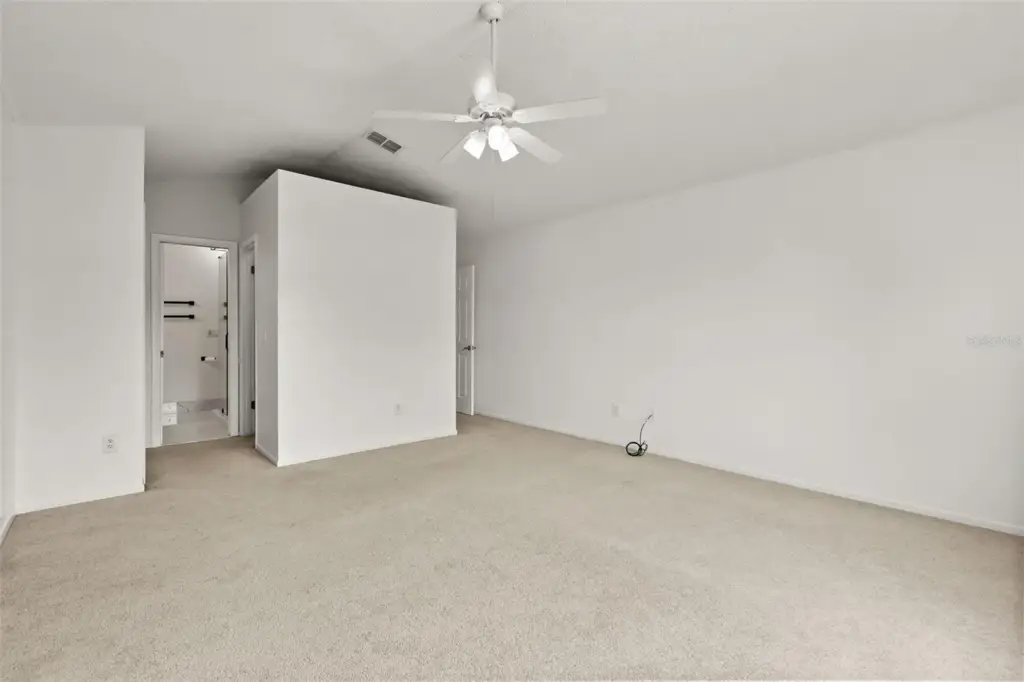
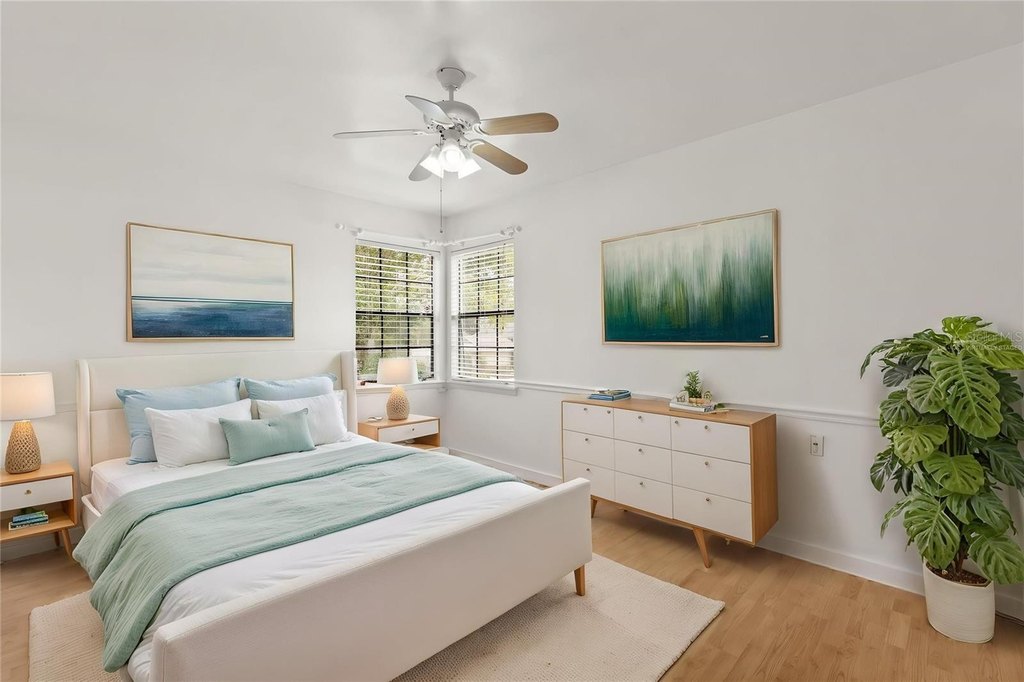
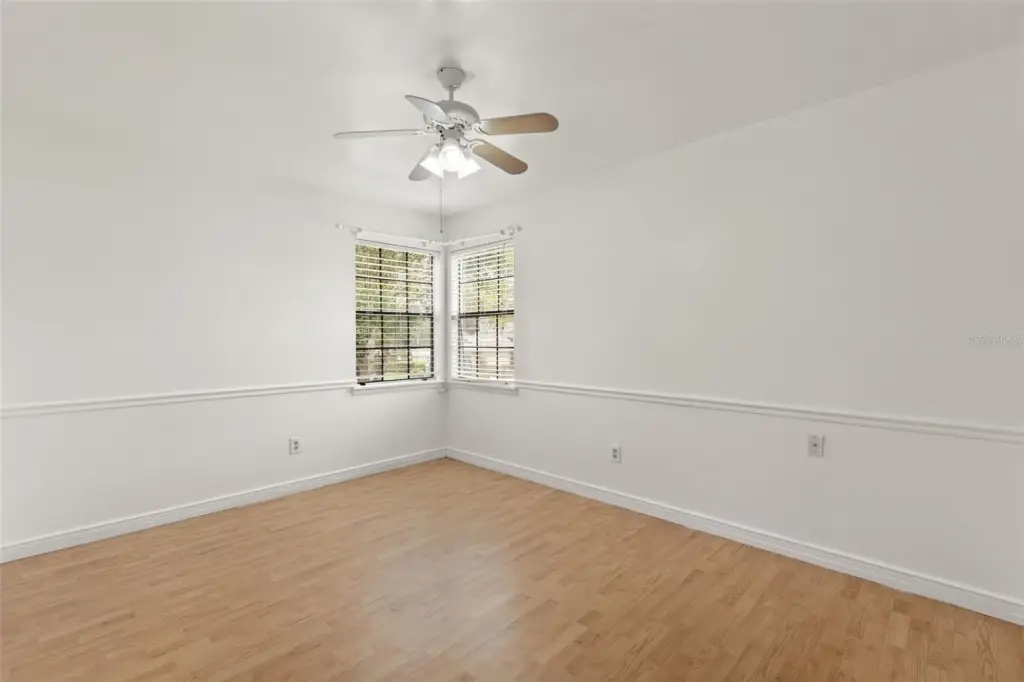
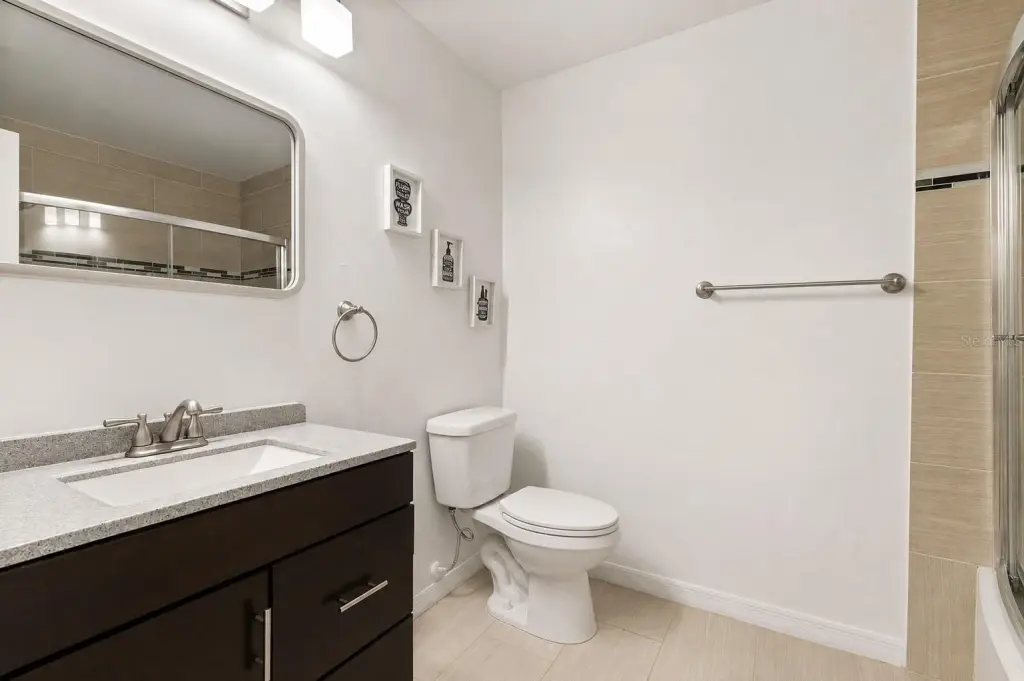
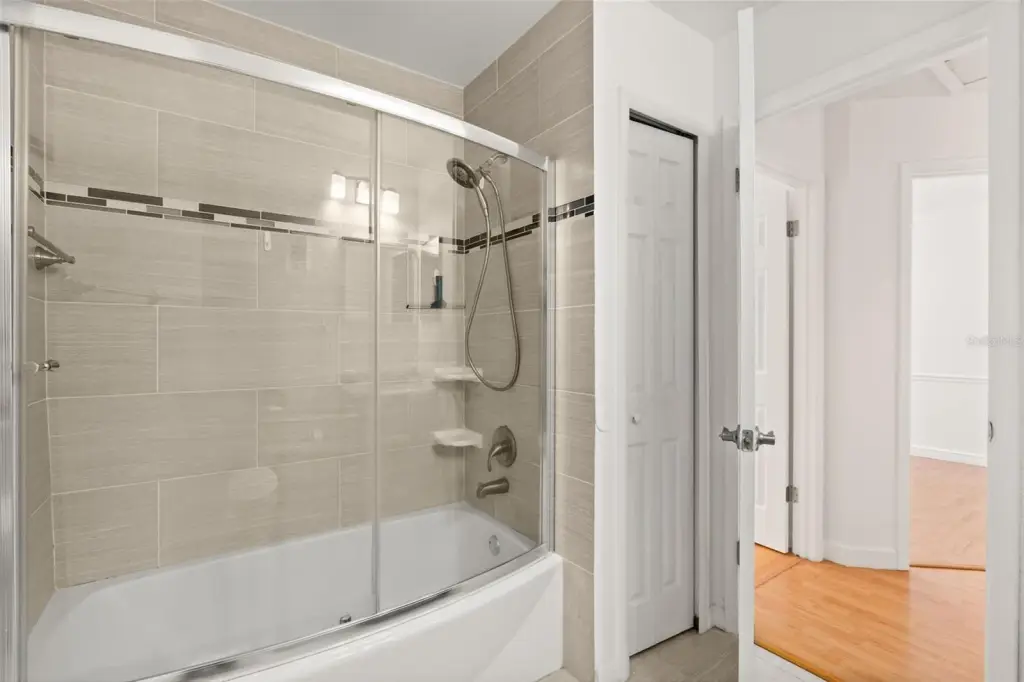
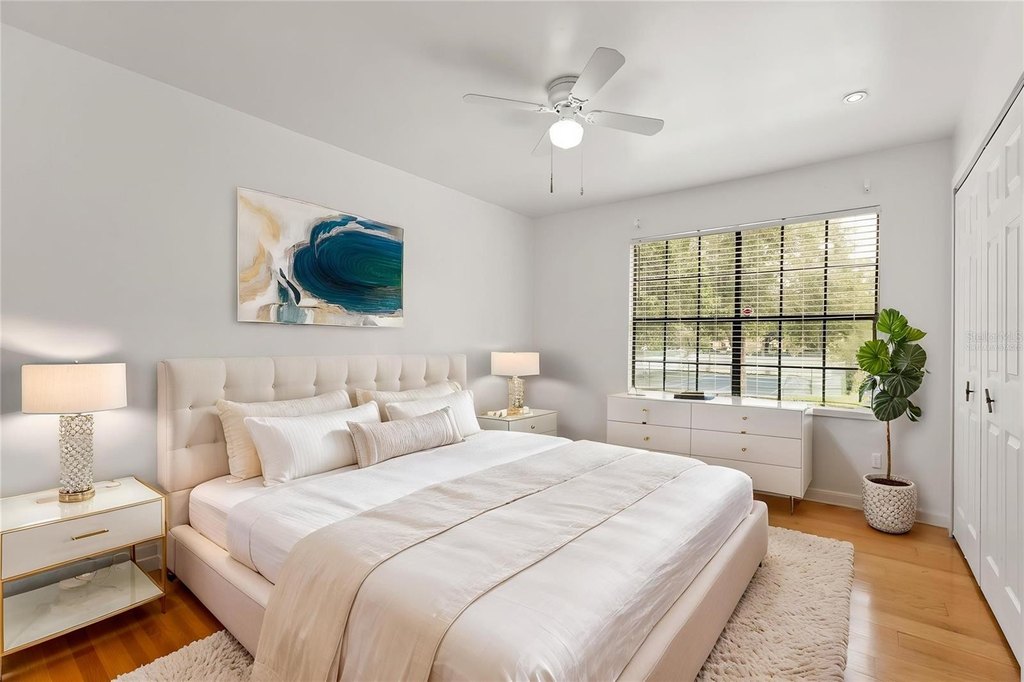
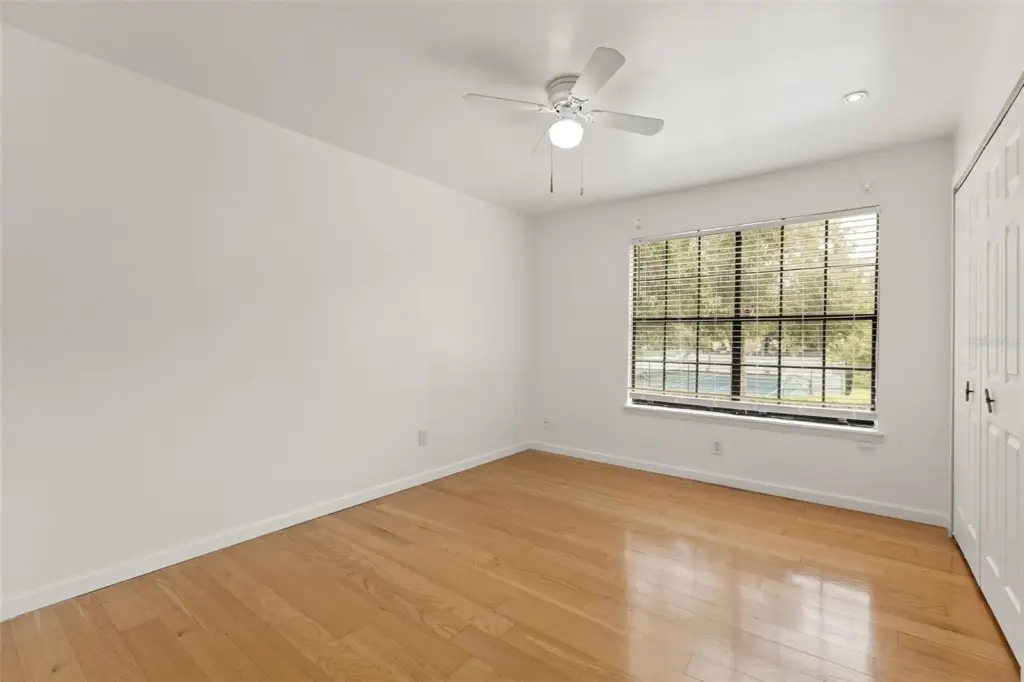
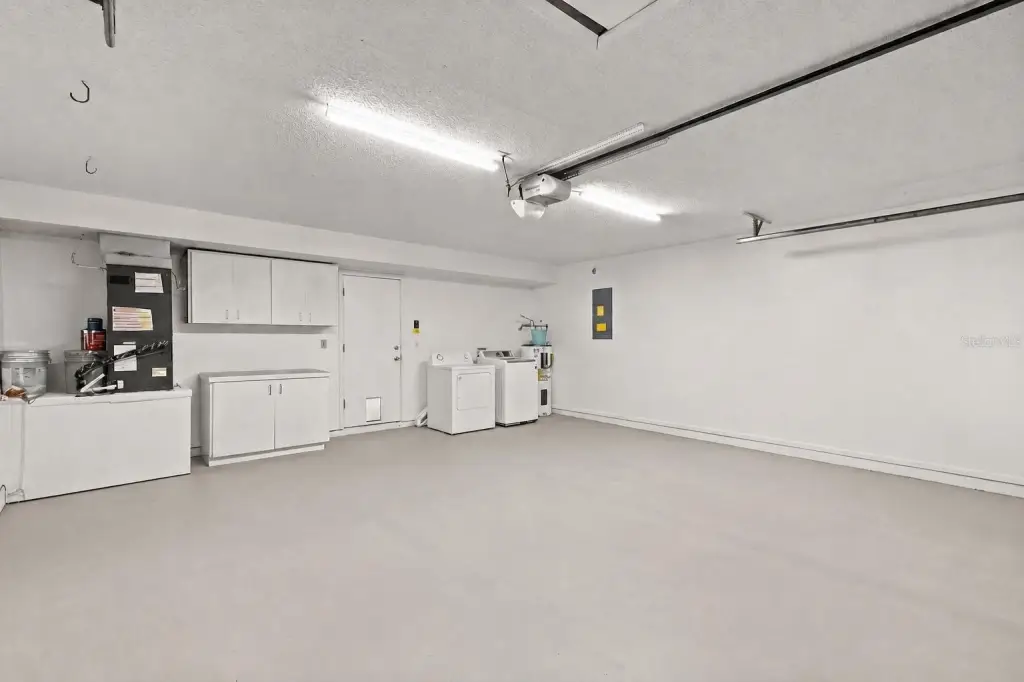
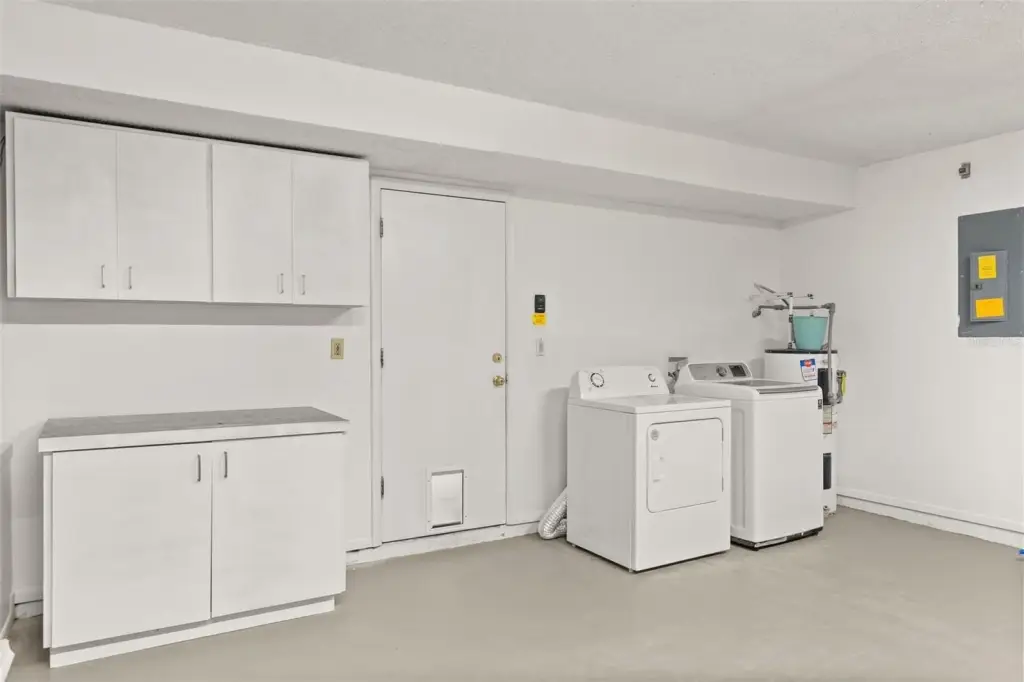
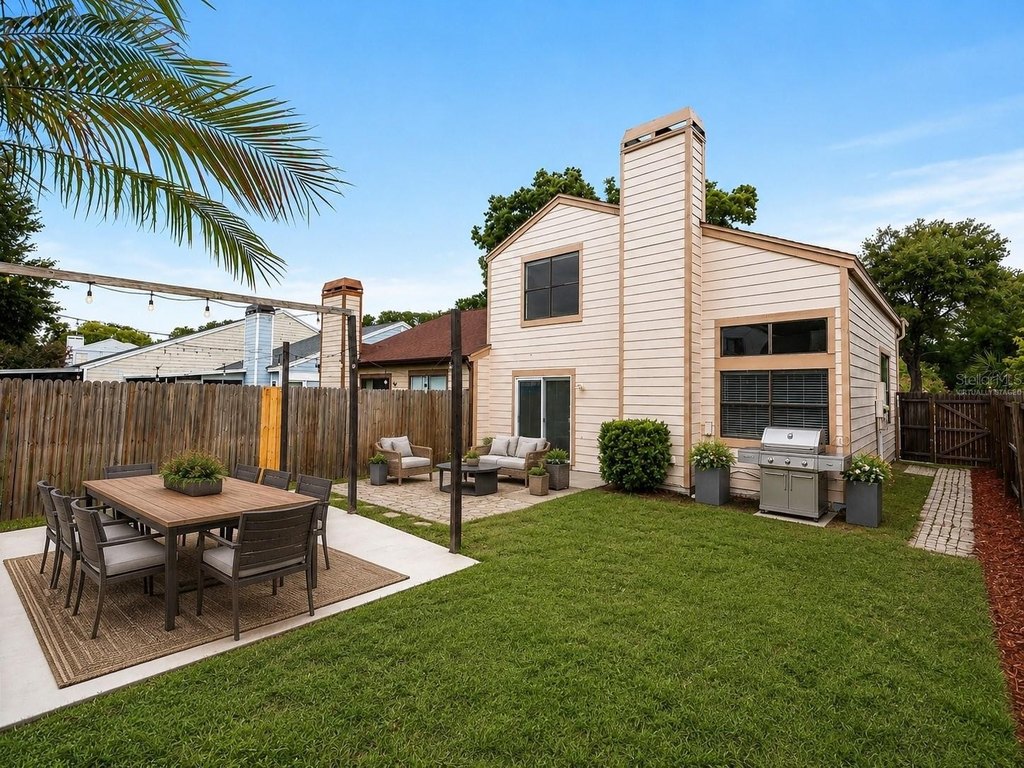
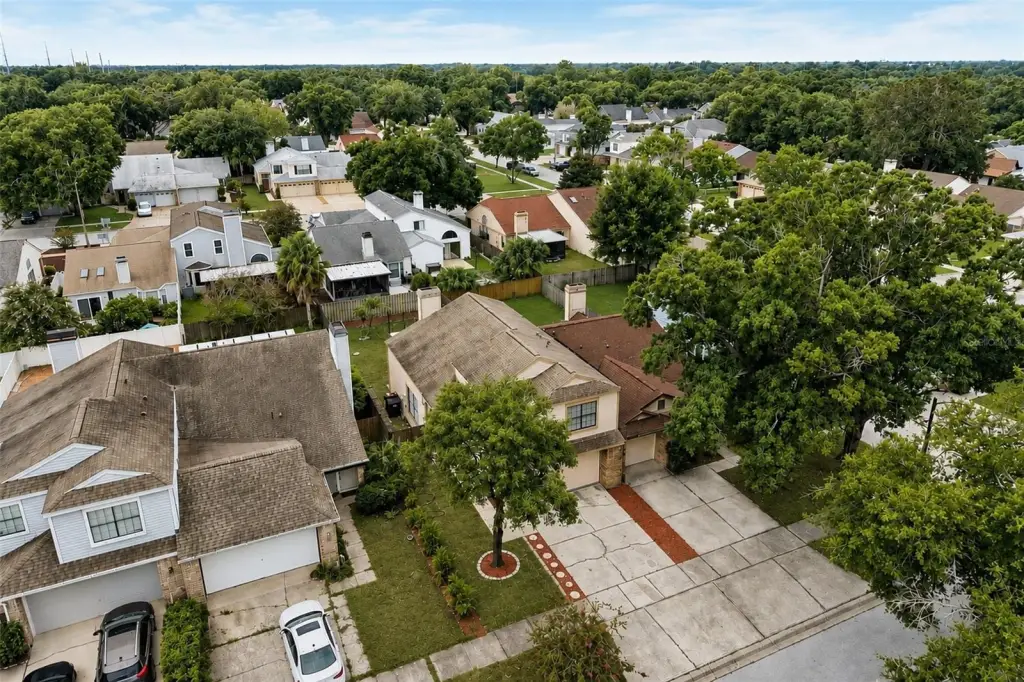
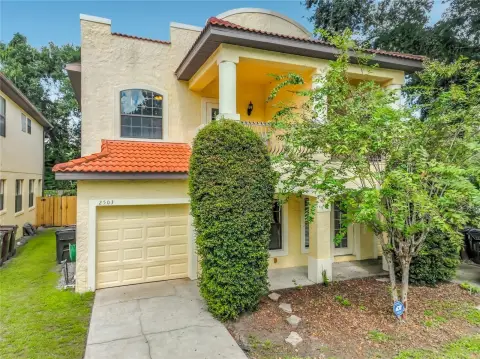
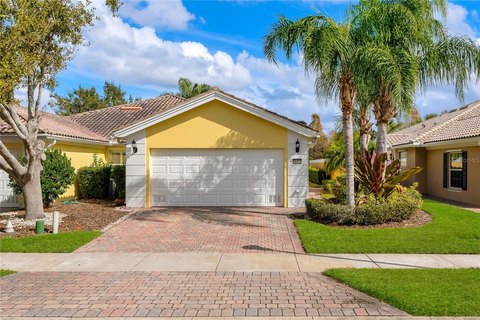
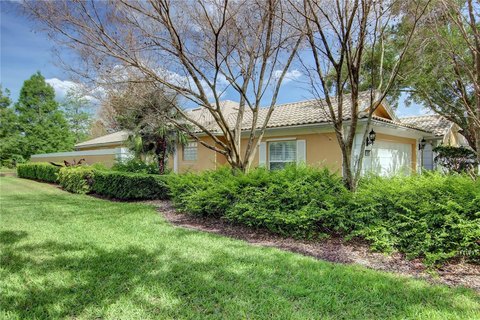
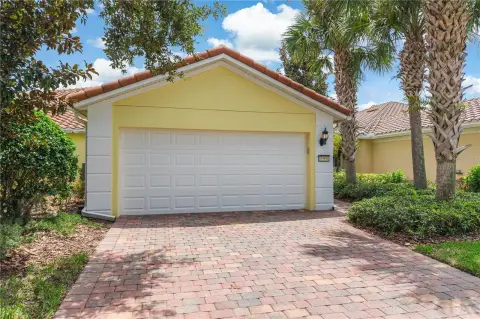
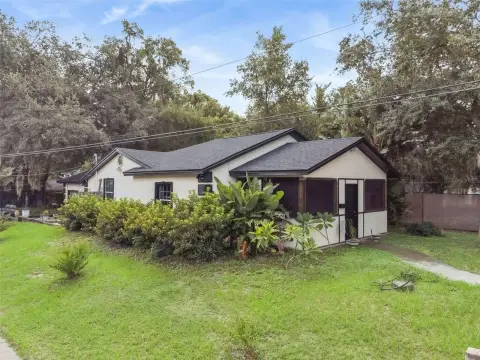
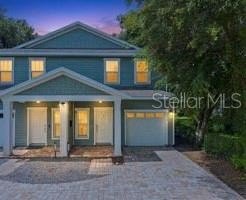
Configured as a half duplex attached on one side, this 1,624-square-foot residence has three upstairs bedrooms, including a primary suite with a walk-in closet and renovated bath. The main level combines a great room with a wood-burning fireplace, kitchen with granite counters and stainless appliances, separate dining room, and half bath. Tile flooring spans the main level, and sliding doors open to a fenced backyard with a paver patio and pergola. The attached garage accommodates two vehicles and has additional storage, laundry, and cabinetry. The property was built in 1989, repiped, and freshly painted inside and out in 2026.
Community amenities include a pool, tennis court, and covered picnic pavilion with brick barbecue grills. Zoning is R-3A/AN.
Community amenities include a pool, tennis court, and covered picnic pavilion with brick barbecue grills. Zoning is R-3A/AN.
Key Highlights
- 1,624‑square‑foot half duplex residence
- 0.1‑acre lot with fenced backyard, paver patio, and pergola
- Three bedrooms and renovated primary bathroom
Financial Insights
Estimated NOI and Cap Rate
NOI / Yr
$21,046
Cap Rate
5.77%
Suggested Prices Based on Cap Rates
Cap Rate 5%
$420,920
$420.9K
Cap Rate 7%
$300,657
$300.7K
Cap Rate 9%
$233,844
$233.8K
Market Conditions
NOI Build-Up for 1,624 SF
Gross rent
$40.9K $25.20/SF
− Vacancy
−$2.7K −$1.64/SF
EGI
$38.3K $23.56/SF
− OpEx
−$17.2K −$10.60/SF
NOI
$21.0K $12.96/SF
Area
Orlando, FL
Vacancy
6.50%
Lease Rate
$25.20 /SF/Yr
Expense Ratio
45.00%
Simulate Cap Rate and NOI
Suggested Prices Based on Cap Rates
Cap Rate 5%
$420,920
Cap Rate 7%
$300,657
Cap Rate 9%
$233,844
Alternative Uses
Best Use
Apartment 5plus
$300.7K
$263.1K – $350.8K
NOI $21,046 @ 7.0% cap · market cap 5.77%
Second Best
—
—
no second resolved use
Theoretical Best
Office A
$523.1K
$457.8K – $610.3K
NOI $36,620 @ 7.0% cap · market cap 10.04%
Zoning and permitted uses should be independently verified with authorities.
How Realmo checks its estimates
Property Analytics
Unlock full access to Insights
Subscribe to Realmo Intelligence
Open Analytics
Current Use
Lease Details
1
Residential units
Yes
Highway access
Location Intelligence
Trade Area within ½ mile
534
Businesses Nearby
Explore this area
Business Placement
Demographics for 32812, FL
34,586
Population
15,007
Households
2.3
Avg Household Size
39
Median Age
38%
College-Educated
92%
High-School Grad
8.5 sq mi
ZIP Area
4,069
Density / Sq Mi
$74,245
Median Household Income
$43,993
Median Earnings
$1,561
Median Rent
$342,800
Median Home Value
Check the figures for this property
Cap Rate, Value Estimation, Potential NOI and more
View Realmo Analytics



Frequently Asked Questions
What type of property is this?
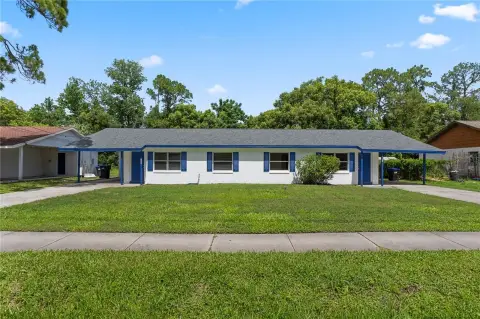
Residential income property - This half-duplex residence offers a two-level layout, private fenced yard, and an attached two-car garage.
Where is this residential income property located?
The property is located at 3109 BRIDGEFORD Drive Orlando, FL.
What is the asking price?
The asking price for this property is $364,900.
What are key features of this property?
This property features: 1,624‑square‑foot half duplex residence; 0.1‑acre lot with fenced backyard, paver patio, and pergola; Three bedrooms and renovated primary bathroom


