Executive Office Unit with
For Sale
$275,000
306 N Willis St, Visalia, CA 93291
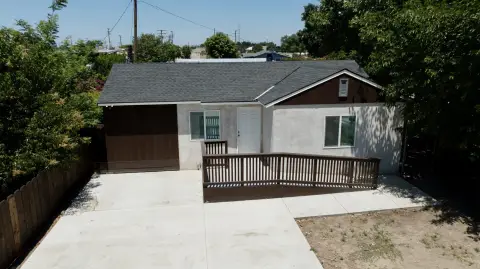
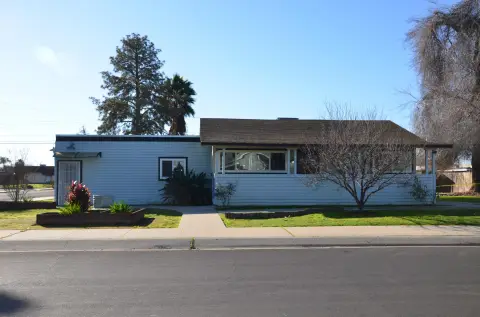
Downtown Mixed-Use zoning supports professional office uses with convenient on-site parking.
Property Size852 SF
Days on Market56
Property Features for 306 N Willis St
General Information
Standard status
Active
Size
852 SF
Class
C
Total Parking Spaces
2
Property subtype
Office - General Office
Zoning
Downtown Mixed-Use
Amenities
reception and waiting area
kitchenette
private restroom
built-in cabinetry
Building Details
Building Size
852 SF
Year Built
1969
Listing Agency:
Zeeb Commercial Real Estate
Listed By:
Marc Griffiths · License #01434697
(559) 679-6191
Source:
Commercialcafe
Added: Sep 1
Changed: Oct 21
Last Checked: Oct 24 at 1:40PM
Displayed information is deemed reliable but is not guaranteed and should be independently verified. All listing content including descriptions, pricing, images are the copyrighted material of Zeeb Commercial Real Estate

Ask AI about this property
Review the available facts, identify missing information and prepare questions for the agent.
Investment Insights
Based on property information with market context.
This executive office unit in Downtown Visalia offers a reception and waiting area, two private offices, a kitchenette, and a dedicated restroom. Built-in cabinetry adds practical storage and a finished professional setting. The property was built in 1969 and is offered for sale.
Two covered private parking spaces are located on site. The property sits near Vintage Press restaurant in central Downtown Visalia and is within a Downtown Mixed-Use zone that permits a broad range of professional uses.
Two covered private parking spaces are located on site. The property sits near Vintage Press restaurant in central Downtown Visalia and is within a Downtown Mixed-Use zone that permits a broad range of professional uses.
Key Highlights
- Two private offices plus reception and waiting areas
- Kitchenette, private restroom, and built‑in cabinetry
- Two covered private on‑site parking spaces
Financial Insights
Estimated NOI and Cap Rate
NOI / Yr
$13,479
Cap Rate
4.90%
Suggested Prices Based on Cap Rates
Cap Rate 5%
$269,580
$269.6K
Cap Rate 7%
$192,557
$192.6K
Cap Rate 9%
$149,767
$149.8K
Market Conditions
NOI Build-Up for 852 SF
Gross rent
$22.5K $26.40/SF
− Vacancy
−$4.5K −$5.31/SF
EGI
$18.0K $21.09/SF
− OpEx
−$4.5K −$5.27/SF
NOI
$13.5K $15.82/SF
Area
Visalia, CA
Vacancy
20.10%
Lease Rate
$26.40 /SF/Yr
Expense Ratio
25.00%
Simulate Cap Rate and NOI
Suggested Prices Based on Cap Rates
Cap Rate 5%
$269,580
Cap Rate 7%
$192,557
Cap Rate 9%
$149,767
Alternative Uses
Best Use
Office B
$192.6K
$168.5K – $224.7K
NOI $13,479 @ 7.0% cap · market cap 4.90%
Second Best
—
—
no second resolved use
Theoretical Best
Office A
$233.4K
$204.2K – $272.3K
NOI $16,338 @ 7.0% cap · market cap 5.94%
Zoning and permitted uses should be independently verified with authorities.
How Realmo checks its estimates
Property Analytics
Contact the owner directly
Get the owner's phone numbers and email
Open Analytics
Current Use
Location Intelligence
Trade Area within ½ mile
3,239
Businesses Nearby
Explore this area
Business Placement
Demographics for 93291, CA
63,366
Population
19,866
Households
3.2
Avg Household Size
32
Median Age
24%
College-Educated
81%
High-School Grad
84.2 sq mi
ZIP Area
753
Density / Sq Mi
$81,502
Median Household Income
$41,778
Median Earnings
$1,331
Median Rent
$381,600
Median Home Value
Check the figures for this property
Cap Rate, Value Estimation, Potential NOI and more
View Realmo Analytics
Market
Vacancy Rate% for Office in West region






Frequently Asked Questions
What type of property is this?
Office unit - Downtown Mixed-Use zoning supports professional office uses with convenient on-site parking.
Where is this office unit located?
The property is located at 306 N Willis St Visalia, CA.
What is the asking price?
The asking price for this property is $275,000.
What are key features of this property?
This property features: Two private offices plus reception and waiting areas; Kitchenette, private restroom, and built‑in cabinetry; Two covered private on‑site parking spaces


