Updated Flex Space with
For Sale
$175,000
3005 S Lake Drive, Texarkana, TX 75501
Commercial Sale, Texarkana, TX
Property Size3,000 SF
Lot Size0.38 Acres
Price / SF$58.33
Days on Market167
Property Features for 3005 S Lake Drive
General Information
Property type
Commercial Sale
Property subtype
Other
Bathrooms
1
Full bathrooms
1
Rooms
Bathroom 1
Parking
20
Window features
Double Pane Windows
Subdivision
J W JOHNSON A-308
Lot features
Corner Lot
Directions
From S. Robison Road, turn East onto S. Lake Drive. #3005 is on your right - a few doors past Dairy Queen
Standard status
Active
Size
3,000 SF
Lot size
0.38 Acres
Utilities
Utilities
Cable Available
Sewer type
Public Sewer
Heating system
Central, Electric (Heating)
Cooling system
Electric, Central Air
Water source
Public
Amenities
classrooms
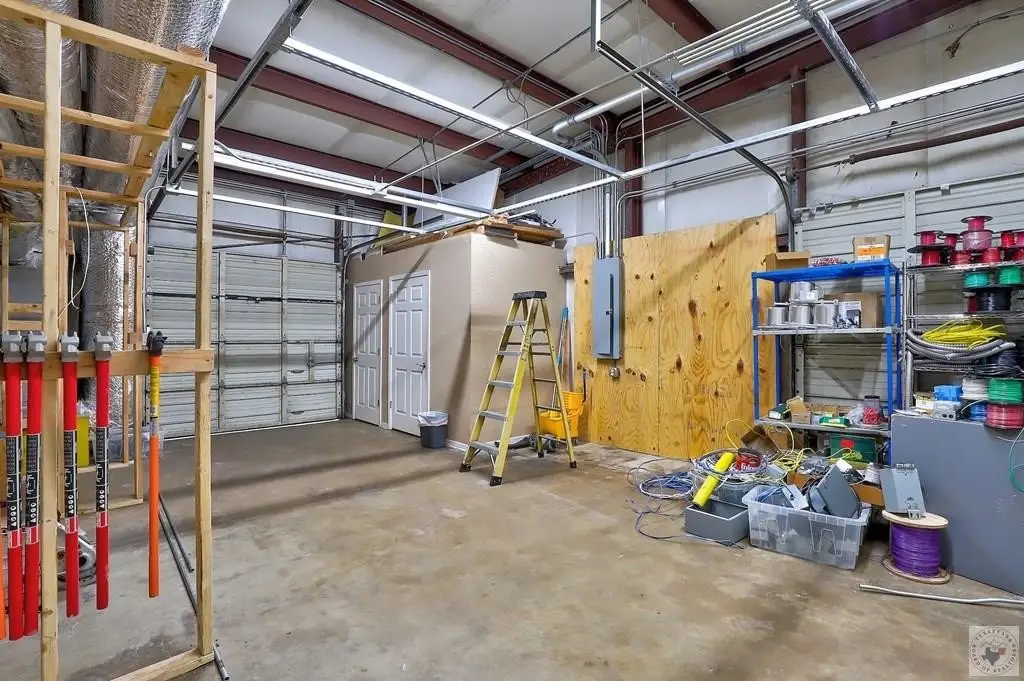
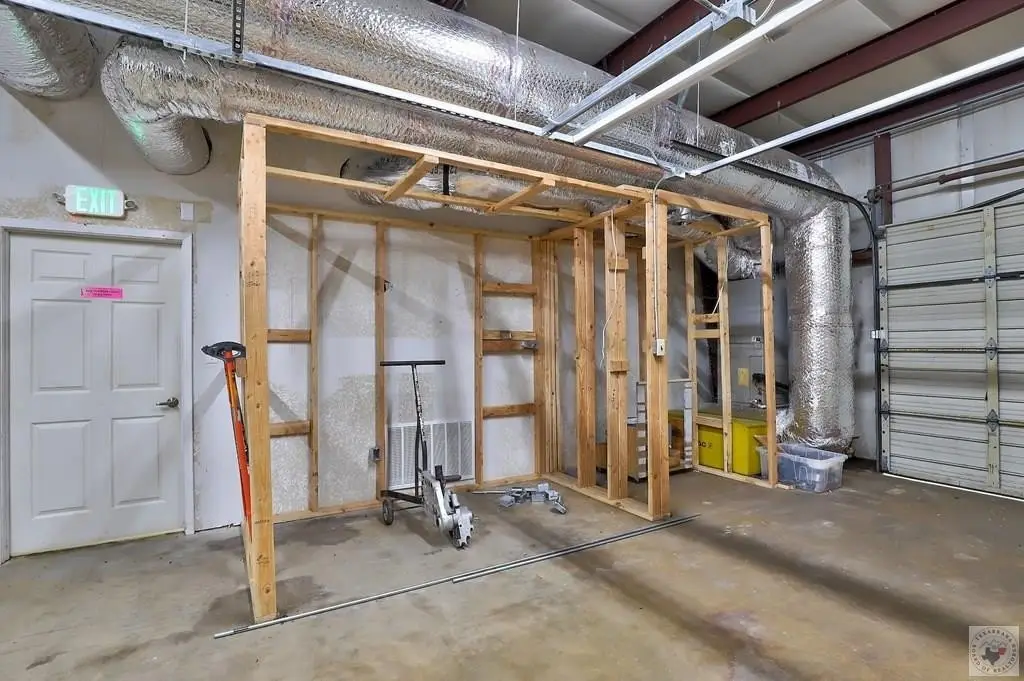
workroom/garage with overhead doors
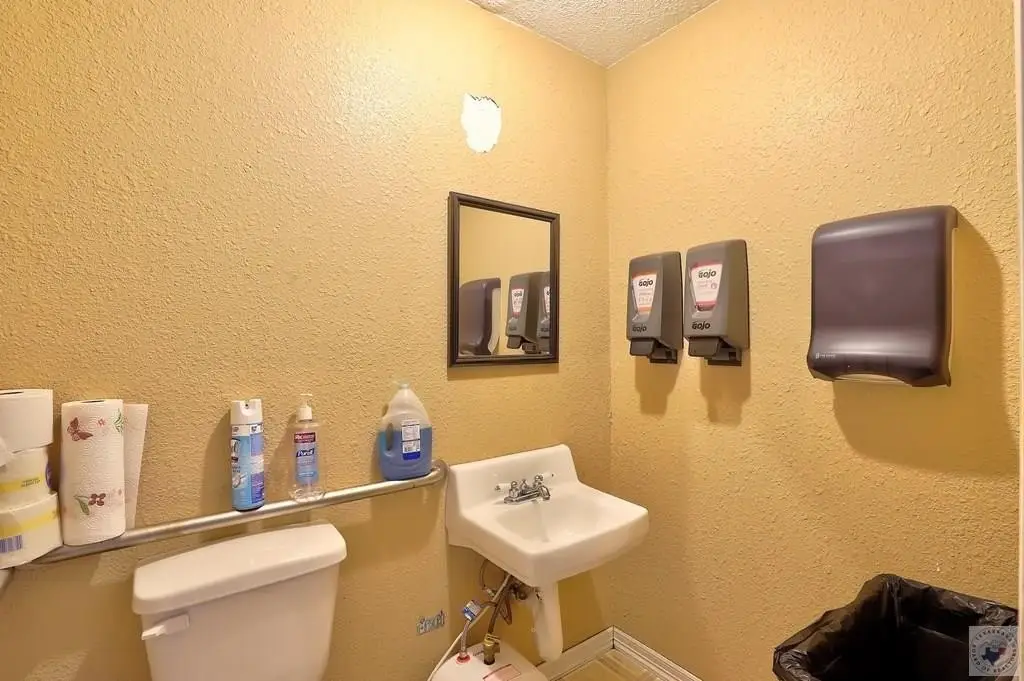
half bath
Building Details
Year built
1978
Floors in Building
1
Flooring type
Concrete
Building materials
Metal Siding
Roof type
Metal
Listing Agency:
Century 21 All Points
(903) 832-4561
Listed By:
Claudia Snow · License #SA00070704
(903) 277-0974
Added: Apr 24
Changed: Sep 16
Last Checked: Oct 7 at 6:06PM
MLS# 204840
Copyright © 2026 Texarkana Board of Realtors. All rights reserved. All information provided by the listing agent/broker is deemed reliable but is not guaranteed and should be independently verified.
Investment Insights
Based on property information with market context.
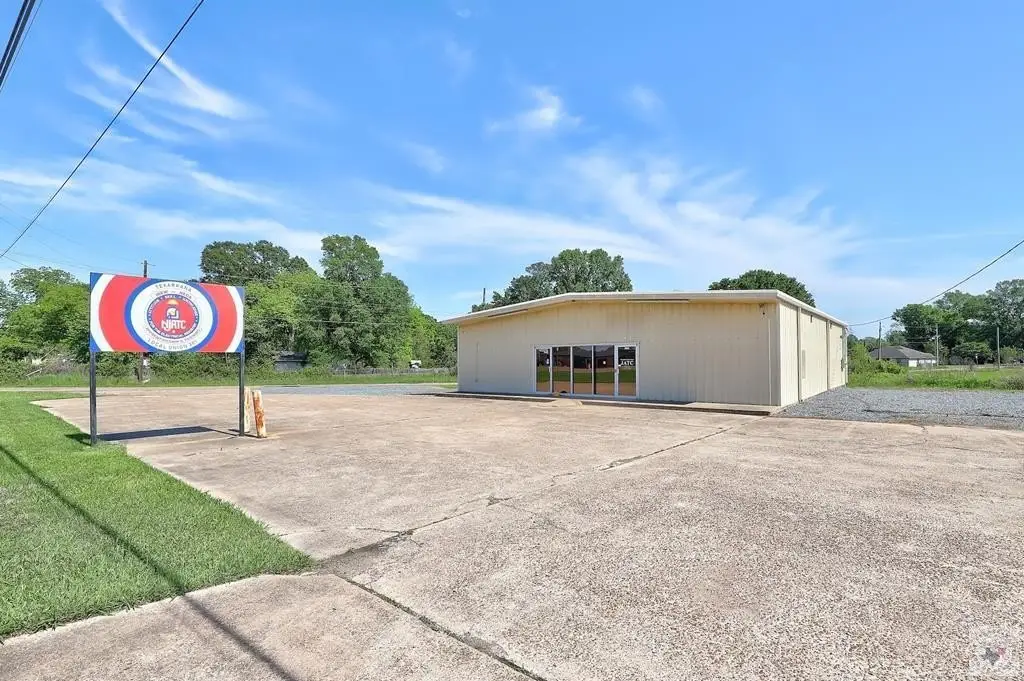
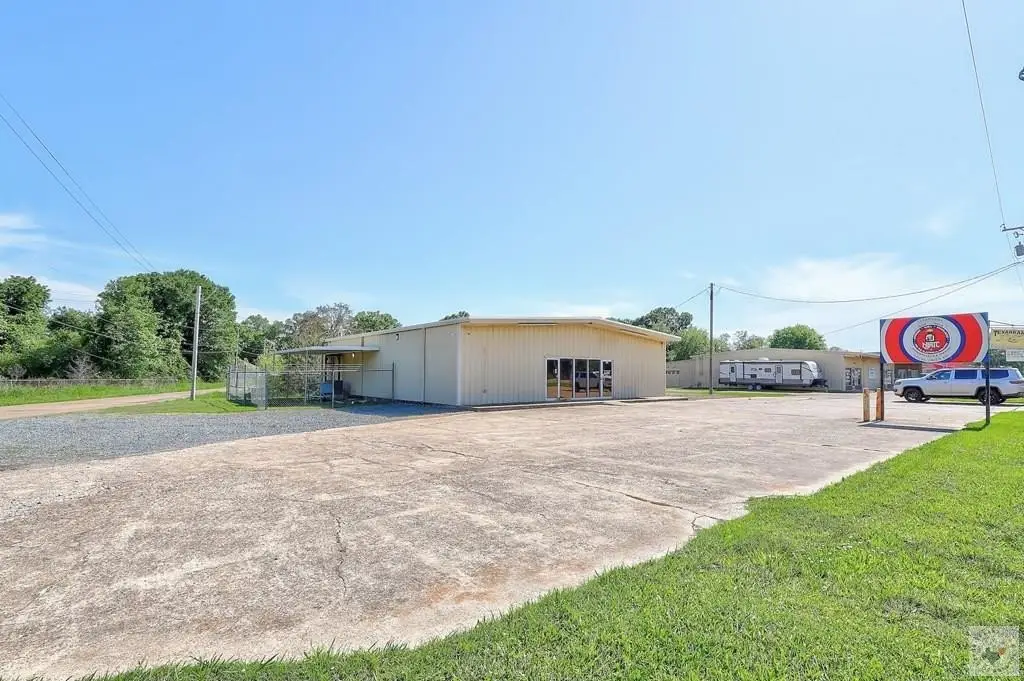
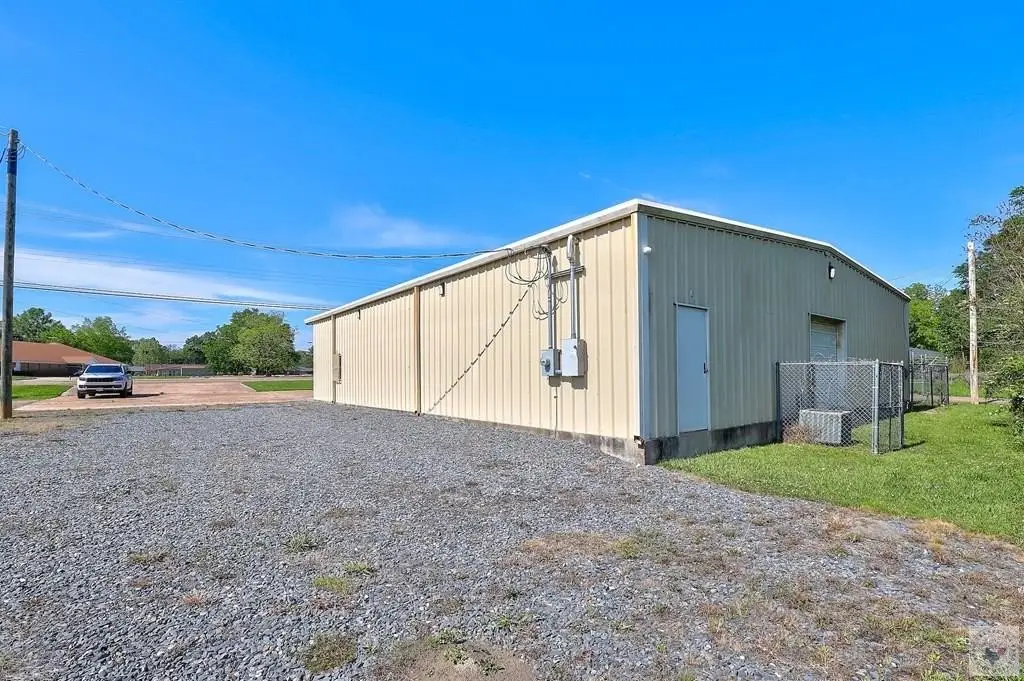
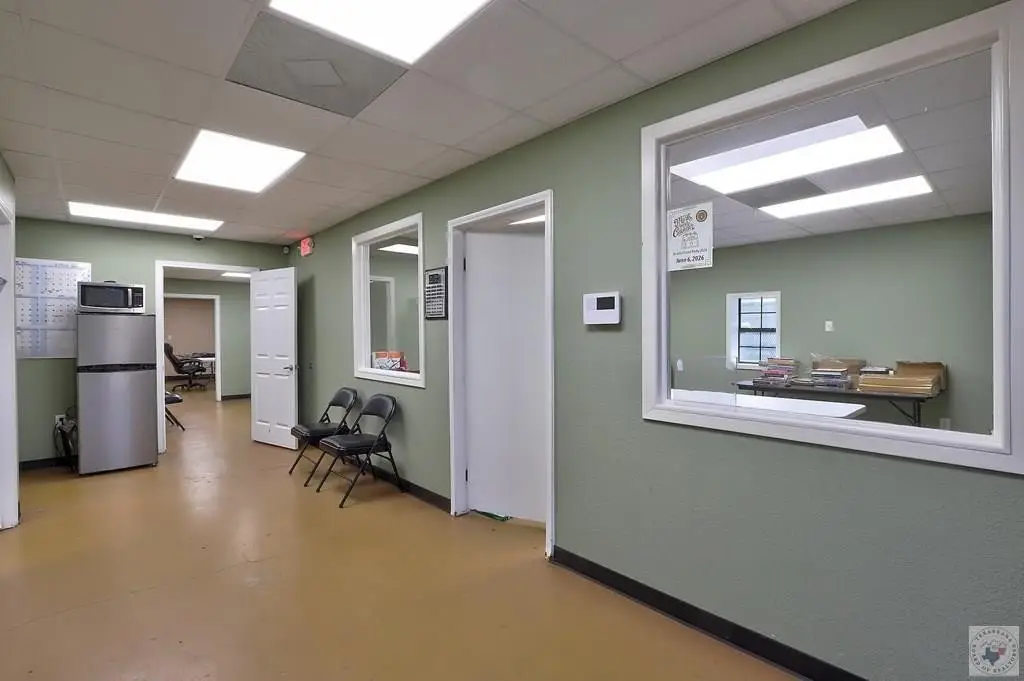
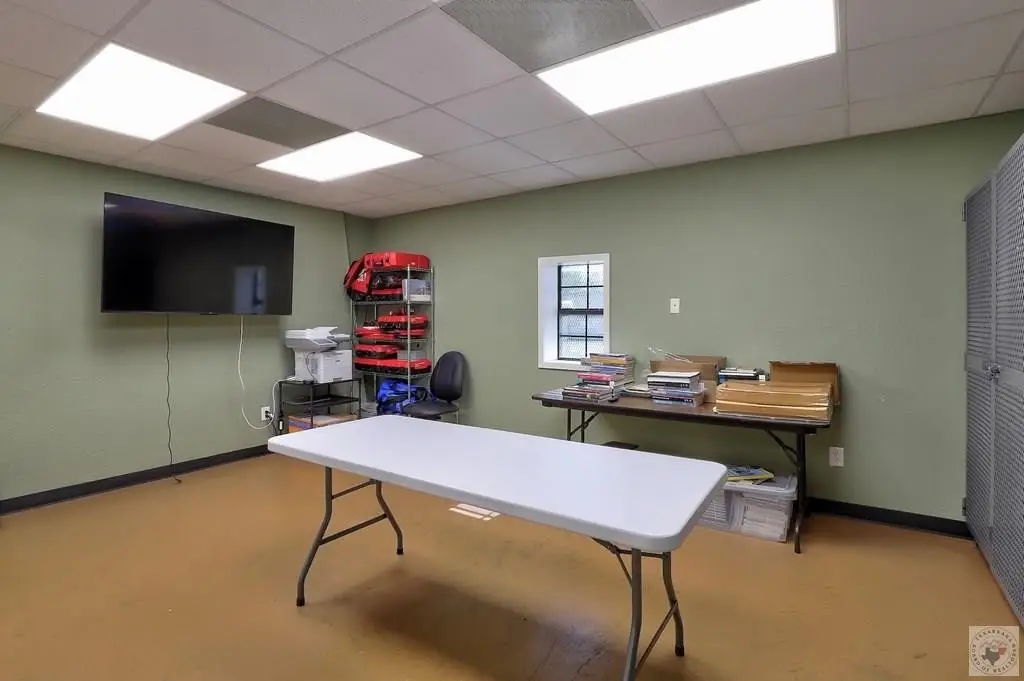
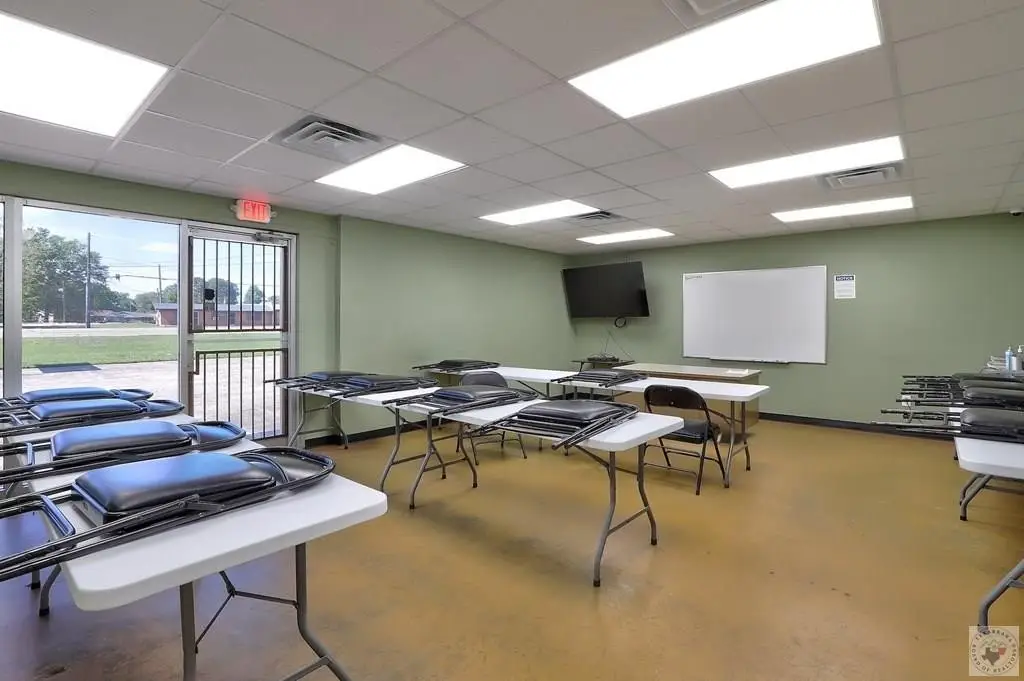
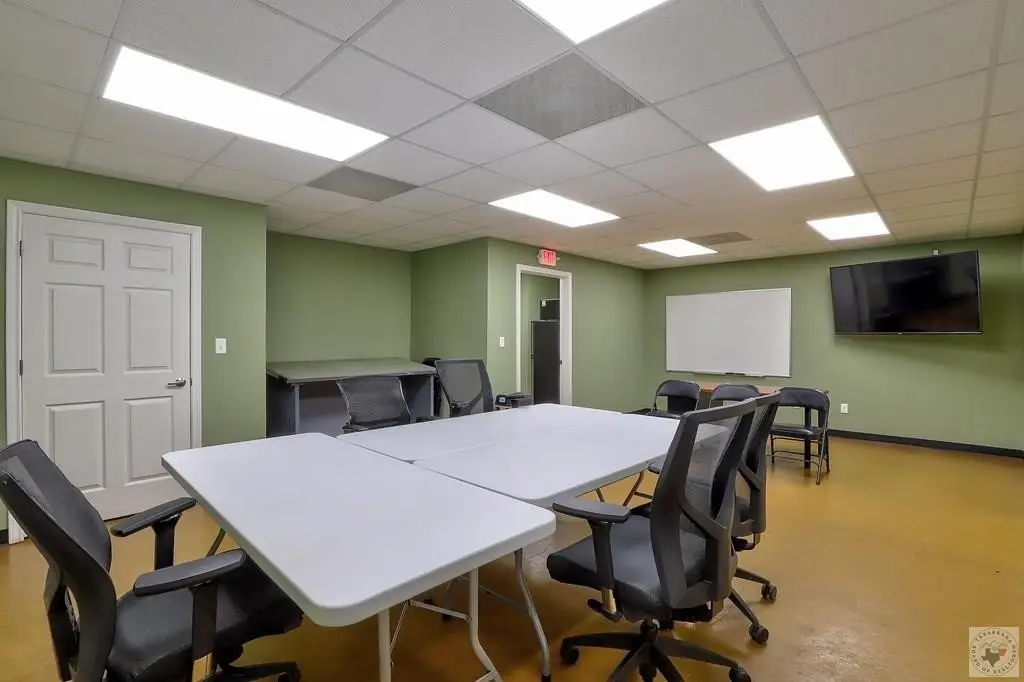
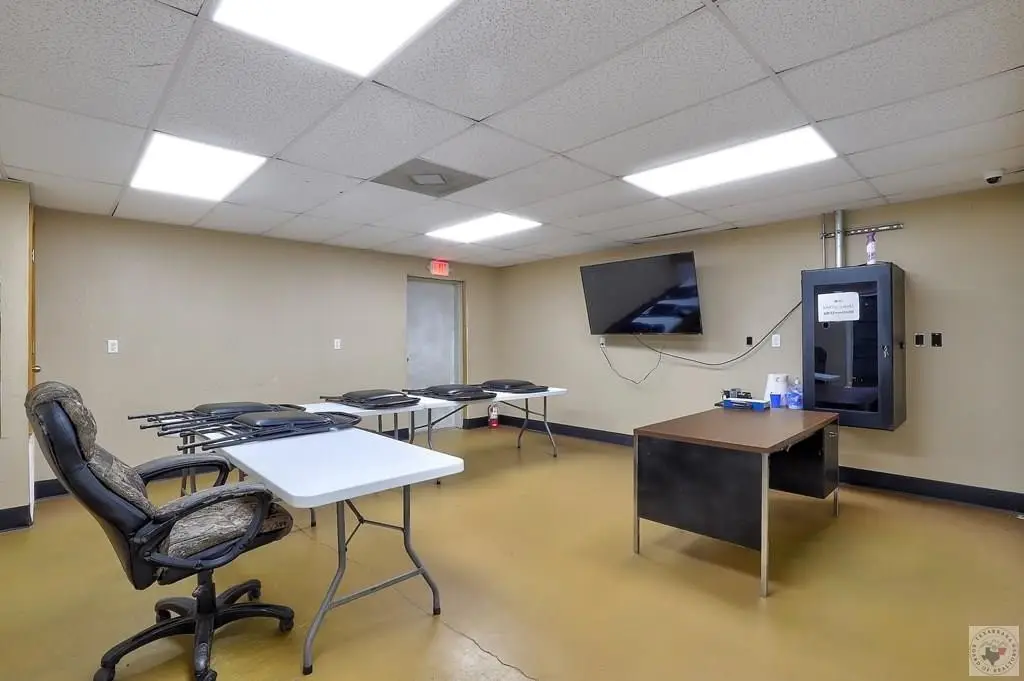
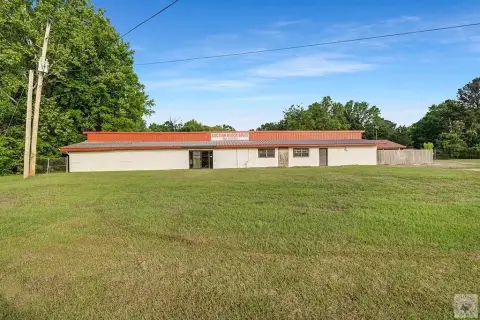
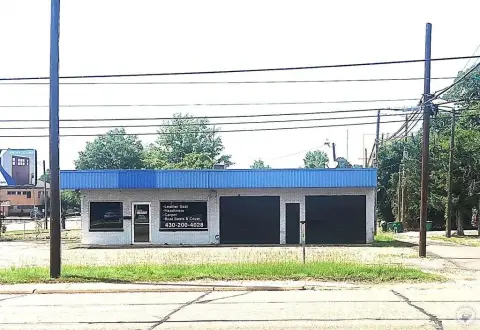
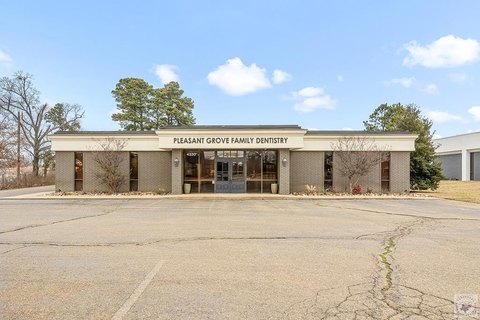
This 3,000-square-foot flex building occupies a 0.38-acre corner lot and combines office, instructional, and work-oriented areas. The interior includes four classrooms, an office section, a workroom or garage, a half bath, and stained concrete flooring. Two overhead doors support access to the work area, while two exterior-caged HVAC units provide heating and cooling throughout the building.
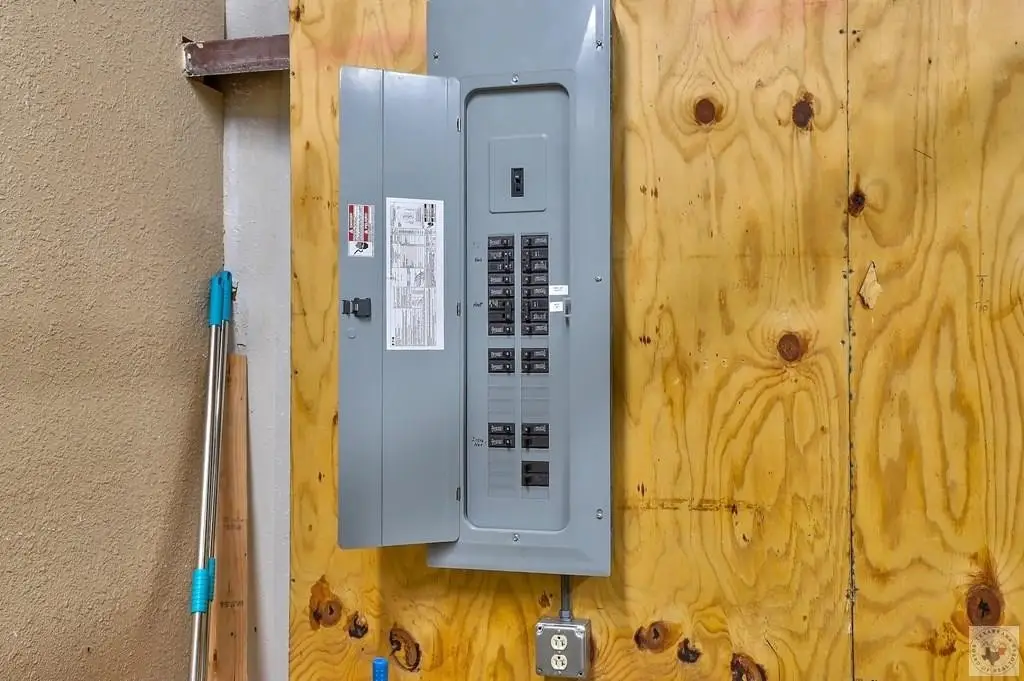
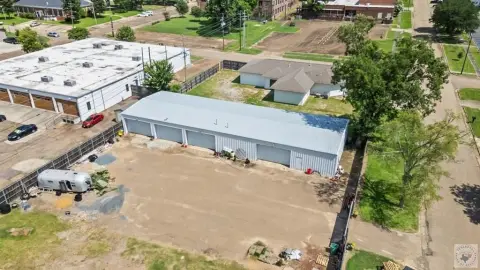
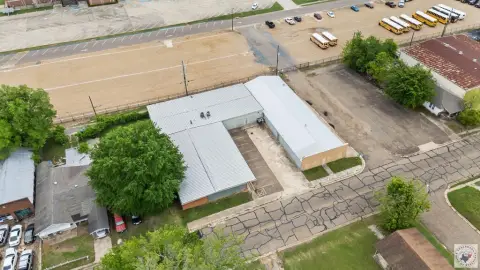
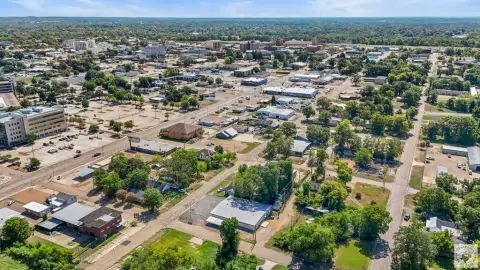
Located at 3005 S Lake Drive in Texarkana, the property fronts the corner of Harrison St. and S. Lake Drive. On-site parking includes approximately 20-29 existing spaces. The building was constructed in 1978 and updated in 2019 with new wiring, sheetrock, interior doors, drop ceilings, and other interior finishes. Public water and public sewer serve the property, with a metal exterior and metal roof.
Located at 3005 S Lake Drive in Texarkana, the property fronts the corner of Harrison St. and S. Lake Drive. On-site parking includes approximately 20-29 existing spaces. The building was constructed in 1978 and updated in 2019 with new wiring, sheetrock, interior doors, drop ceilings, and other interior finishes. Public water and public sewer serve the property, with a metal exterior and metal roof.
Key Highlights
- 3,000‑square‑foot flex building on 0.38 acres
- Four classrooms, office area, workroom or garage, and half bath
- Two overhead doors serving the workroom or garage
Financial Insights
Estimated NOI and Cap Rate
NOI / Yr
$15,449
Cap Rate
8.83%
Suggested Prices Based on Cap Rates
Cap Rate 5%
$308,980
$309.0K
Cap Rate 7%
$220,700
$220.7K
Cap Rate 9%
$171,656
$171.7K
Market Conditions
NOI Build-Up for 3,000 SF
Gross rent
$24.1K $8.04/SF
− Vacancy
−$2.1K −$0.68/SF
EGI
$22.1K $7.36/SF
− OpEx
−$6.6K −$2.21/SF
NOI
$15.4K $5.15/SF
Area
Bowie County, TX
Vacancy
8.50%
Lease Rate
$8.04 /SF/Yr
Expense Ratio
30.00%
Simulate Cap Rate and NOI
Suggested Prices Based on Cap Rates
Cap Rate 5%
$308,980
Cap Rate 7%
$220,700
Cap Rate 9%
$171,656
Alternative Uses
Best Use
Office B
$716.9K
$627.3K – $836.4K
NOI $50,181 @ 7.0% cap · market cap 28.67%
Second Best
Industrial
$220.7K
$193.1K – $257.5K
NOI $15,449 @ 7.0% cap · market cap 8.83%
Theoretical Best
Hotel Hospitality
$2.26M
$1.98M – $2.64M
NOI $158,175 @ 7.0% cap · market cap 90.39%
Zoning and permitted uses should be independently verified with authorities.
Property Analytics
Unlock full access to Insights
Subscribe to Realmo Intelligence
Open Analytics
Current Use
Lease Details
2
Drive-in doors
Single-tenant
Tenancy
Yes
Utilities to site
Location Intelligence
Trade Area within ½ mile
110
Businesses Nearby
Under-served
Demand for This Use
Explore this area
Business Placement
Demographics for 75501, TX
36,423
Population
15,302
Households
2.4
Avg Household Size
38
Median Age
15%
College-Educated
86%
High-School Grad
96.3 sq mi
ZIP Area
378
Density / Sq Mi
$46,782
Median Household Income
$33,758
Median Earnings
$904
Median Rent
$125,700
Median Home Value
Check the figures for this property
Cap Rate, Value Estimation, Potential NOI and more
View Realmo Analytics
Market
Vacancy Rate% for Office in South region

Questions? Ask Rey
Realmo’s AI knows this listing — price, zoning, demand, history. Ask anything.




Frequently Asked Questions
What type of property is this?
Flex space - Corner-lot facility with classrooms, office area, workroom, overhead doors, and fully heated and cooled interiors.
Where is this flex space located?
The property is located at 3005 S Lake Drive Texarkana, TX.
What is the asking price?
The asking price for this property is $175,000.
What are key features of this property?
This property features: 3,000‑square‑foot flex building on 0.38 acres; Four classrooms, office area, workroom or garage, and half bath; Two overhead doors serving the workroom or garage