Updated Duplex with Finished
For Sale
$259,000
Pending
29 Higby Rd, Utica, NY 13501
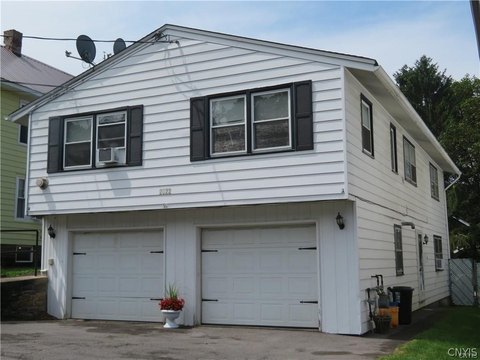
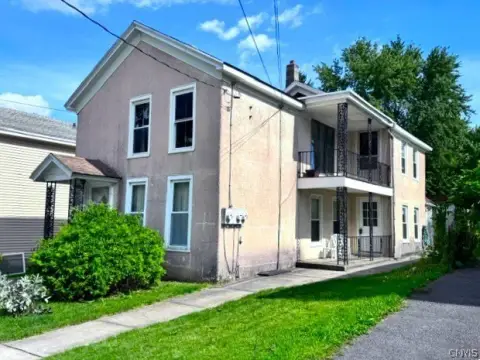
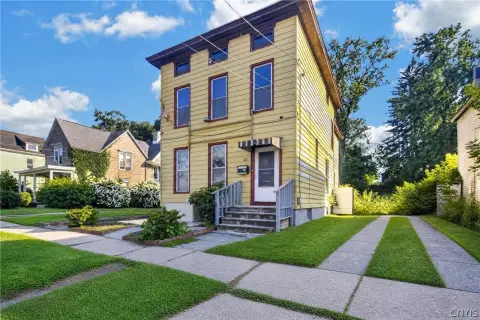
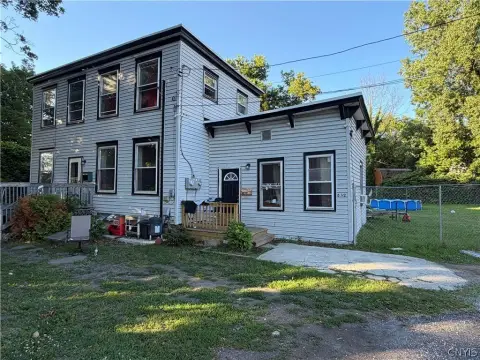
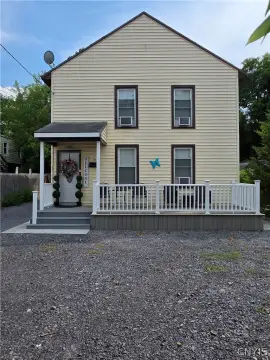
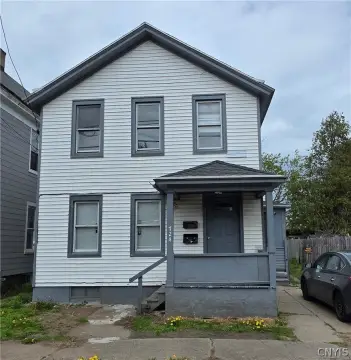
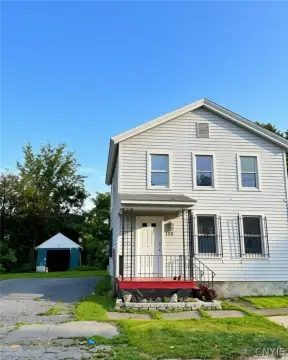
Two units feature covered porches, while the lower apartment also includes a rear deck.
Property Size1,993 SF
Days on Market59
Property Features for 29 Higby Rd
General Information
Standard status
Pending
Size
1,993 SF
Property subtype
Multi Family
Site & Location
Public Transit
Yes
Utilities to Site
Yes
Additional Details
Multifamily Units
2
Taxes and HOA fees
Annual Taxes
$4,804
Building Details
Building Size
1,993 SF
Year Built
1925
Buildings
1
Stories
3
Units
2
Listed By:
Carol Scampone
(315) 794-9096
Source:
Elliman
Added: Aug 18
Changed: Oct 9
Last Checked: Oct 15 at 1:17AM
Displayed information is deemed reliable but is not guaranteed and should be independently verified. All listing content including descriptions, pricing, images are the copyrighted material of Carol Scampone

Ask AI about this property
Review the available facts, identify missing information and prepare questions for the agent.
Investment Insights
Based on property information with market context.
This two-unit duplex, built in 1925, offers an updated interior with hardwood flooring across most of the home. Both apartments include central air, with the exception of the finished family room serving the upper unit. That room occupies the former attic area and adds distinctive finished space to the upper apartment. The first-floor living room is large enough to accommodate combined living and dining functions.
Each apartment has a covered front porch, and the lower unit also opens to a rear deck. The property includes a wooded area behind the home along with ample parking. Tenants pay their own utilities, including water. The home is located near shopping, restaurants, banking, and public transportation at 29 Higby Rd in Utica, New York.
Each apartment has a covered front porch, and the lower unit also opens to a rear deck. The property includes a wooded area behind the home along with ample parking. Tenants pay their own utilities, including water. The home is located near shopping, restaurants, banking, and public transportation at 29 Higby Rd in Utica, New York.
Key Highlights
- Two‑unit duplex built in 1925
- Finished former attic family room for the upper apartment
- Central air in both units, except the third‑floor family room
Financial Insights
Estimated NOI and Cap Rate
NOI / Yr
$18,051
Cap Rate
6.97%
Suggested Prices Based on Cap Rates
Cap Rate 5%
$361,020
$361.0K
Cap Rate 7%
$257,871
$257.9K
Cap Rate 9%
$200,567
$200.6K
Market Conditions
NOI Build-Up for 1,993 SF
Gross rent
$27.5K $13.80/SF
− Vacancy
−$1.7K −$0.86/SF
EGI
$25.8K $12.94/SF
− OpEx
−$7.7K −$3.88/SF
NOI
$18.1K $9.06/SF
Area
Oneida County, NY
Vacancy
6.24%
Lease Rate
$13.80 /SF/Yr
Expense Ratio
30.00%
Simulate Cap Rate and NOI
Suggested Prices Based on Cap Rates
Cap Rate 5%
$361,020
Cap Rate 7%
$257,871
Cap Rate 9%
$200,567
Alternative Uses
Best Use
Multifamily LT 5
$257.9K
$225.6K – $300.9K
NOI $18,051 @ 7.0% cap · market cap 6.97%
Second Best
Apartment 5plus
$237.0K
$207.4K – $276.5K
NOI $16,591 @ 7.0% cap · market cap 6.41%
Theoretical Best
Office A
$525.2K
$459.6K – $612.7K
NOI $36,764 @ 7.0% cap · market cap 14.19%
Zoning and permitted uses should be independently verified with authorities.
How Realmo checks its estimates
Property Analytics
Unlock full access to Insights
Subscribe to Realmo Intelligence
Open Analytics
Current Use
Lease Details
2
Residential units
Yes
Utilities to site
Location Intelligence
Trade Area within ½ mile
736
Businesses Nearby
Explore this area
Business Placement
Demographics for 13501, NY
40,885
Population
17,071
Households
2.4
Avg Household Size
35
Median Age
22%
College-Educated
78%
High-School Grad
8.8 sq mi
ZIP Area
4,646
Density / Sq Mi
$49,771
Median Household Income
$33,632
Median Earnings
$865
Median Rent
$136,100
Median Home Value
Check the figures for this property
Cap Rate, Value Estimation, Potential NOI and more
View Realmo Analytics
Market
Vacancy Rate% for Multifamily in Northeast region





Frequently Asked Questions
What type of property is this?
Duplex - Two units feature covered porches, while the lower apartment also includes a rear deck.
Where is this duplex located?
The property is located at 29 Higby Rd Utica, NY.
What is the asking price?
The asking price for this property is $259,000.
What are key features of this property?
This property features: Two‑unit duplex built in 1925; Finished former attic family room for the upper apartment; Central air in both units, except the third‑floor family room


