Live-Work Building with Wellness
For Sale
$372,500
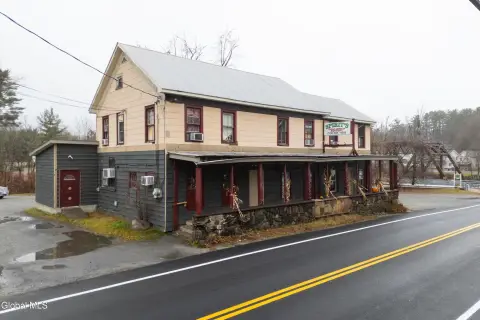
28 Hudson Street, Warrensburg, NY 12885
Flexible live-work property with reception, waiting, and multiple private treatment rooms plus an updated eat-in kitchen.
Property Size3,022 SF
Price / SF$123.26
Days on Market113
Property Features for 28 Hudson Street
General Information
Standard status
Active
Size
3,022 SF
Property subtype
Commercial
Additional Details
Business Included
Yes
Amenities
Accessible Approach with Ramp
Building Details
Year Built
1930
Listing Agency:
Davies Davies & Associates Real Estate LLC
Listed By:
Valerie Erceg · License #10401329957
(518) 361-2785
Source:
Signatureonerealtygroup
Added: Jun 20
Changed: Oct 10
Last Checked: Oct 10 at 1:39AM
Displayed information is deemed reliable but is not guaranteed and should be independently verified. All listing content including descriptions, pricing, images are the copyrighted material of Davies Davies & Associates Real Estate LLC
Investment Insights
Based on property information with market context.
28 Hudson is a versatile live-work property zoned for both residential and commercial use. The existing configuration includes a commercial wellness setup with a reception area, waiting room, and multiple private treatment rooms, while the upper level has been used as a residence by the owner.
The main level wellness space has operated successfully for several years, and the seller indicates the ability to include professional furnishings, dedicated fixtures, and select equipment for buyers who want to continue operating as a wellness center. The residential portion features a beautifully updated eat-in kitchen with newer appliances, quartz countertops, and a center island.
The layout supports multiple operating models, including continuing the current wellness center use, combining residential and commercial occupancy, or leasing both levels as residential units. The property can also be converted back into a single-family home, per the provided description.
The main level wellness space has operated successfully for several years, and the seller indicates the ability to include professional furnishings, dedicated fixtures, and select equipment for buyers who want to continue operating as a wellness center. The residential portion features a beautifully updated eat-in kitchen with newer appliances, quartz countertops, and a center island.
The layout supports multiple operating models, including continuing the current wellness center use, combining residential and commercial occupancy, or leasing both levels as residential units. The property can also be converted back into a single-family home, per the provided description.
Key Highlights
- Built in 1930 with flexible residential and commercial zoning for mixed‑use living and business or rental scenarios
- Main level has a reception area, waiting room, and multiple private treatment rooms suited for professional services
- Updated eat‑in kitchen on the main level with newer appliances, quartz countertops, and a center island
Property Analytics
Unlock full access to Insights
Subscribe to Realmo Intelligence
Open Analytics
Current Use
Lease Details
Turnkey business
Opportunity
Location Intelligence
Trade Area within ½ mile
372
Businesses Nearby
Explore this area
Business Placement
Demographics for 12885, NY
4,371
Population
2,724
Households
1.6
Avg Household Size
46
Median Age
17%
College-Educated
84%
High-School Grad
80.3 sq mi
ZIP Area
54
Density / Sq Mi
$65,454
Median Household Income
$49,245
Median Earnings
$1,042
Median Rent
$149,000
Median Home Value
Check the figures for this property
Cap Rate, Value Estimation, Potential NOI and more
View Realmo Analytics
Market
Vacancy Rate% for Office in Northeast region

Questions? Ask Rey
Realmo’s AI knows this listing — price, zoning, demand, history. Ask anything.



Frequently Asked Questions
What type of property is this?
Live-work space - Flexible live-work property with reception, waiting, and multiple private treatment rooms plus an updated eat-in kitchen.
Where is this live-work space located?
The property is located at 28 Hudson Street Warrensburg, NY.
What is the asking price?
The asking price for this property is $372,500.
What are key features of this property?
This property features: Built in 1930 with flexible residential and commercial zoning for mixed‑use living and business or rental scenarios; Main level has a reception area, waiting room, and multiple private treatment rooms suited for professional services; Updated eat‑in kitchen on the main level with newer appliances, quartz countertops, and a center island


