Mixed-Use Property with Restaurant
For Sale
Contact for pricing
2737 Hyde Street, San Francisco, CA 94109
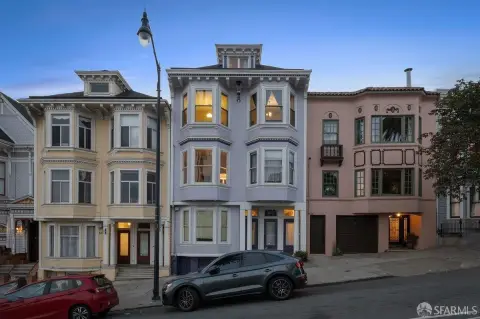
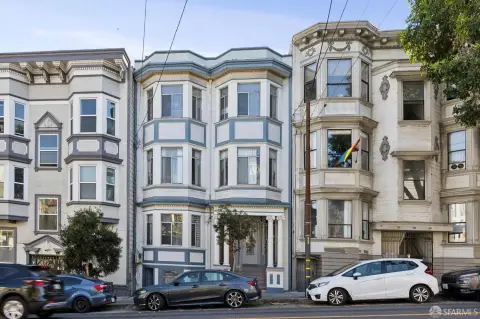
Four-unit mixed-use building offers two 2BR flats plus vacant restaurant and studio space with ADA-compliant access.
Property Size3,726 SF
Price / SF$791.73
Days on Market123
Property Features for 2737 Hyde Street
General Information
Standard status
Active
Size
3,726 SF
Property subtype
Retail, Multifamily, Mixed Use
Zoning
NC-1
Additional Details
Business Included
Yes
Commercial Hood
Yes
Multifamily Units
4
Building Details
Year Built
1927
Buildings
1
Units
4
Listing Agency:
Urban Group Real Estate Inc
Listed By:
Louis Cornejo · License #CA 01518102
(415) 863-1775
Source:
Crexi
Added: Jun 15
Changed: Oct 9
Last Checked: Oct 14 at 8:36PM
Displayed information is deemed reliable but is not guaranteed and should be independently verified. All listing content including descriptions, pricing, images are the copyrighted material of Urban Group Real Estate Inc
Investment Insights
Based on property information with market context.
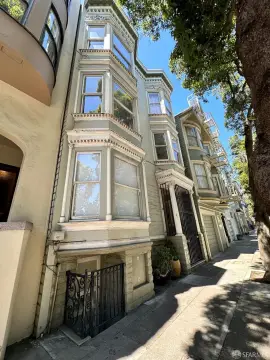
2735–2737 Hyde Street is a four-unit mixed-use property that combines two spacious residential flats with a fully built-out ground-floor restaurant space and an additional studio unit. The property includes two 2-bedroom, 2-bath flats, each with generous living areas, abundant natural light, and preserved period architectural details. Outdoor and functional amenities include a large rear garden and storage areas. The ground-floor restaurant space is equipped with a Type I hood and ADA-compliant access, and it benefits from prominent Hyde Street frontage. The restaurant space and the studio unit will be delivered vacant.
Located in San Francisco’s Russian Hill neighborhood, the property is near Polk Street, North Beach, Fisherman’s Wharf, and the waterfront. The setting supports convenient access to dining, retail, public transportation, and nearby neighborhood attractions.
For an owner-user, the configuration provides direct control of the street-level restaurant footprint while retaining residential units for rental income. For investors, the mix of occupied flats and vacant commercial and studio space offers flexibility for immediate market-rate leasing and future residential turnover. The combination of restaurant readiness, ADA accessibility, and period-informed residential interiors supports a variety of use and leasing strategies within a single asset.
Located in San Francisco’s Russian Hill neighborhood, the property is near Polk Street, North Beach, Fisherman’s Wharf, and the waterfront. The setting supports convenient access to dining, retail, public transportation, and nearby neighborhood attractions.
For an owner-user, the configuration provides direct control of the street-level restaurant footprint while retaining residential units for rental income. For investors, the mix of occupied flats and vacant commercial and studio space offers flexibility for immediate market-rate leasing and future residential turnover. The combination of restaurant readiness, ADA accessibility, and period-informed residential interiors supports a variety of use and leasing strategies within a single asset.
Key Highlights
- Four‑unit mixed‑use building built in 1927 in San Francisco’s Russian Hill neighborhood
- Includes two 2‑bedroom, 2‑bath residential flats with well‑preserved period architectural details
- Ground‑floor restaurant space is fully built out and equipped with a Type I hood
Financial Insights
Estimated NOI and Cap Rate
NOI / Yr
$125,064
Cap Rate
4.24%
Suggested Prices Based on Cap Rates
Cap Rate 5%
$2,501,280
$2.5M
Cap Rate 7%
$1,786,629
$1.8M
Cap Rate 9%
$1,389,600
$1.4M
Market Conditions
NOI Build-Up for 3,726 SF
Gross rent
$190.0K $51.00/SF
− Vacancy
−$11.4K −$3.05/SF
EGI
$178.7K $47.95/SF
− OpEx
−$53.6K −$14.39/SF
NOI
$125.1K $33.57/SF
Area
ZIP 94109
Vacancy
5.98%
Lease Rate
$51.00 /SF/Yr
Expense Ratio
30.00%
Simulate Cap Rate and NOI
Suggested Prices Based on Cap Rates
Cap Rate 5%
$2,501,280
Cap Rate 7%
$1,786,629
Cap Rate 9%
$1,389,600
Alternative Uses
Best Use
Specialty Retail
$11.20M
$9.80M – $13.06M
NOI $783,857 @ 7.0% cap · market cap 26.57%
Second Best
Multifamily LT 5
$1.79M
$1.56M – $2.08M
NOI $125,064 @ 7.0% cap · market cap 4.24%
Theoretical Best
Retail
$16.99M
$14.86M – $19.82M
NOI $1,189,065 @ 7.0% cap · market cap 40.31%
Zoning and permitted uses should be independently verified with authorities.
How Realmo checks its estimates
Property Analytics
Unlock full access to Insights
Subscribe to Realmo Intelligence
Open Analytics
Current Use
Lease Details
4
Residential units
Turnkey business
Opportunity
Yes
Commercial hood
Location Intelligence
Trade Area within ½ mile
4,058
Businesses Nearby
Under-served
Demand for This Use
Explore this area
Business Placement
Demographics for 94109, CA
58,501
Population
39,043
Households
1.5
Avg Household Size
38
Median Age
65%
College-Educated
90%
High-School Grad
1.1 sq mi
ZIP Area
53,183
Density / Sq Mi
$112,201
Median Household Income
$89,841
Median Earnings
$2,172
Median Rent
$1,390,000
Median Home Value
Check the figures for this property
Cap Rate, Value Estimation, Potential NOI and more
View Realmo Analytics
Market
Vacancy Rate% for Multifamily in West region

Questions? Ask Rey
Realmo’s AI knows this listing — price, zoning, demand, history. Ask anything.







Similar Off Market Nearby
- giants buffet — 0013006, san francisco, ca 94133
Frequently Asked Questions
What type of property is this?
Conventional restaurant - Four-unit mixed-use building offers two 2BR flats plus vacant restaurant and studio space with ADA-compliant access.
Where is this conventional restaurant located?
The property is located at 2737 Hyde Street San Francisco, CA.
What is the asking price?
The asking price for this property is $2,950,000.
What are key features of this property?
This property features: Four‑unit mixed‑use building built in 1927 in San Francisco’s Russian Hill neighborhood; Includes two 2‑bedroom, 2‑bath residential flats with well‑preserved period architectural details; Ground‑floor restaurant space is fully built out and equipped with a Type I hood


