Corner Lot Auto Repair and
For Sale
Contact for pricing
2710 Old Buncombe Rd, Greenville, SC 29609
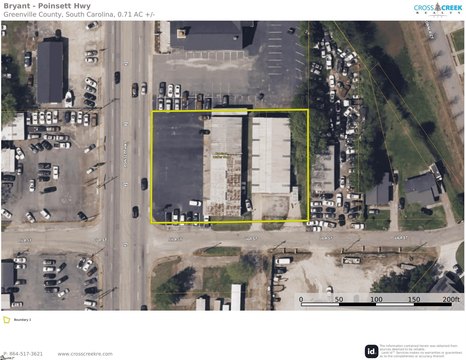
Corner lot with a 4,000 SF metal shop and C-2 zoning for automotive-focused operations.
Property Size4,000 SF
Lot Size1.32 Acres
Days on Market107
Property Features for 2710 Old Buncombe Rd
General Information
Standard status
Active
Size
4,000 SF
Lot size
1.32 Acres
Property subtype
RETAIL
Zoning
C-2
Additional Details
Business Included
Yes
Traffic Count
14,000 vehicles/day
Building Details
Year Built
1945
Listing Agency:
Joyner Commercial
(864) 233-7724
Listed By:
Adel Forsythe · License #133823
(940) 765-9223
Source:
Joynercommercial
Added: Jun 12
Changed: Sep 14
Last Checked: Sep 26 at 3:37AM
Displayed information is deemed reliable but is not guaranteed and should be independently verified. All listing content including descriptions, pricing, images are the copyrighted material of Joyner Commercial
Investment Insights
Based on property information with market context.
This prominent corner lot consists of 3 parcels selling together as 1.32 acres. The site includes a 4,000 SF metal building that has been operating as a car repair and car sales lot for 10+ years, offering an established automotive setup for an owner-operator or business continuation.
Located on Old Buncombe Rd in the Berea area of Greenville, SC, the property benefits from approximately 14,000 VPD. The combined parcels provide a larger footprint for automotive activities while keeping the primary improvements centered around the existing shop.
Zoned C-2, the property supports a range of business ideas, making it suitable for buyers seeking flexibility beyond a single-use facility. For automotive operators, the combination of a dedicated metal shop and the configured lot can support car repair workflows and vehicle sales activities with a straightforward, drive-by-oriented presence along Old Buncombe Rd.
Located on Old Buncombe Rd in the Berea area of Greenville, SC, the property benefits from approximately 14,000 VPD. The combined parcels provide a larger footprint for automotive activities while keeping the primary improvements centered around the existing shop.
Zoned C-2, the property supports a range of business ideas, making it suitable for buyers seeking flexibility beyond a single-use facility. For automotive operators, the combination of a dedicated metal shop and the configured lot can support car repair workflows and vehicle sales activities with a straightforward, drive-by-oriented presence along Old Buncombe Rd.
Key Highlights
- Corner lot made of 3 parcels selling together as 1.32 acres
- 4,000 SF metal building currently operating as a car repair and car sales lot for 10+ years
- C‑2 zoning allows for a variety of business ideas
Property Analytics
Unlock full access to Insights
Subscribe to Realmo Intelligence
Open Analytics
Current Use
Lease Details
14,000 VPD
Traffic count
Turnkey business
Opportunity
Location Intelligence
Trade Area within ½ mile
325
Businesses Nearby
5k
Monthly Visits Nearby
Well-served
Demand for This Use
Explore this area
Business Placement
Foot Traffic Nearby
Shops & Services 100%
Family Dollar
Shops & Services
5,218 visits/mo
0.2 miles
Demographics for 29609, SC
31,547
Population
14,840
Households
2.1
Avg Household Size
38
Median Age
47%
College-Educated
89%
High-School Grad
24.3 sq mi
ZIP Area
1,298
Density / Sq Mi
$64,837
Median Household Income
$42,293
Median Earnings
$1,078
Median Rent
$303,800
Median Home Value
Check the figures for this property
Cap Rate, Value Estimation, Potential NOI and more
View Realmo Analytics
Market
Vacancy Rate% for Retail in Greenville, SC

Questions? Ask Rey
Realmo’s AI knows this listing — price, zoning, demand, history. Ask anything.




Similar Off Market Nearby
- Tire Express LLC — 506 Cedar Lane Rd unit a, Greenville, SC 29611
- Baldwin Body Shop — 400 Cedar Lane Rd, Greenville, SC 29611
- Budget Tire Plus LLC — 307 Poinsett Hwy, Greenville, SC 29609
- Buchanan & Sons Tire and Automotive, Inc. — 401 Poinsett Hwy, Greenville, SC 29609
- Michelin — 208 Poinsett Hwy, Greenville, SC 29609
Frequently Asked Questions
What type of property is this?
Auto shop - Corner lot with a 4,000 SF metal shop and C-2 zoning for automotive-focused operations.
Where is this auto shop located?
The property is located at 2710 Old Buncombe Rd Greenville, SC.
What are key features of this property?
This property features: Corner lot made of 3 parcels selling together as 1.32 acres; 4,000 SF metal building currently operating as a car repair and car sales lot for 10+ years; C‑2 zoning allows for a variety of business ideas



