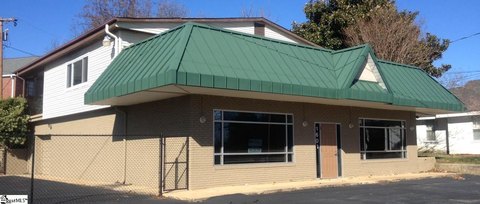
Auto Shop with Roll-Up
For Sale
Contact for pricing
3225 Old Buncombe Rd, Greenville, SC 29609
Two-building service property with lifts, an in-ground pit, and multiple roll-up doors.
Property Size3,000 SF
Lot Size1.19 Acres
Price / SF$216.67
Days on Market66
Property Features for 3225 Old Buncombe Rd
General Information
Standard status
Active
Size
3,000 SF
Lot size
1.19 Acres
Property subtype
RETAIL
Amenities
metal roofs
6 roll-up doors
service inground pit
all fuels heater
multiple lifts included
Building Details
Buildings
2
Construction
Wood and metal construction
Listing Agency:
Joyner Commercial
(864) 233-7724
Listed By:
Matt Carter, SIOR, CCIM, BIC
(864) 313-9078
Source:
Moodyscre
Added: Aug 11
Changed: Oct 14
Last Checked: Oct 15 at 1:43AM
Displayed information is deemed reliable but is not guaranteed and should be independently verified. All listing content including descriptions, pricing, images are the copyrighted material of Joyner Commercial

Ask AI about this property
Review the available facts, identify missing information and prepare questions for the agent.
Investment Insights
Based on property information with market context.
This auto service property comprises two buildings totaling 3,000 square feet on 1.19 acres. The improvements feature wood and metal construction, metal roofing, six roll-up doors, a below-grade service pit, a heater, and multiple vehicle lifts. The configuration is suited to automotive repair and service operations.
The property is positioned near the intersection of Old Buncombe Rd. and W. Blue Ridge Drive in Greenville, South Carolina. It is also located near the Union Bleachery redevelopment project, providing a recognizable point of reference for the surrounding area.
The property is positioned near the intersection of Old Buncombe Rd. and W. Blue Ridge Drive in Greenville, South Carolina. It is also located near the Union Bleachery redevelopment project, providing a recognizable point of reference for the surrounding area.
Key Highlights
- Two‑building auto service property totaling 3,000 square feet on 1.19 acres
- Six roll‑up doors support vehicle access and service operations
- Includes a service in‑ground pit and multiple lifts
Financial Insights
Estimated NOI and Cap Rate
NOI / Yr
$44,456
Cap Rate
6.84%
Suggested Prices Based on Cap Rates
Cap Rate 5%
$889,120
$889.1K
Cap Rate 7%
$635,086
$635.1K
Cap Rate 9%
$493,956
$494.0K
Market Conditions
NOI Build-Up for 3,000 SF
Gross rent
$65.9K $21.96/SF
− Vacancy
−$2.4K −$0.79/SF
EGI
$63.5K $21.17/SF
− OpEx
−$19.1K −$6.35/SF
NOI
$44.5K $14.82/SF
Area
Greenville County, SC
Vacancy
3.60%
Lease Rate
$21.96 /SF/Yr
Expense Ratio
30.00%
Simulate Cap Rate and NOI
Suggested Prices Based on Cap Rates
Cap Rate 5%
$889,120
Cap Rate 7%
$635,086
Cap Rate 9%
$493,956
Alternative Uses
Best Use
Retail
$635.1K
$555.7K – $740.9K
NOI $44,456 @ 7.0% cap · market cap 6.84%
Second Best
Industrial
$165.2K
$144.5K – $192.7K
NOI $11,561 @ 7.0% cap · market cap 1.78%
Theoretical Best
Office A
$1.28M
$1.12M – $1.50M
NOI $89,725 @ 7.0% cap · market cap 13.80%
Zoning and permitted uses should be independently verified with authorities.
How Realmo checks its estimates
Property Analytics
Unlock full access to Insights
Subscribe to Realmo Intelligence
Open Analytics
Current Use
Location Intelligence
Trade Area within ½ mile
202
Businesses Nearby
Well-served
Demand for This Use
Explore this area
Business Placement
Demographics for 29609, SC
31,547
Population
14,840
Households
2.1
Avg Household Size
38
Median Age
47%
College-Educated
89%
High-School Grad
24.3 sq mi
ZIP Area
1,298
Density / Sq Mi
$64,837
Median Household Income
$42,293
Median Earnings
$1,078
Median Rent
$303,800
Median Home Value
Check the figures for this property
Cap Rate, Value Estimation, Potential NOI and more
View Realmo Analytics
Market
Vacancy Rate% for Retail in Greenville, SC


Similar Off Market Nearby
- Fast Auto Repair — 1102 Cedar Lane Rd, Greenville, SC 29617
- Delta Power Systems Inc — 1004 Cedar Lane Rd, Greenville, SC 29617
- Wilson's truck and auto repair llc — 500 Highlawn Ave, Greenville, SC 29617
- Cedar Lane Tires — 918 Cedar Lane Rd, Greenville, SC 29617
- JC Auto Repair — 301 Edgemont Ave, Greenville, SC 29617
Frequently Asked Questions
What type of property is this?
Auto shop - Two-building service property with lifts, an in-ground pit, and multiple roll-up doors.
Where is this auto shop located?
The property is located at 3225 Old Buncombe Rd Greenville, SC.
What is the asking price?
The asking price for this property is $650,000.
What are key features of this property?
This property features: Two‑building auto service property totaling 3,000 square feet on 1.19 acres; Six roll‑up doors support vehicle access and service operations; Includes a service in‑ground pit and multiple lifts


