Updated Office Building with
For Sale
$375,000
2700-08 W 45th Ave, Highland, IN 46322
Two-level commercial layout includes private offices, reception areas, a kitchenette, restrooms, and flexible supporting space.
Property Size3,600 SF
Lot Size0.50 Acres
Price / SF$156.25
Days on Market110
Property Features for 2700-08 W 45th Ave
General Information
Standard status
Active
Size
3,600 SF
Class
B
Lot size
0.50 Acres
Property subtype
Office
Building Details
Building Size
3,600 SF
Year Built
1990
Buildings
2
Stories
2
Listing Agency:
Latitude Commercial
Listed By:
Chandler Kimmel · License #IN #RB22001170
(219) 218-8200
Source:
Latitudeco
Added: Jul 9
Changed: Oct 25
Last Checked: Oct 26 at 1:29PM
Displayed information is deemed reliable but is not guaranteed and should be independently verified. All listing content including descriptions, pricing, images are the copyrighted material of Latitude Commercial

Ask AI about this property
Review the available facts, identify missing information and prepare questions for the agent.
Investment Insights
Based on property information with market context.
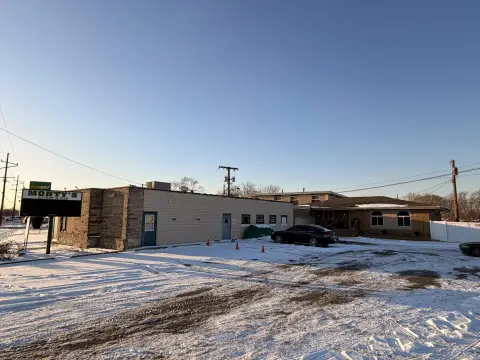
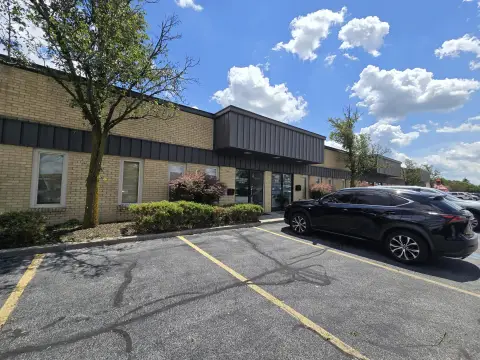
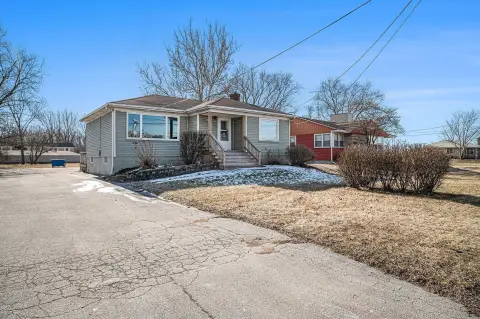
Located at 2700-08 W 45th Ave in Highland, Indiana, this 2,400 SF office building was constructed in 1990 and arranged across two levels. The ground floor provides an open work area, private office, and restroom. Upstairs includes reception space, two private offices, another restroom, and a kitchenette.
A detached 1,200 SF garage expands the property’s utility with additional storage and workspace. The improvements occupy a 0.5-acre lot with visibility along W 45th Ave, supporting prominent signage exposure. The configuration accommodates an owner-user or investor seeking office space with an accompanying garage.
A detached 1,200 SF garage expands the property’s utility with additional storage and workspace. The improvements occupy a 0.5-acre lot with visibility along W 45th Ave, supporting prominent signage exposure. The configuration accommodates an owner-user or investor seeking office space with an accompanying garage.
Key Highlights
- 2,400 SF office building constructed in 1990
- Detached 1,200 SF garage for storage or workspace
- Two‑level configuration with three private offices
Financial Insights
Estimated NOI and Cap Rate
NOI / Yr
$30,443
Cap Rate
8.12%
Suggested Prices Based on Cap Rates
Cap Rate 5%
$608,860
$608.9K
Cap Rate 7%
$434,900
$434.9K
Cap Rate 9%
$338,256
$338.3K
Market Conditions
NOI Build-Up for 2,400 SF
Gross rent
$51.8K $21.60/SF
− Vacancy
−$11.2K −$4.69/SF
EGI
$40.6K $16.91/SF
− OpEx
−$10.1K −$4.23/SF
NOI
$30.4K $12.68/SF
Area
Lake County, IN
Vacancy
21.70%
Lease Rate
$21.60 /SF/Yr
Expense Ratio
25.00%
Simulate Cap Rate and NOI
Suggested Prices Based on Cap Rates
Cap Rate 5%
$608,860
Cap Rate 7%
$434,900
Cap Rate 9%
$338,256
Alternative Uses
Best Use
Office B
$434.9K
$380.5K – $507.4K
NOI $30,443 @ 7.0% cap · market cap 8.12%
Second Best
—
—
no second resolved use
Theoretical Best
Specialty Retail
$670.0K
$586.2K – $781.7K
NOI $46,899 @ 7.0% cap · market cap 12.51%
Zoning and permitted uses should be independently verified with authorities.
How Realmo checks its estimates
Property Analytics
Current Use
Location Intelligence
Trade Area within ½ mile
475
Businesses Nearby
Explore this area
Business Placement
Demographics for 46322, IN
23,984
Population
10,791
Households
2.2
Avg Household Size
43
Median Age
30%
College-Educated
93%
High-School Grad
6.9 sq mi
ZIP Area
3,476
Density / Sq Mi
$76,219
Median Household Income
$47,458
Median Earnings
$1,202
Median Rent
$219,500
Median Home Value
Market
Vacancy Rate% for Office in Midwest region





Frequently Asked Questions
What type of property is this?
Office building - Two-level commercial layout includes private offices, reception areas, a kitchenette, restrooms, and flexible supporting space.
Where is this office building located?
The property is located at 2700-08 W 45th Ave Highland, IN.
What is the asking price?
The asking price for this property is $375,000.
What are key features of this property?
This property features: 2,400 SF office building constructed in 1990; Detached 1,200 SF garage for storage or workspace; Two‑level configuration with three private offices



