Historic Two-Residence
For Sale
$1,199,995
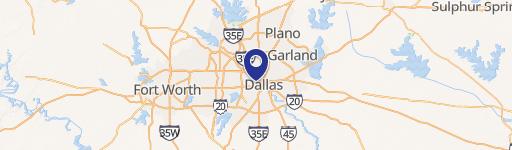
2602 Kings, Dallas, TX 75219
ResidentialIncome, Dallas, TX
Property Size6,300 SF
Lot Size0.34 Acres
Price / SF$190.48
Days on Market74
Property Features for 2602 Kings
General Information
Property type
Residential Multi Family
Property subtype
Duplex
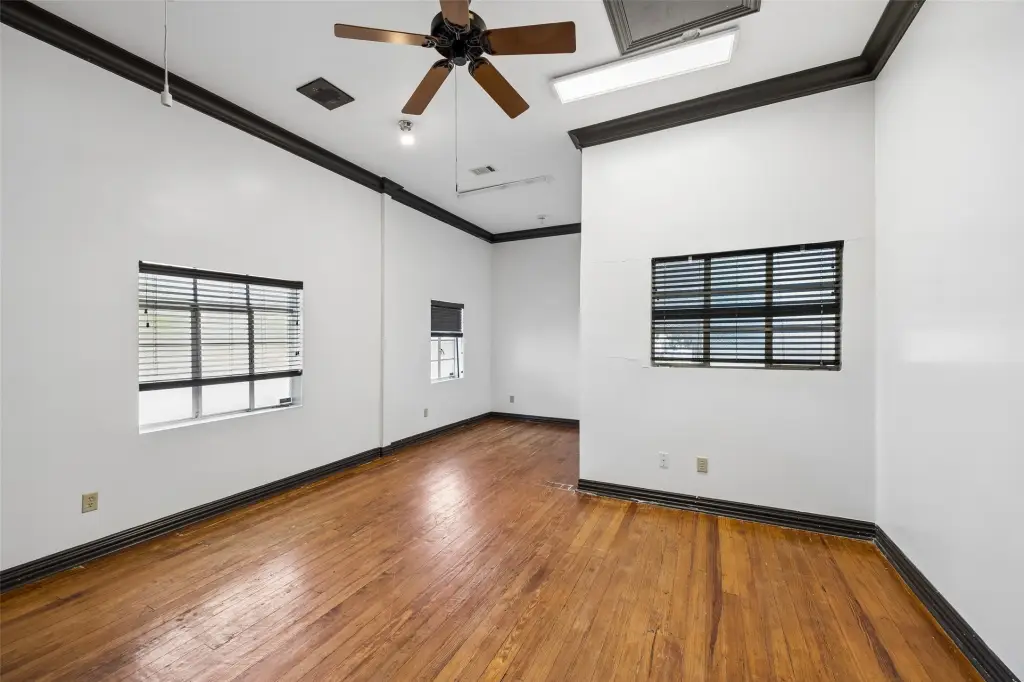
Bedrooms
7
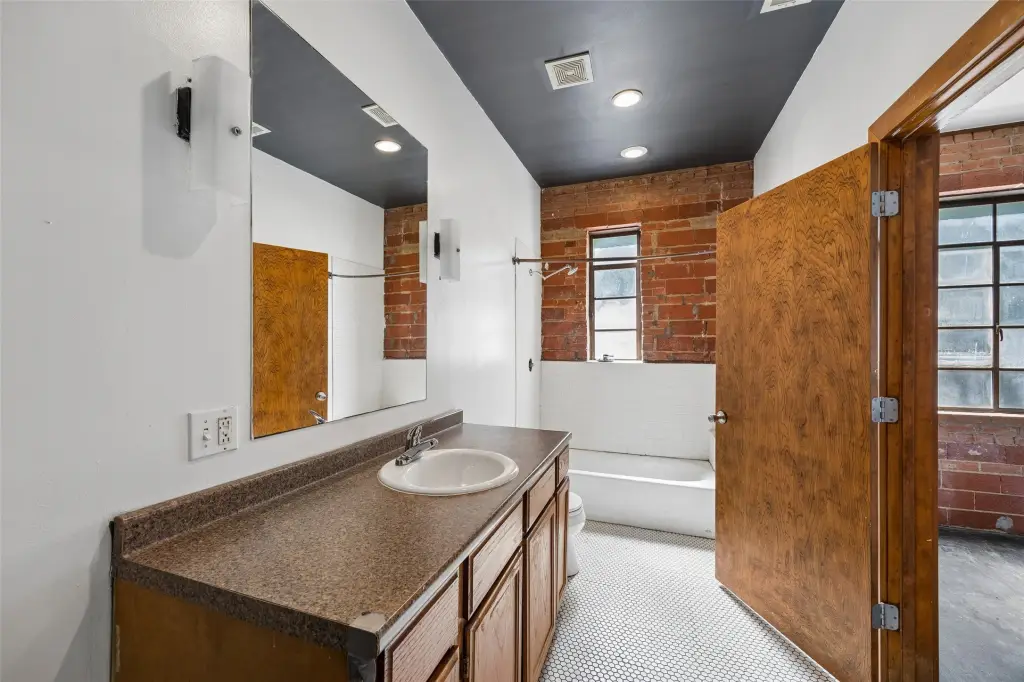
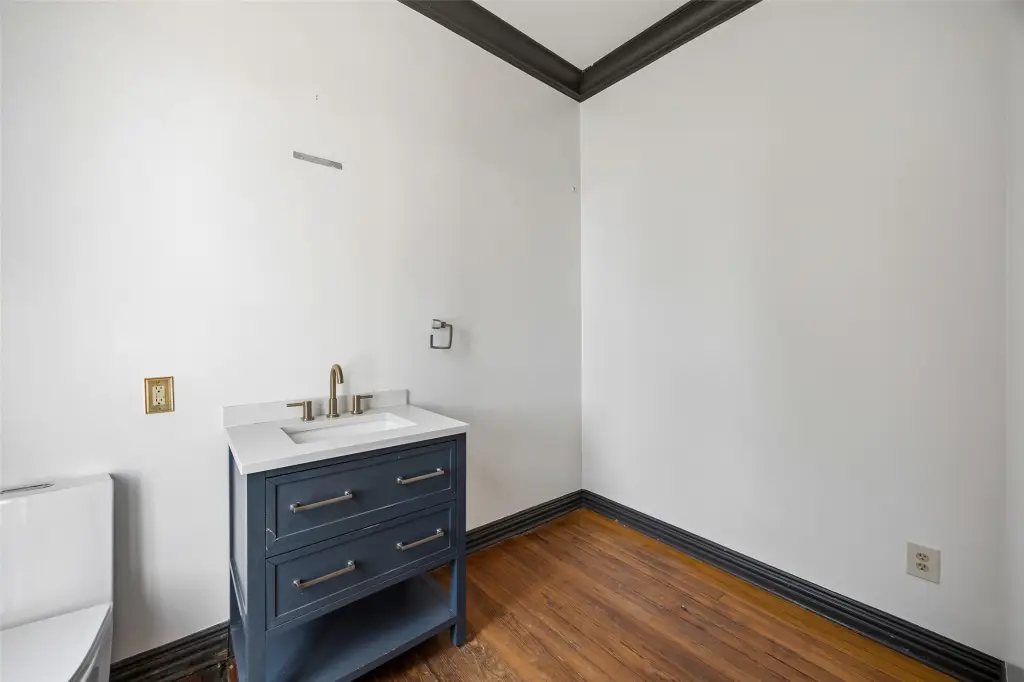
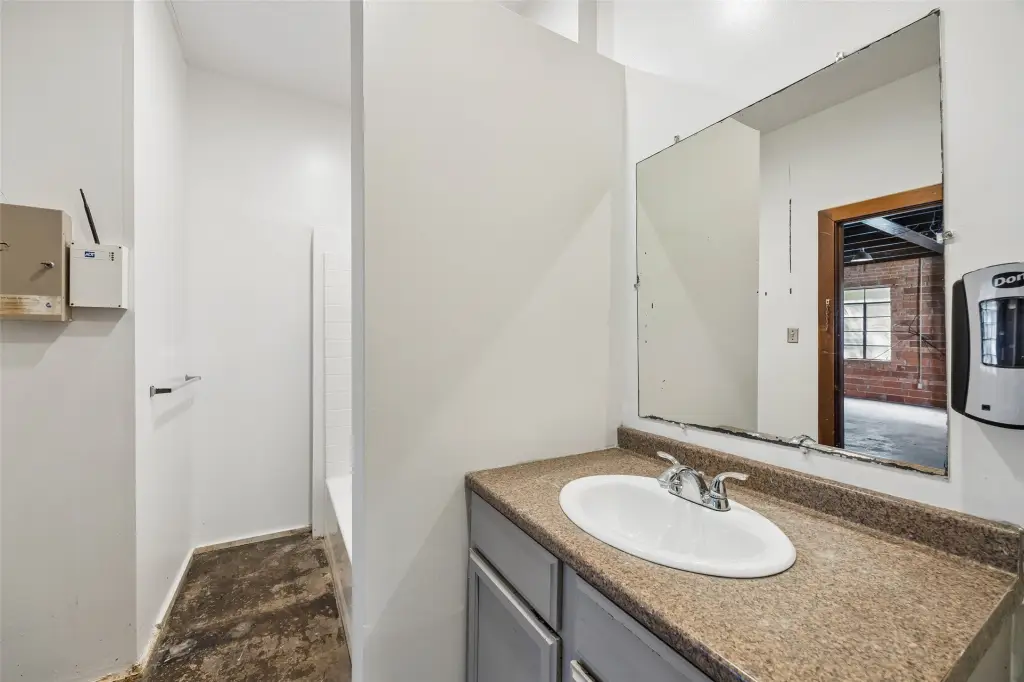
Bathrooms
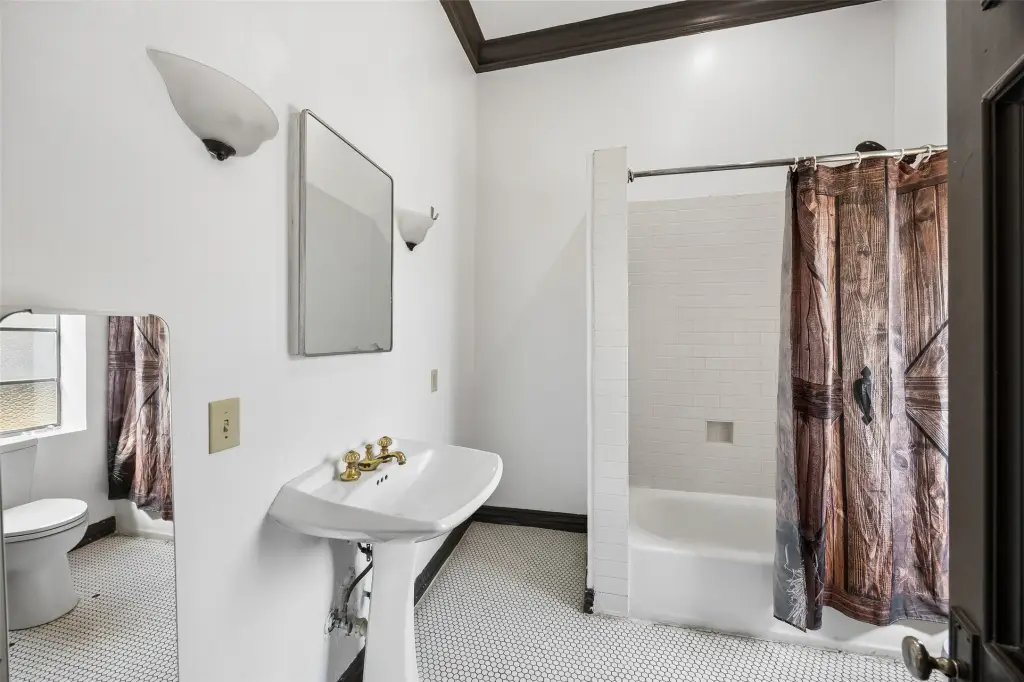
5
Full bathrooms
5
Rooms
Bedroom 5, Bathroom 1, Bedroom 7, Bedroom 1, Bedroom 6, Bathroom 2, Bathroom 4, Bedroom 2, Bedroom 4, Bedroom 3, Bathroom 5, Bathroom 3
Parking
8
Parking features
Parking Lot, Gated, Driveway
Patio and Porch features
Porch
Interior features
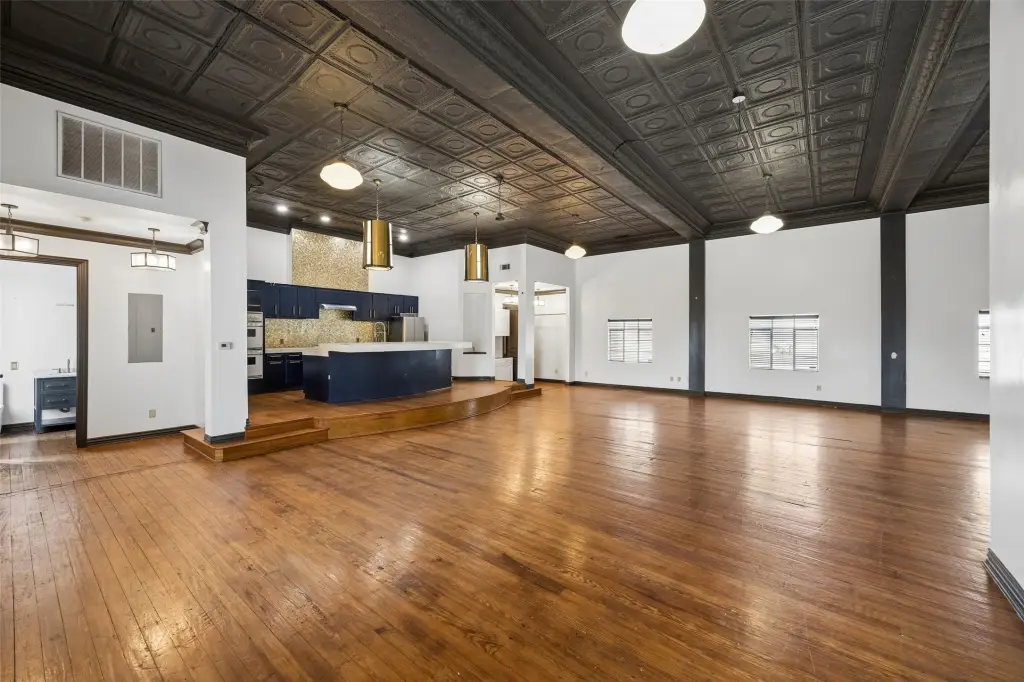
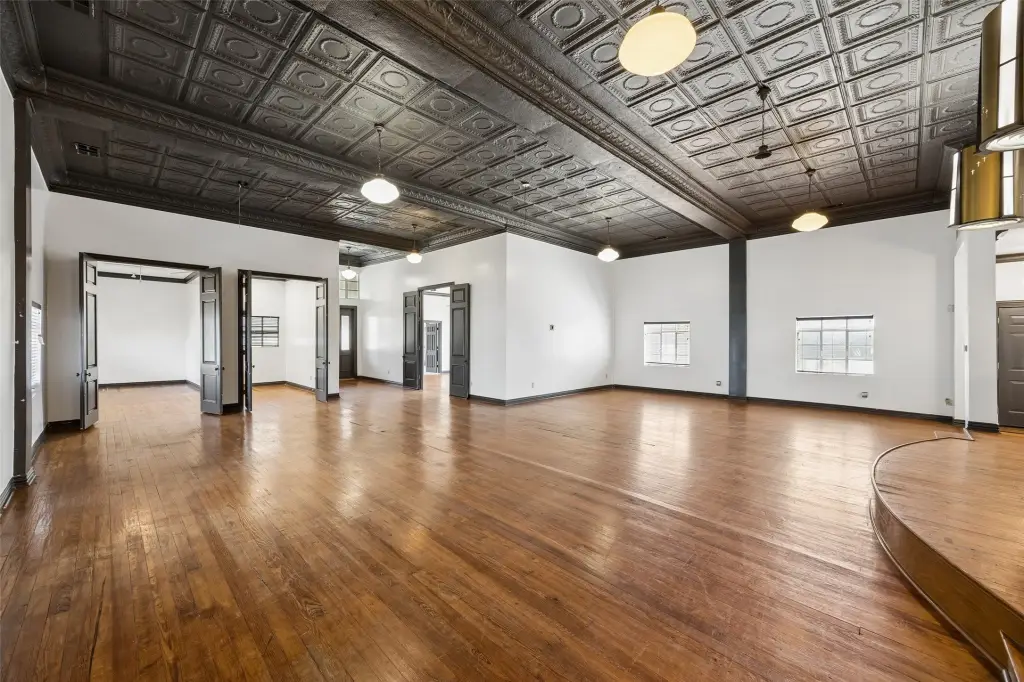
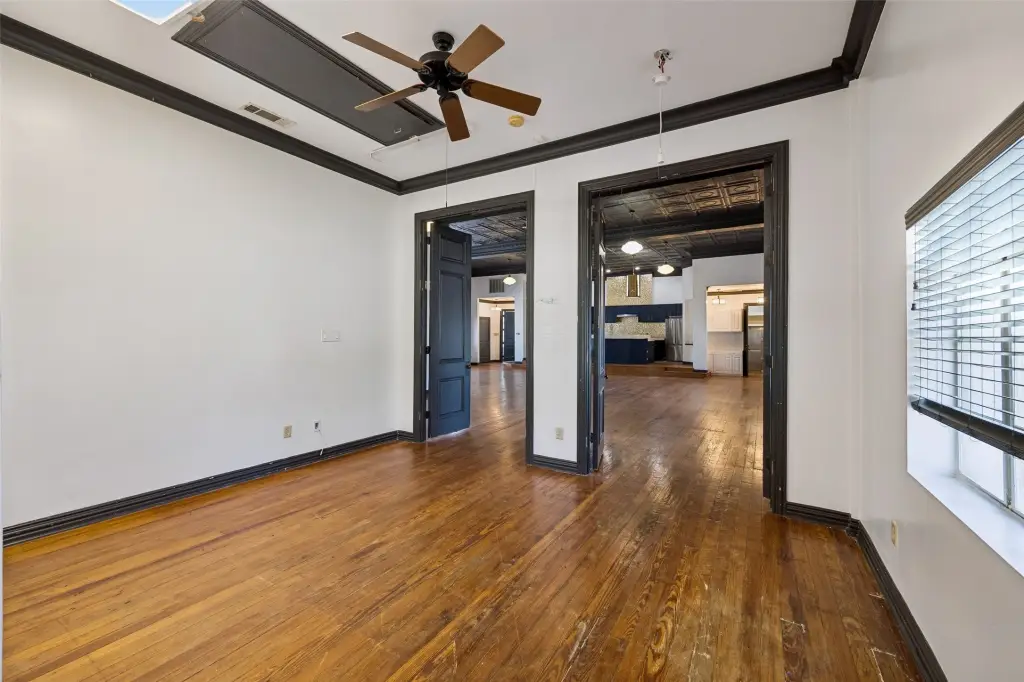
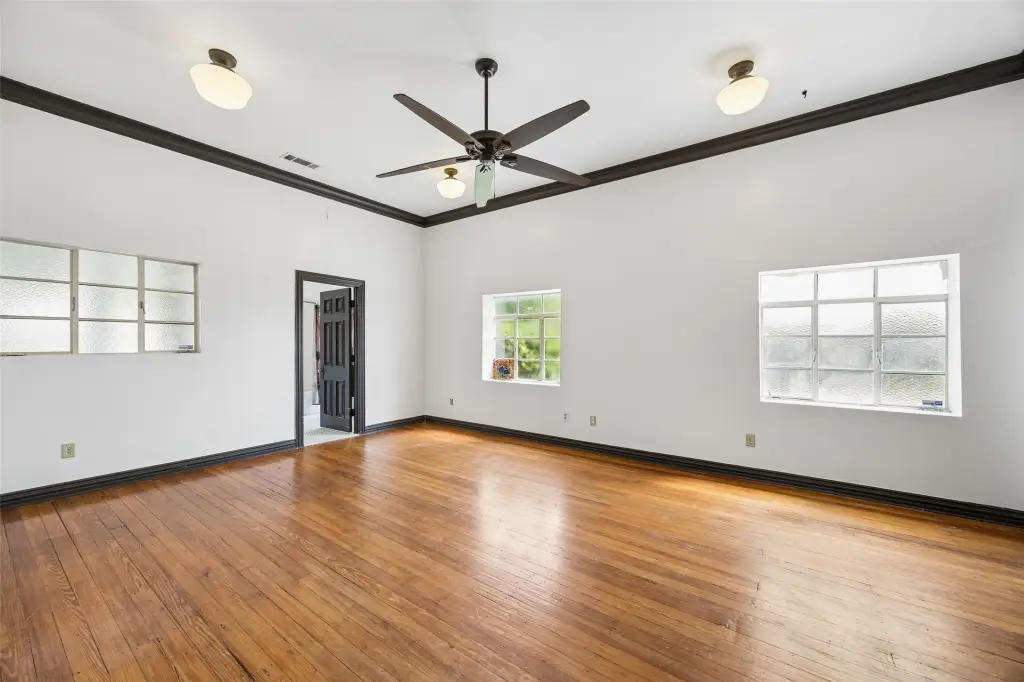
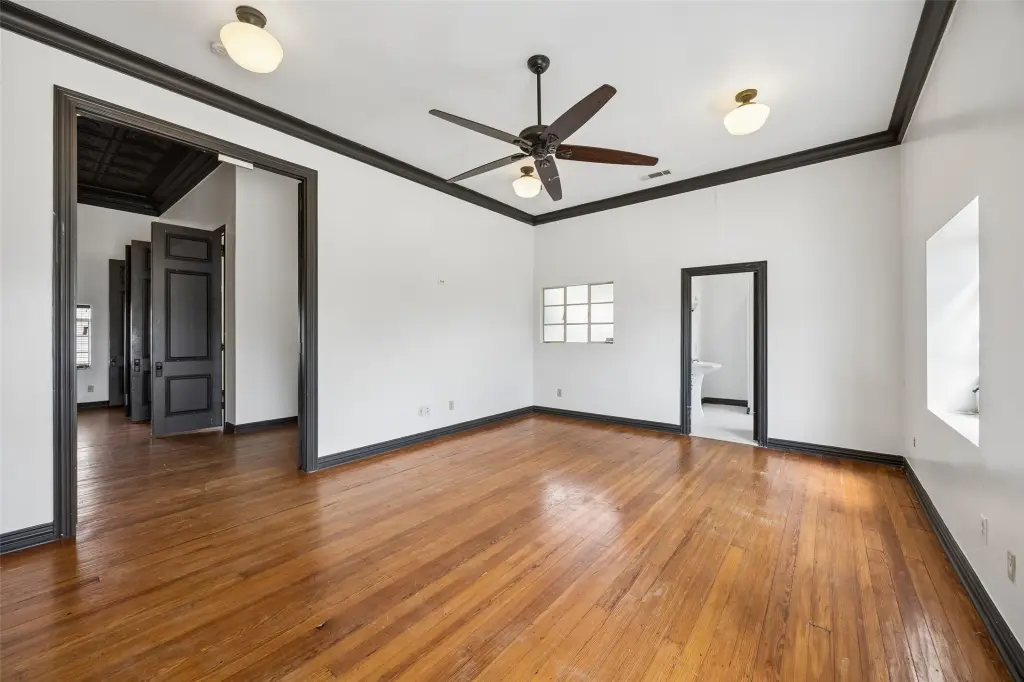
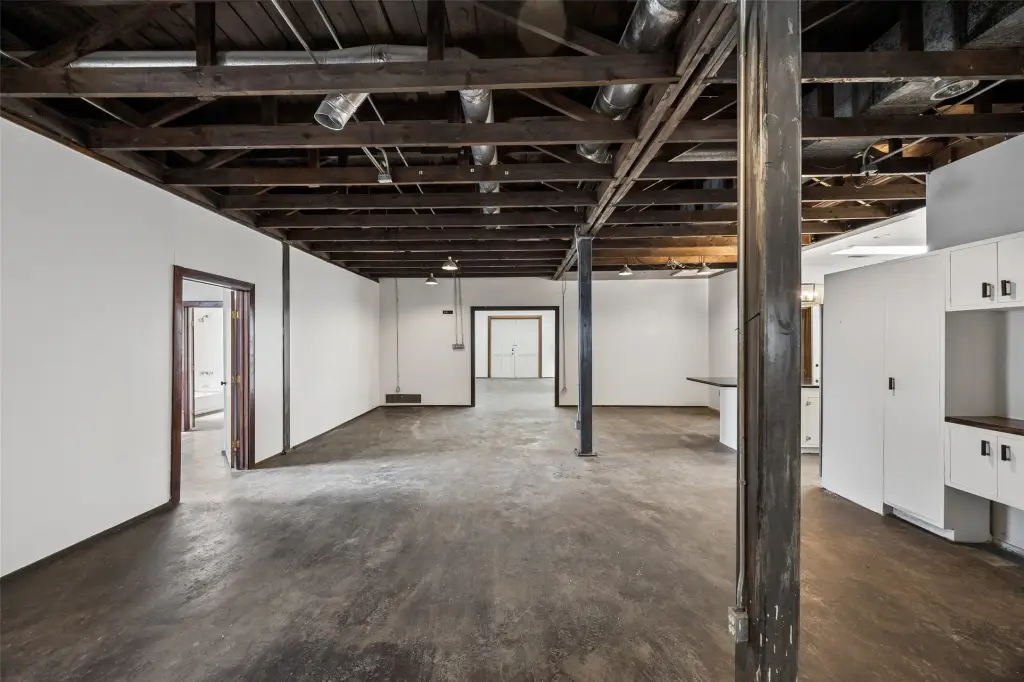
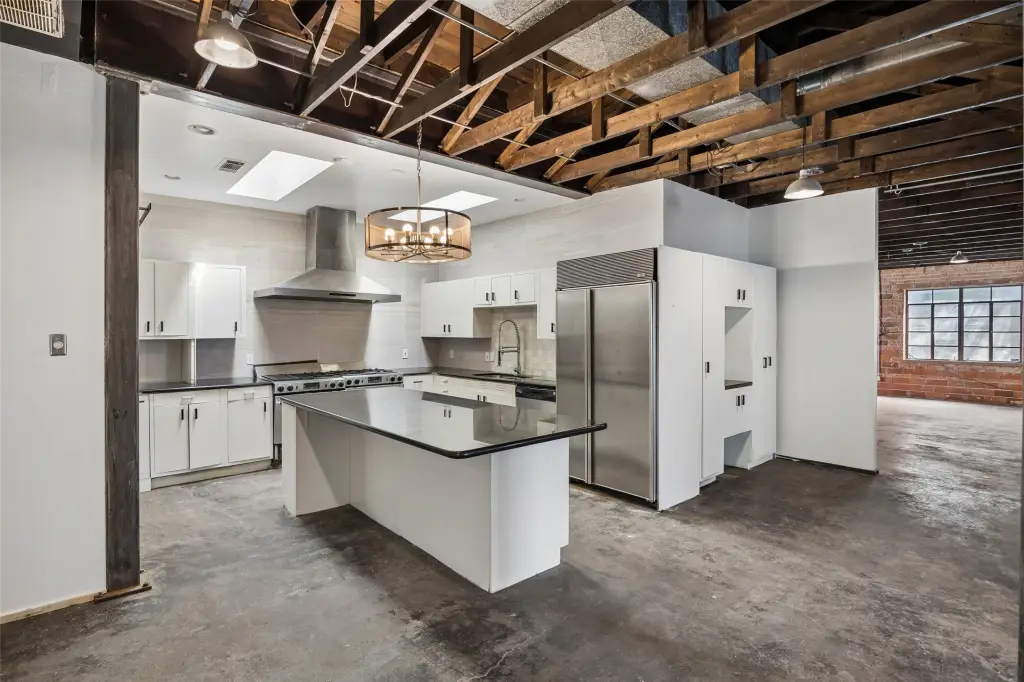
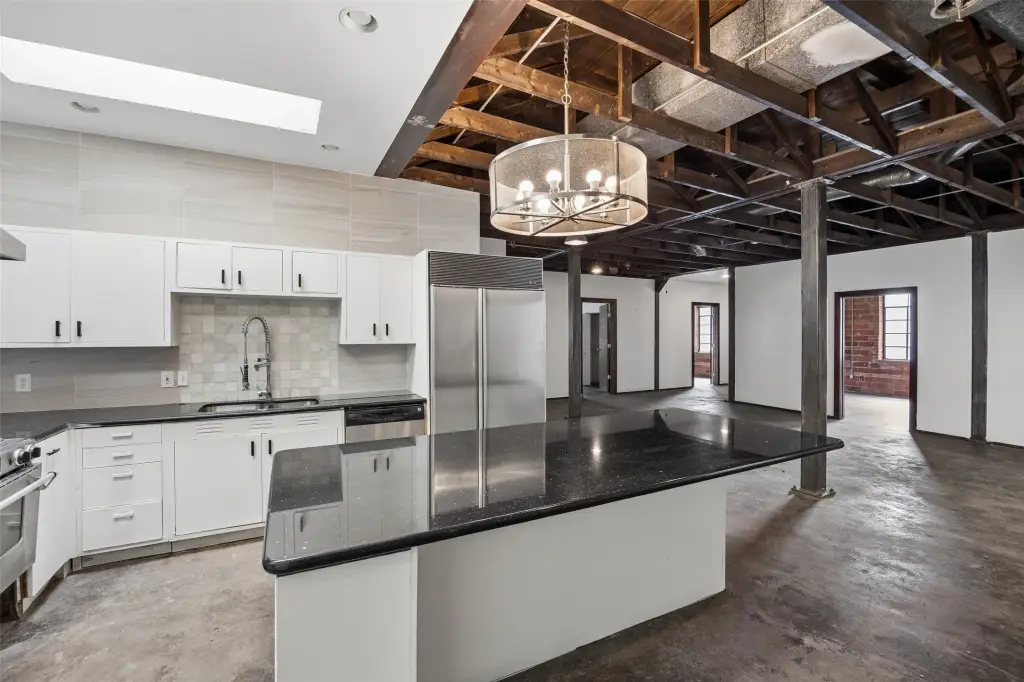
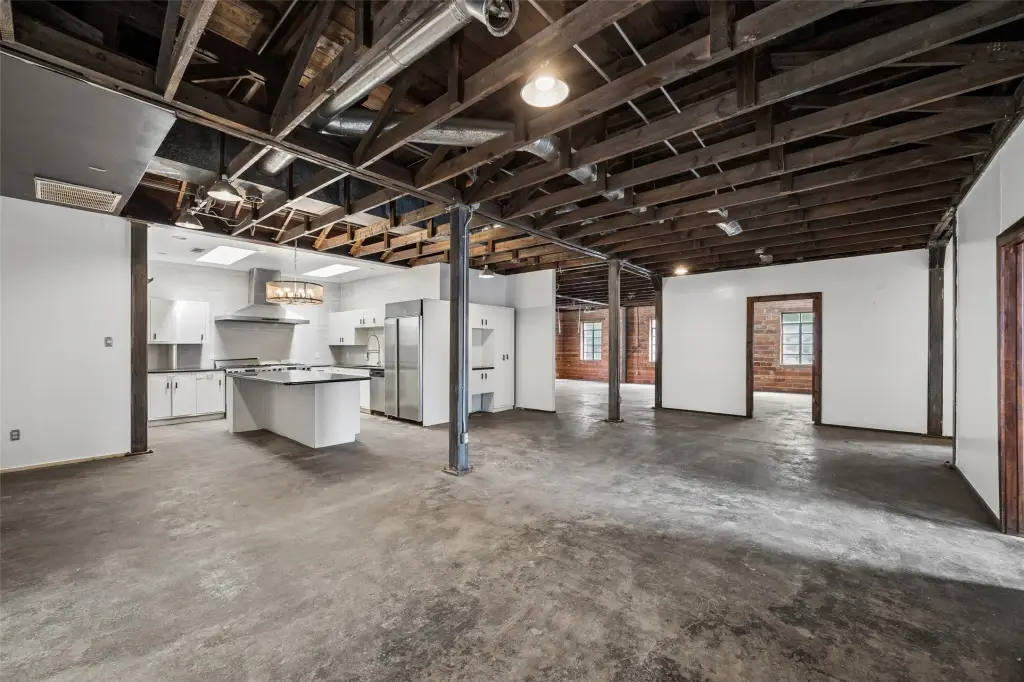
Chandelier, CathedralCeilings, DecorativeDesignerLightingFixtures, KitchenIsland, OpenFloorplan, NaturalWoodwork
Exterior features
PrivateEntrance, PrivateYard
Appliances
DoubleOven, Dishwasher, Disposal, GasRange, Refrigerator, VentedExhaustFan
Subdivision
A K LUCAS Homestead
Lot features
Interior Lot, Landscaped, Few Trees
Elementary school
Bonham
Middle school
Rusk
High school
North Dallas
Elementary school district
Dallas ISD
Middle school district
Dallas ISD
High school district
Dallas ISD
Directions
On kings Between Maple and Cedar Springs
Standard status
Active
APN
00000211099000000
Lot size
0.34 Acres
Utilities
Sewer type
Public Sewer
Heating system
Central, Natural Gas
Cooling system
Electric, Central Air
Water source
Public
Amenities
automatic gated entrance
secure on-site parking
enclosed pet-friendly backyard
intercom-controlled guest entry
Building Details
Year built
1927
Floors in Building
1
Number of units
2
Flooring type
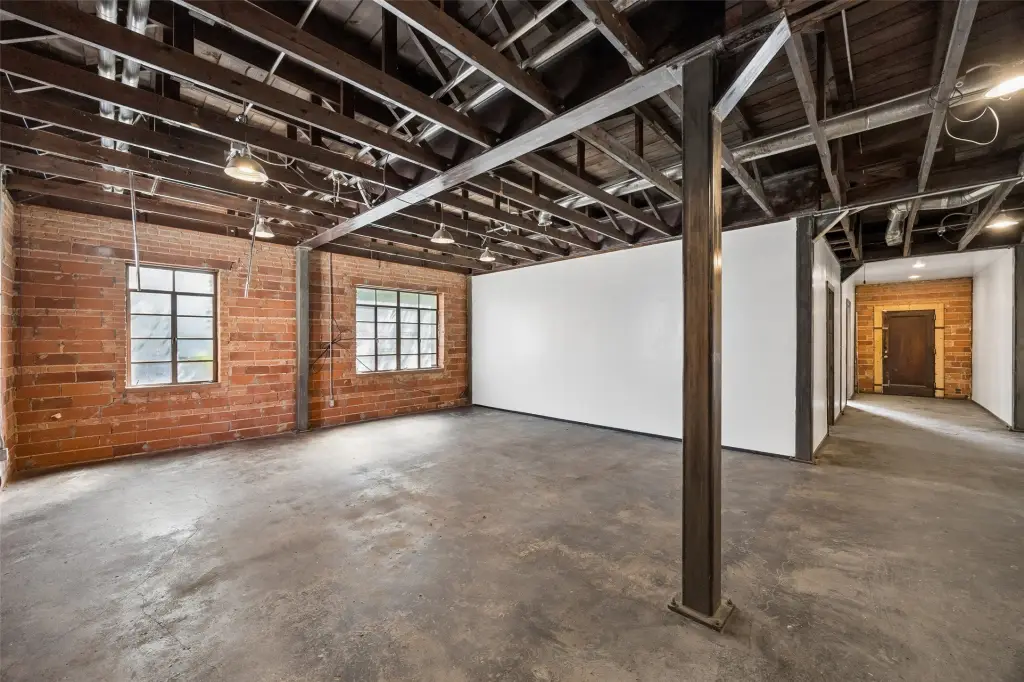
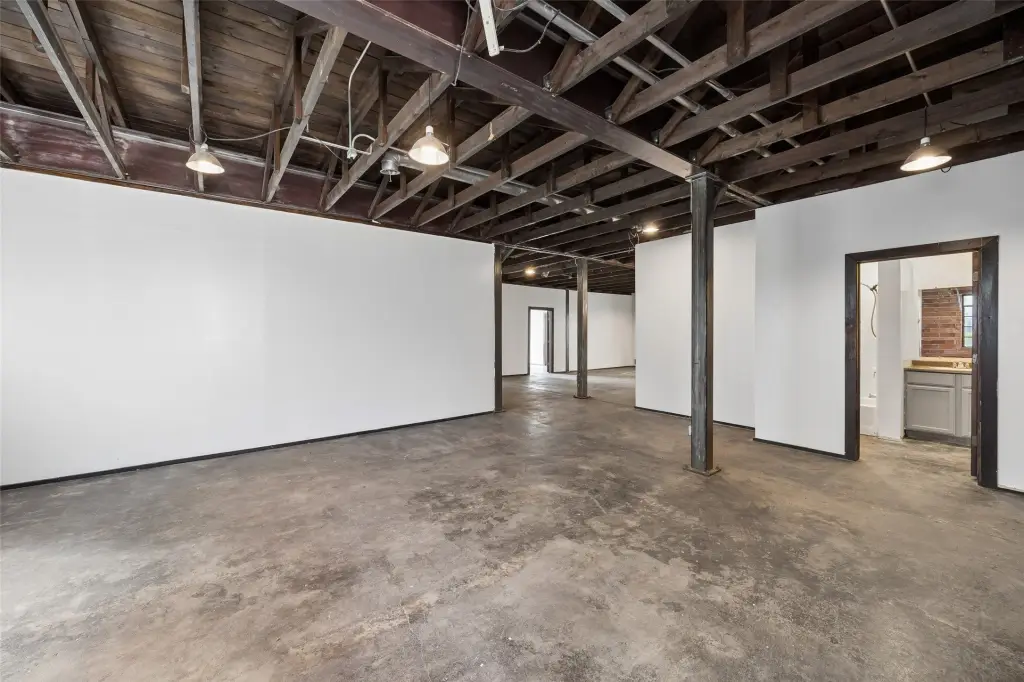
Wood, Concrete
Building materials
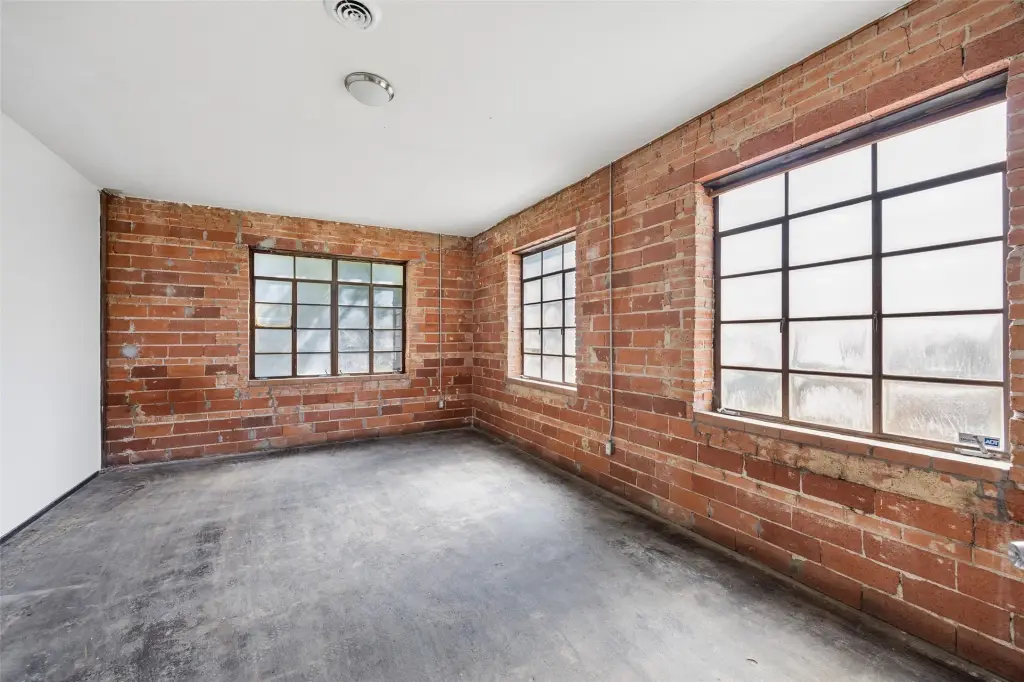
Brick
Roof type
Composition
Listing Agency:
Allie Beth Allman & Assoc. · Berkshire Hathaway HomeServices
(214) 521-7355
Listed By:
Clifton Kessler
(214) 528-2500
Added: Aug 7
Changed: Oct 19
Last Checked: Oct 19 at 11:06PM
MLS# 21352860
Copyright © 2026 North Texas Real Estate Information Systems, Inc. All rights reserved. All information provided by the listing agent/broker is deemed reliable but is not guaranteed and should be independently verified.

Ask AI about this property
Review the available facts, identify missing information and prepare questions for the agent.
Investment Insights
Based on property information with market context.
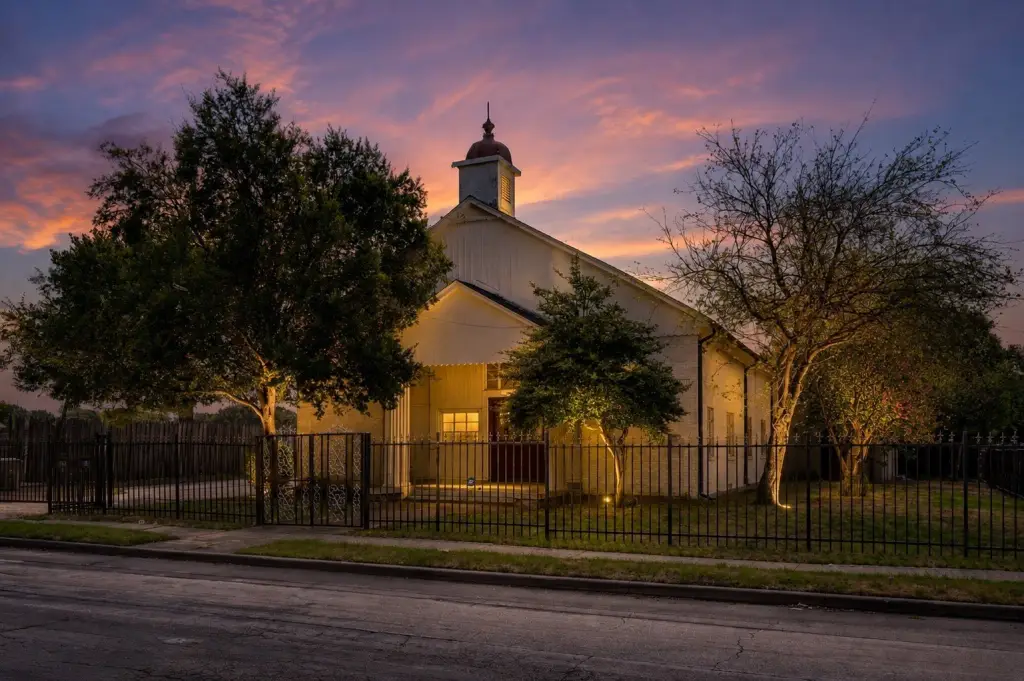
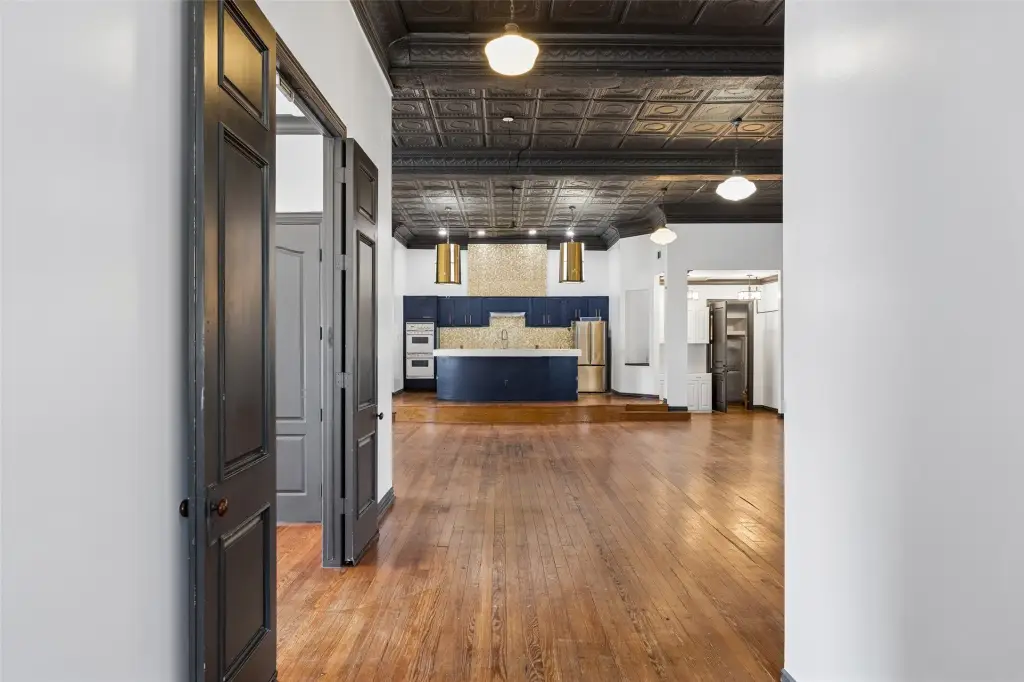
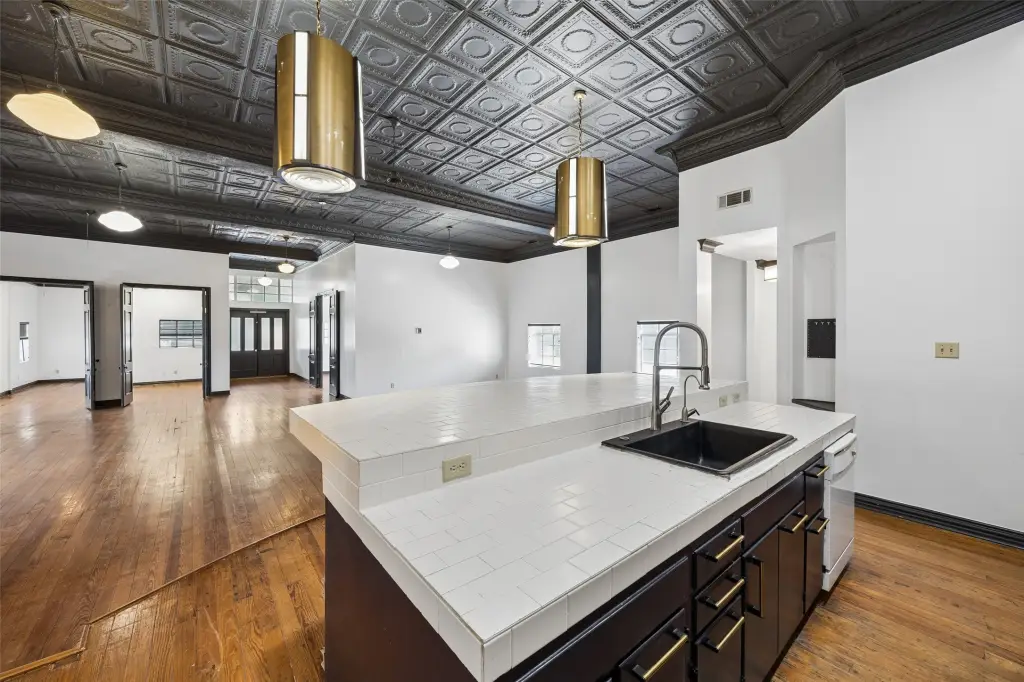
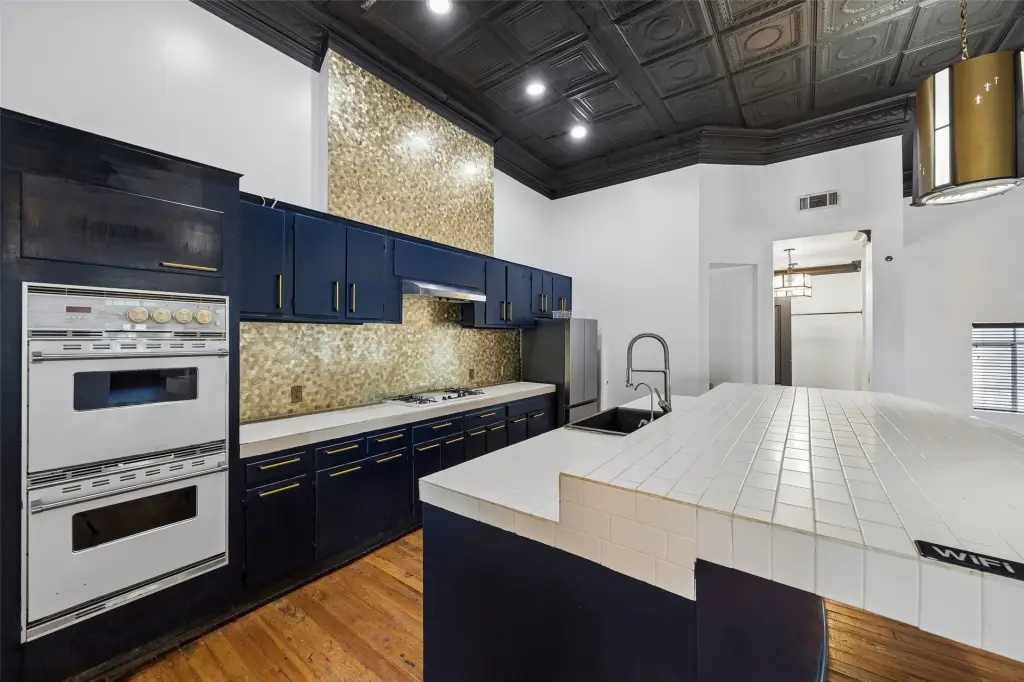
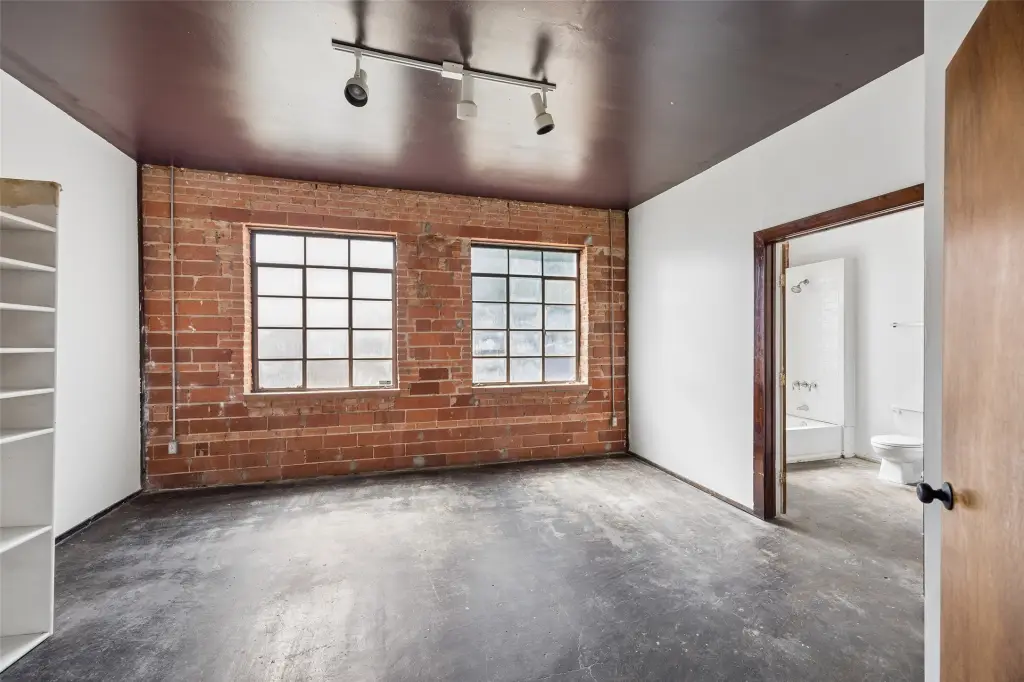
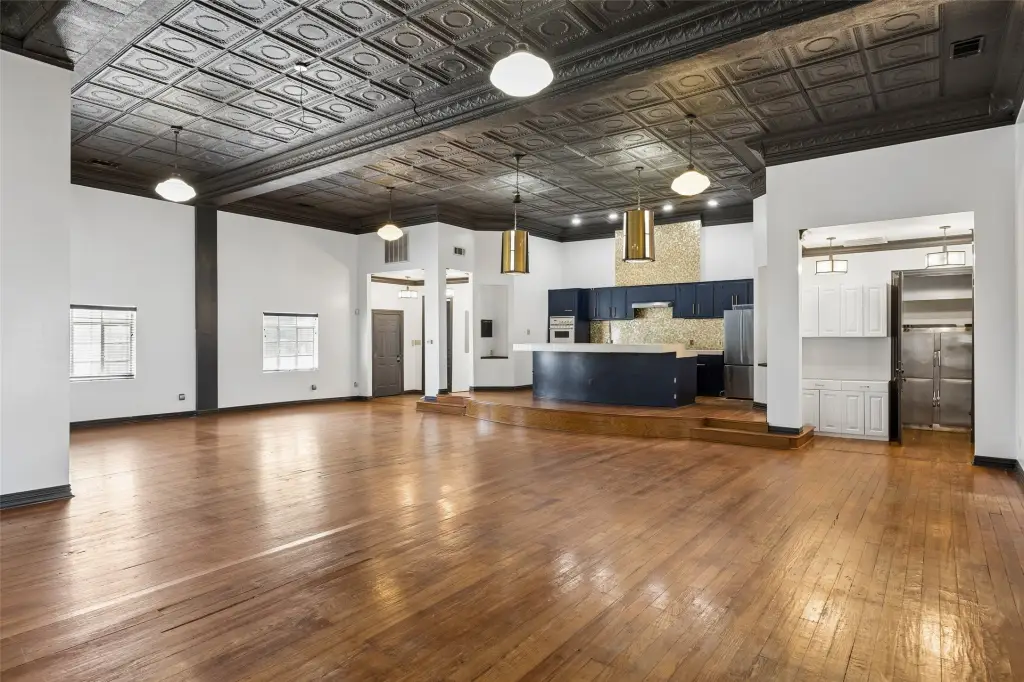
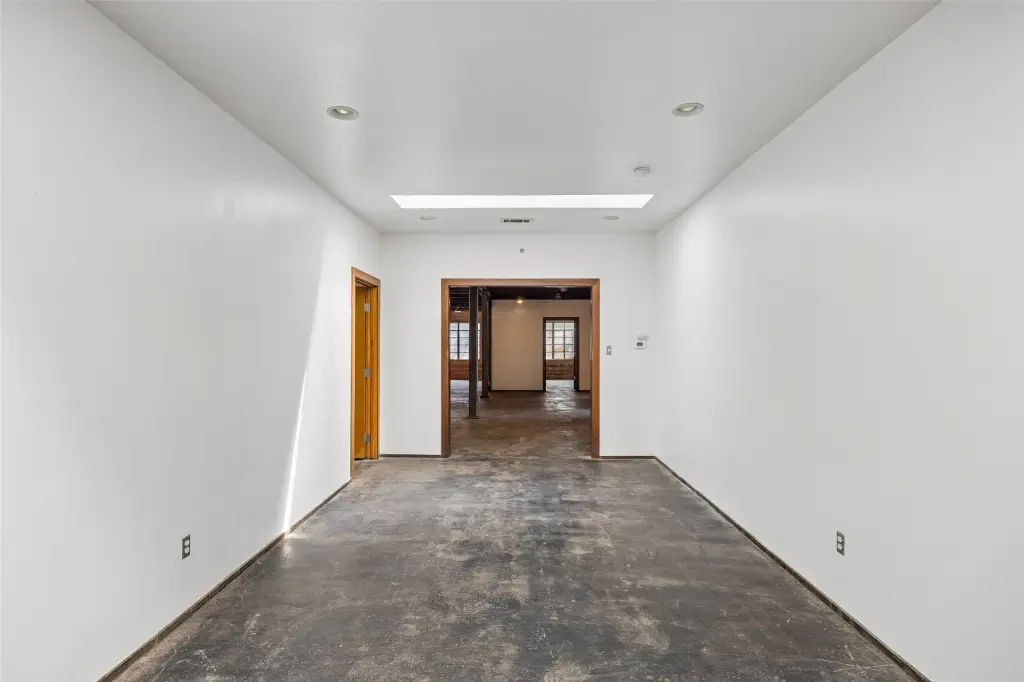
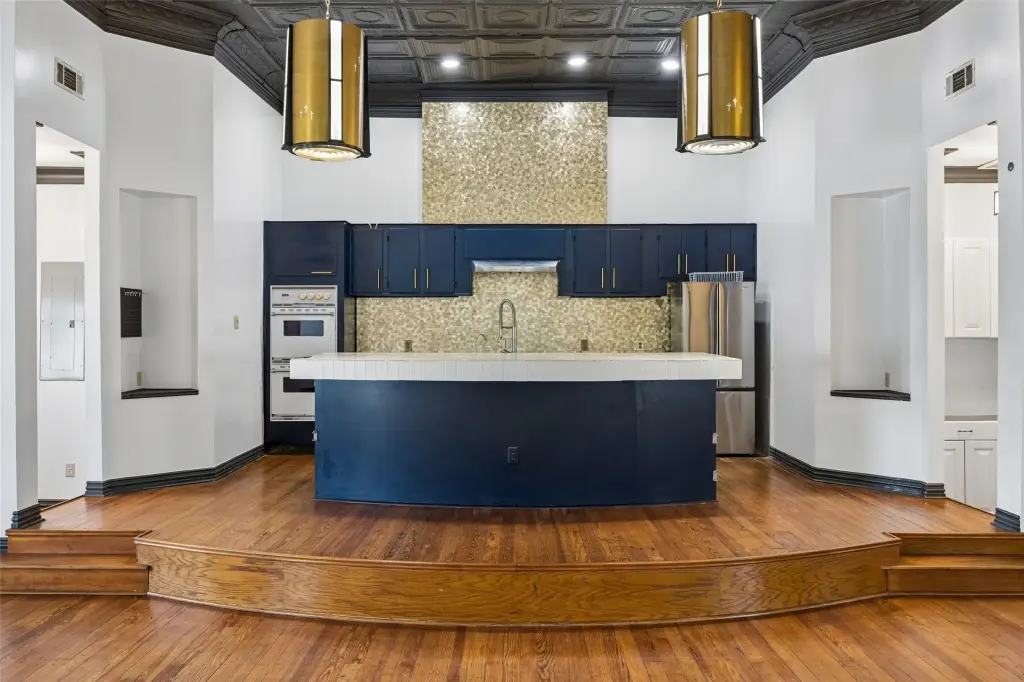
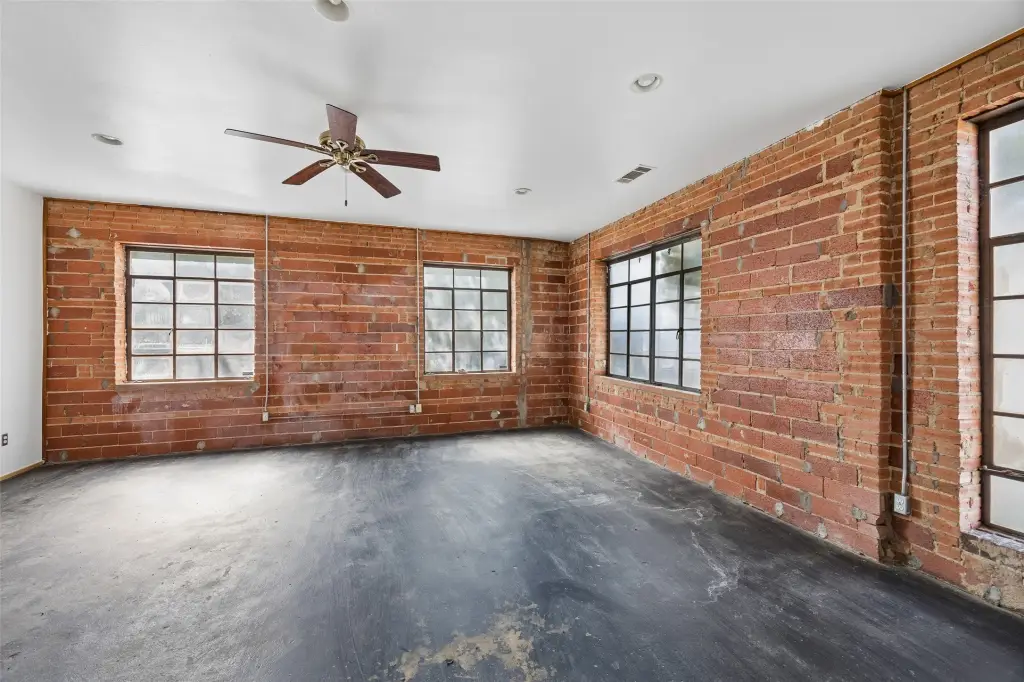
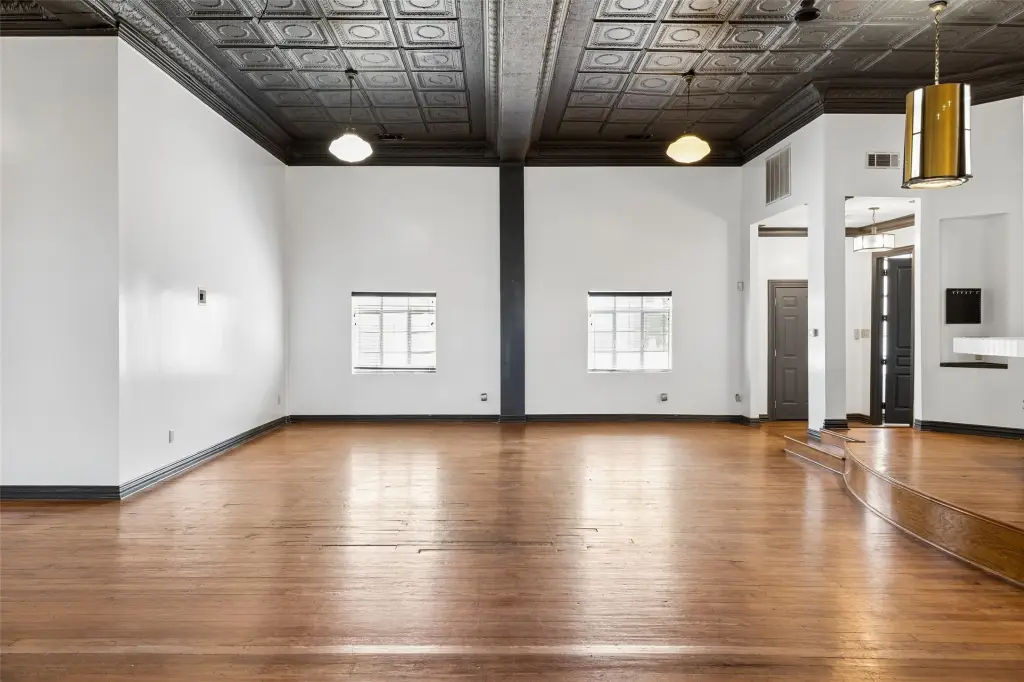
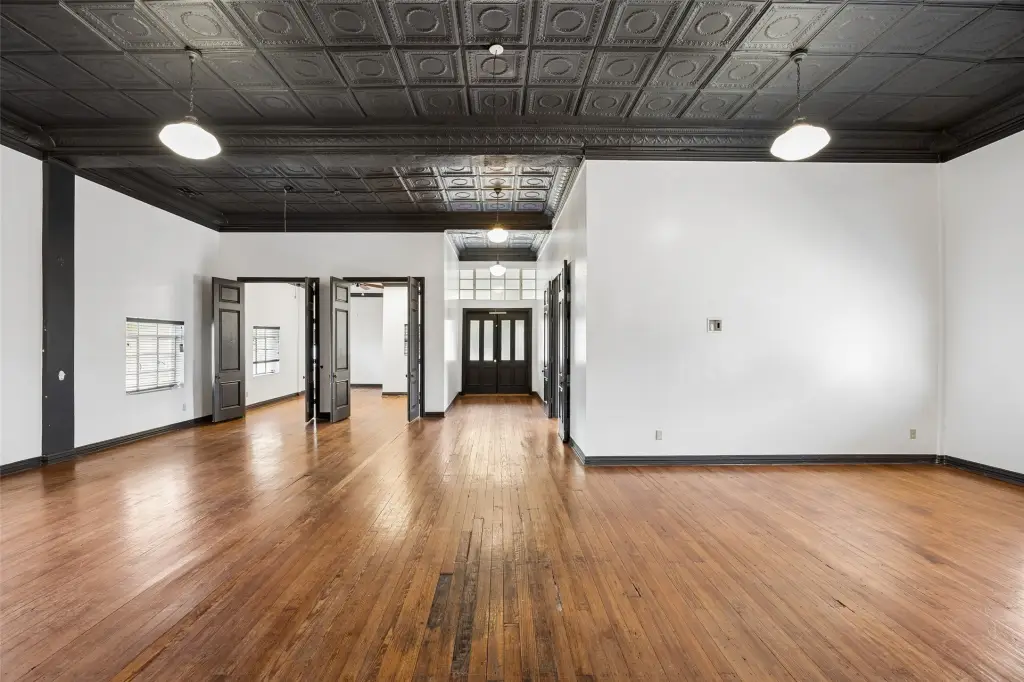
Originally built in 1927, this historic property was converted in 2003 into two distinct residences known as The Chapel and The Sunday School Building. The approximately 6,300-square-foot layout combines preserved architectural character with contemporary finishes, wood and concrete flooring, cathedral ceilings, natural woodwork, kitchen islands, and private entrances. Major structural, mechanical, and energy-efficient systems have been updated, with central heating and air conditioning, public water, and public sewer serving the property.
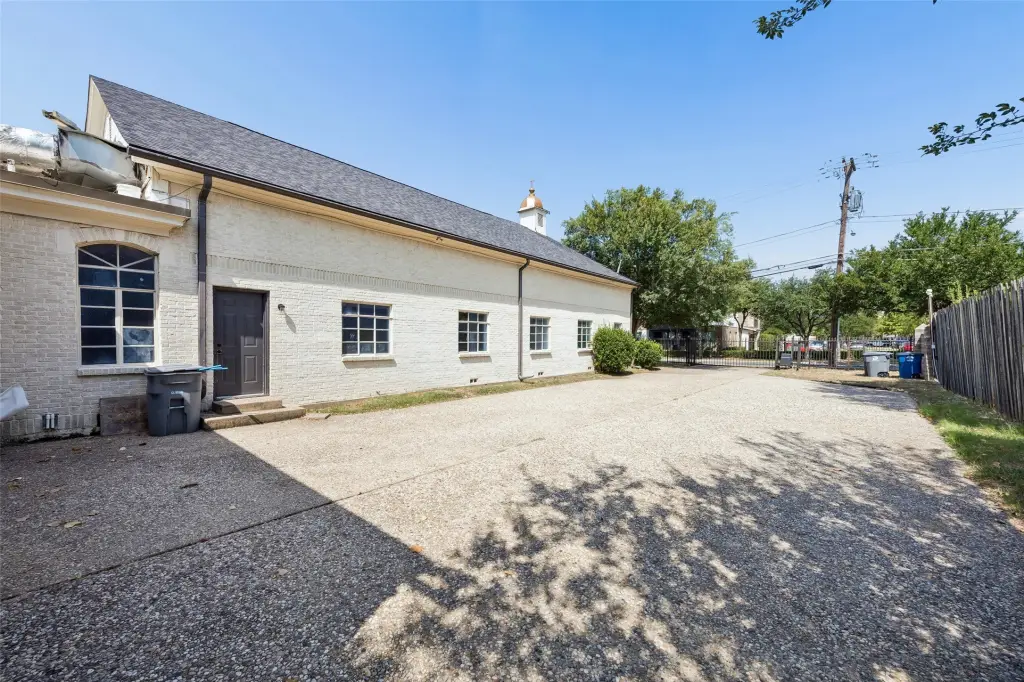
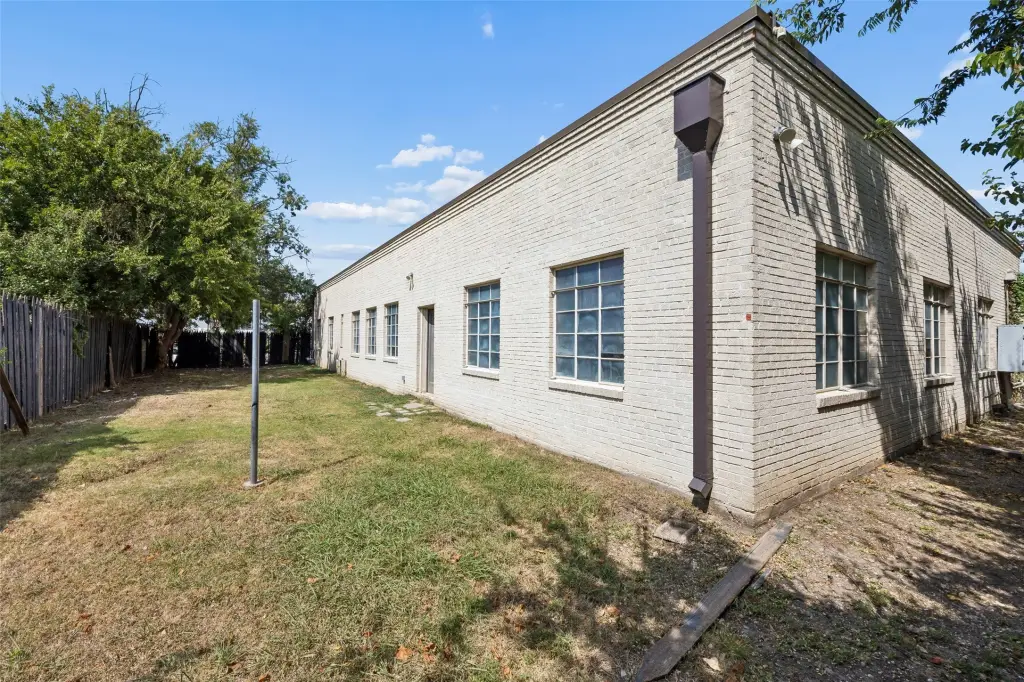
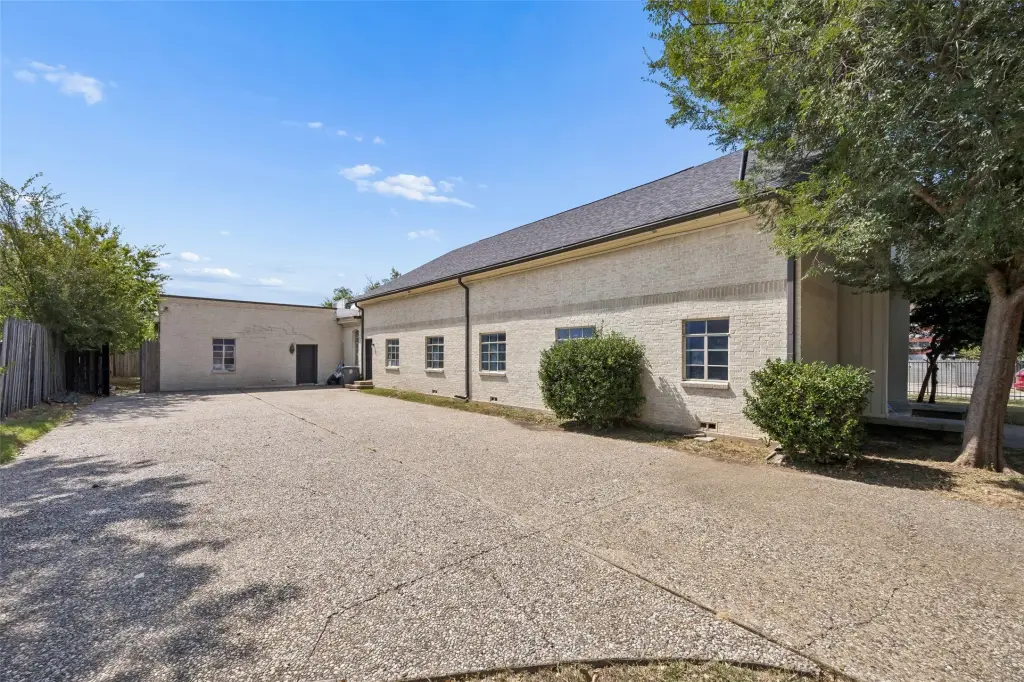
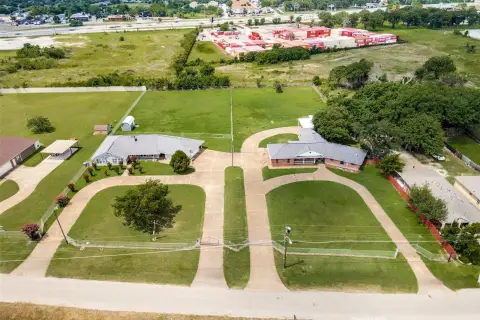
Located at 2602 Kings in Dallas’ Medical District, the property occupies a corner lot with mature landscaping and an original wrought-iron fence. Site features include an automatic gated entrance, secure on-site parking, an enclosed private yard, a porch, and intercom-controlled guest entry. The two-residence configuration supports residential use, live-and-work living, multigenerational occupancy, or an income-producing arrangement, as stated in the property information.
Located at 2602 Kings in Dallas’ Medical District, the property occupies a corner lot with mature landscaping and an original wrought-iron fence. Site features include an automatic gated entrance, secure on-site parking, an enclosed private yard, a porch, and intercom-controlled guest entry. The two-residence configuration supports residential use, live-and-work living, multigenerational occupancy, or an income-producing arrangement, as stated in the property information.
Key Highlights
- Two separate residences within approximately 6,300 SF
- Historic property originally built in 1927 and converted in 2003
- Updated structural, mechanical, and energy‑efficient systems
Financial Insights
Estimated NOI and Cap Rate
NOI / Yr
$95,798
Cap Rate
7.98%
Suggested Prices Based on Cap Rates
Cap Rate 5%
$1,915,960
$1.9M
Cap Rate 7%
$1,368,543
$1.4M
Cap Rate 9%
$1,064,422
$1.1M
Market Conditions
NOI Build-Up for 6,300 SF
Gross rent
$195.0K $30.96/SF
− Vacancy
−$20.9K −$3.31/SF
EGI
$174.2K $27.65/SF
− OpEx
−$78.4K −$12.44/SF
NOI
$95.8K $15.21/SF
Area
Dallas, TX
Vacancy
10.70%
Lease Rate
$30.96 /SF/Yr
Expense Ratio
45.00%
Simulate Cap Rate and NOI
Suggested Prices Based on Cap Rates
Cap Rate 5%
$1,915,960
Cap Rate 7%
$1,368,543
Cap Rate 9%
$1,064,422
Alternative Uses
Best Use
Office B
$5.17M
$4.53M – $6.04M
NOI $362,195 @ 7.0% cap · market cap 30.18%
Second Best
Multifamily LT 5
$1.58M
$1.38M – $1.85M
NOI $110,776 @ 7.0% cap · market cap 9.23%
Theoretical Best
Office A
$7.56M
$6.61M – $8.82M
NOI $529,164 @ 7.0% cap · market cap 44.10%
Zoning and permitted uses should be independently verified with authorities.
How Realmo checks its estimates
Property Analytics
Unlock full access to Insights
Subscribe to Realmo Intelligence
Open Analytics
Current Use
Lease Details
2
Residential units
Location Intelligence
Trade Area within ½ mile
1,313
Businesses Nearby
Explore this area
Business Placement
Demographics for 75219, TX
27,885
Population
19,190
Households
1.5
Avg Household Size
36
Median Age
71%
College-Educated
94%
High-School Grad
2.3 sq mi
ZIP Area
12,124
Density / Sq Mi
$92,541
Median Household Income
$70,549
Median Earnings
$1,751
Median Rent
$377,900
Median Home Value
Check the figures for this property
Cap Rate, Value Estimation, Potential NOI and more
View Realmo Analytics
Market
Vacancy Rate% for Office in Dallas, TX





Frequently Asked Questions
What type of property is this?
Duplex - Converted historic property with two separate residences, updated systems, gated parking, and private outdoor space.
Where is this duplex located?
The property is located at 2602 Kings Dallas, TX.
What is the asking price?
The asking price for this property is $1,199,995.
What are key features of this property?
This property features: Two separate residences within approximately 6,300 SF; Historic property originally built in 1927 and converted in 2003; Updated structural, mechanical, and energy‑efficient systems