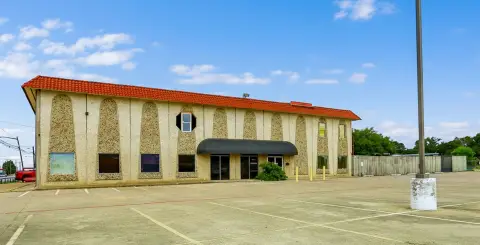
Office Building with Conference
For Sale
$550,000
2550 Legacy Point Drive, Arlington, TX 76006
Four private offices, a conference room, and a built-in kitchen support a professional workplace configuration.
Property Size2,614 SF
Price / SF$210.41
Days on Market47
Property Features for 2550 Legacy Point Drive
General Information
Standard status
Active
Size
2,614 SF
Property subtype
Office
Amenities
full kitchen
crown molding
directional lighting
Building Details
Year Built
2004
Listing Agency:
Texas Investment Real Estate G
(817) 469-1625
Listed By:
Jeff Cassell · License #0424395
(817) 988-7653
Source:
Lonestarluxuryrealty
Added: Sep 6
Changed: Oct 8
Last Checked: Oct 20 at 10:17PM
Displayed information is deemed reliable but is not guaranteed and should be independently verified. All listing content including descriptions, pricing, images are the copyrighted material of Texas Investment Real Estate G

Ask AI about this property
Review the available facts, identify missing information and prepare questions for the agent.
Investment Insights
Based on property information with market context.
Constructed in 2004, this 2,614-square-foot office building includes four offices and a large conference room. The interior also provides a dedicated kitchen with a built-in microwave, range with oven, refrigerator, and extensive cabinet storage. Crown molding and directional lighting add defined interior finish details.
The property is located at 2550 Legacy Point Drive in Arlington, Texas. Its combination of private office rooms, meeting space, and kitchen facilities creates a functional layout for an owner-user or office occupancy.
The property is located at 2550 Legacy Point Drive in Arlington, Texas. Its combination of private office rooms, meeting space, and kitchen facilities creates a functional layout for an owner-user or office occupancy.
Key Highlights
- 2,614‑square‑foot office building completed in 2004
- Four offices plus a large conference room
- Kitchen includes built‑in microwave, range with oven, refrigerator, and cabinets
Financial Insights
Estimated NOI and Cap Rate
NOI / Yr
$40,465
Cap Rate
7.36%
Suggested Prices Based on Cap Rates
Cap Rate 5%
$809,300
$809.3K
Cap Rate 7%
$578,071
$578.1K
Cap Rate 9%
$449,611
$449.6K
Market Conditions
NOI Build-Up for 2,614 SF
Gross rent
$62.7K $24.00/SF
− Vacancy
−$8.8K −$3.36/SF
EGI
$54.0K $20.64/SF
− OpEx
−$13.5K −$5.16/SF
NOI
$40.5K $15.48/SF
Area
Arlington, TX
Vacancy
14.00%
Lease Rate
$24.00 /SF/Yr
Expense Ratio
25.00%
Simulate Cap Rate and NOI
Suggested Prices Based on Cap Rates
Cap Rate 5%
$809,300
Cap Rate 7%
$578,071
Cap Rate 9%
$449,611
Alternative Uses
Best Use
Office B
$578.1K
$505.8K – $674.4K
NOI $40,465 @ 7.0% cap · market cap 7.36%
Second Best
—
—
no second resolved use
Theoretical Best
Office A
$770.8K
$674.4K – $899.2K
NOI $53,953 @ 7.0% cap · market cap 9.81%
Zoning and permitted uses should be independently verified with authorities.
How Realmo checks its estimates
Property Analytics
Who owns this building?
See the owner, sales and loan history
Open Analytics
Current Use
Location Intelligence
Trade Area within ½ mile
413
Businesses Nearby
Explore this area
Business Placement
Demographics for 76006, TX
25,320
Population
13,815
Households
1.8
Avg Household Size
33
Median Age
37%
College-Educated
91%
High-School Grad
7.6 sq mi
ZIP Area
3,332
Density / Sq Mi
$55,216
Median Household Income
$41,743
Median Earnings
$1,344
Median Rent
$286,900
Median Home Value
Check the figures for this property
Cap Rate, Value Estimation, Potential NOI and more
View Realmo Analytics
Market
Vacancy Rate% for Office in South region







Frequently Asked Questions
What type of property is this?
Office building - Four private offices, a conference room, and a built-in kitchen support a professional workplace configuration.
Where is this office building located?
The property is located at 2550 Legacy Point Drive Arlington, TX.
What is the asking price?
The asking price for this property is $550,000.
What are key features of this property?
This property features: 2,614‑square‑foot office building completed in 2004; Four offices plus a large conference room; Kitchen includes built‑in microwave, range with oven, refrigerator, and cabinets