Modern Duplex with
For Sale
$549,000
2518 Fern Palm Dr, Edgewater, FL 32141
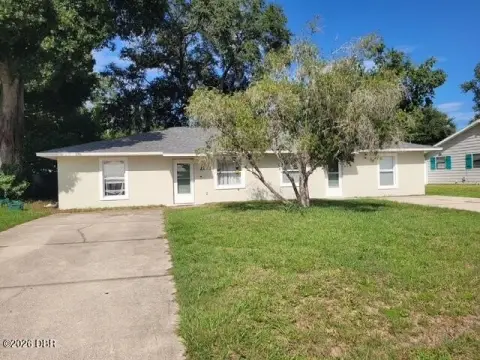
Fully occupied duplex with contemporary finishes, private outdoor areas, and separately metered electric and water service.
Property Size3,006 SF
Lot Size0.28 Acres
Price / SF$182.63
Days on Market81
Property Features for 2518 Fern Palm Dr
General Information
Standard status
Active
Size
3,006 SF
Total Parking Spaces
2
Lot size
0.28 Acres
Property subtype
Multi-Family
Occupancy
100%
Units
Unit Mix
2 x 3BR/2BA
Multifamily Units
2
Parking per Unit
1
Additional Details
Gross Income
$46,200
Utilities to Site
Yes
Building Details
Year Built
2021
Buildings
1
Tenancy
Multi
Listing Agency:
Adams, Cameron & Co., Realtors
Listed By:
Kevin Kling · License #3046851
(386) 999-4006
Source:
386realestate
Added: Jul 27
Changed: Oct 15
Last Checked: Oct 14 at 11:36PM
Displayed information is deemed reliable but is not guaranteed and should be independently verified. All listing content including descriptions, pricing, images are the copyrighted material of Adams, Cameron & Co., Realtors
Investment Insights
Based on property information with market context.
Completed in 2021, this 3,006-square-foot duplex contains two matching residences, each with three bedrooms, two bathrooms, an oversized one-car garage, and a private backyard facing a wooded setting. Interior finishes include vaulted ceilings, luxury vinyl plank flooring in the main living areas, granite counters, white shaker cabinets, stainless steel appliances, kitchen islands, interior laundry rooms, and primary suites with dual vanities and walk-in showers. Covered rear lanais and central air conditioning extend the usable living space.
The property sits on an oversized 120' x 100' lot at 2518 Fern Palm Dr in Edgewater. Both residences are occupied by long-term tenants. Electric and water are separately metered for each unit, with residents responsible for their own utilities. The property provides access to shopping, dining, parks, the Indian River, public boat ramps, and New Smyrna Beach, with broader connections to Cape Canaveral, the Kennedy Space Center, Orlando, and the Space Coast.
The property sits on an oversized 120' x 100' lot at 2518 Fern Palm Dr in Edgewater. Both residences are occupied by long-term tenants. Electric and water are separately metered for each unit, with residents responsible for their own utilities. The property provides access to shopping, dining, parks, the Indian River, public boat ramps, and New Smyrna Beach, with broader connections to Cape Canaveral, the Kennedy Space Center, Orlando, and the Space Coast.
Key Highlights
- Duplex completed in 2021 with 3,006 SF of building area
- Two 3‑bedroom, 2‑bathroom residences, each with an oversized one‑car garage
- Oversized 120' x 100' lot with private wooded‑setting backyards
Financial Insights
Estimated NOI and Cap Rate
NOI / Yr
$26,370
Cap Rate
4.80%
Suggested Prices Based on Cap Rates
Cap Rate 5%
$527,400
$527.4K
Cap Rate 7%
$376,714
$376.7K
Cap Rate 9%
$293,000
$293.0K
Market Conditions
NOI Build-Up for 3,006 SF
Gross rent
$41.8K $13.92/SF
− Vacancy
−$4.2K −$1.39/SF
EGI
$37.7K $12.53/SF
− OpEx
−$11.3K −$3.76/SF
NOI
$26.4K $8.77/SF
Area
Volusia County, FL
Vacancy
9.97%
Lease Rate
$13.92 /SF/Yr
Expense Ratio
30.00%
Simulate Cap Rate and NOI
Suggested Prices Based on Cap Rates
Cap Rate 5%
$527,400
Cap Rate 7%
$376,714
Cap Rate 9%
$293,000
Alternative Uses
Best Use
Multifamily LT 5
$376.7K
$329.6K – $439.5K
NOI $26,370 @ 7.0% cap · market cap 4.80%
Second Best
Apartment 5plus
$327.2K
$286.3K – $381.8K
NOI $22,906 @ 7.0% cap · market cap 4.17%
Theoretical Best
Office A
$886.3K
$775.6K – $1.03M
NOI $62,044 @ 7.0% cap · market cap 11.30%
Zoning and permitted uses should be independently verified with authorities.
How Realmo checks its estimates
Property Analytics
Unlock full access to Insights
Subscribe to Realmo Intelligence
Open Analytics
Current Use
Lease Details
2
Residential units
100%
Occupancy
Multi-tenant
Tenancy
Yes
Utilities to site
Location Intelligence
Trade Area within ½ mile
277
Businesses Nearby
Explore this area
Business Placement
Demographics for 32141, FL
17,955
Population
9,400
Households
1.9
Avg Household Size
54
Median Age
23%
College-Educated
93%
High-School Grad
23.6 sq mi
ZIP Area
761
Density / Sq Mi
$61,110
Median Household Income
$37,874
Median Earnings
$1,481
Median Rent
$244,000
Median Home Value
Check the figures for this property
Cap Rate, Value Estimation, Potential NOI and more
View Realmo Analytics
Market
Vacancy Rate% for Multifamily in South region

Questions? Ask Rey
Realmo’s AI knows this listing — price, zoning, demand, history. Ask anything.




Frequently Asked Questions
What type of property is this?
Duplex - Fully occupied duplex with contemporary finishes, private outdoor areas, and separately metered electric and water service.
Where is this duplex located?
The property is located at 2518 Fern Palm Dr Edgewater, FL.
What is the asking price?
The asking price for this property is $549,000.
What are key features of this property?
This property features: Duplex completed in 2021 with 3,006 SF of building area; Two 3‑bedroom, 2‑bathroom residences, each with an oversized one‑car garage; Oversized 120' x 100' lot with private wooded‑setting backyards


