Renovated Historic Office
For Sale
$3,995,000
1710-12 Locust Street, Philadelphia, PA 19103
Completely renovated historic building with elevator, offices, conference rooms, and 3–4 car parking.
Property Size8,959 SF
Price / SF$420.53
Days on Market583
Property Features for 1710-12 Locust Street
General Information
Standard status
Active
Size
8,959 SF
Total Parking Spaces
4
Property subtype
Multi-Family
Zoning
CMX3
Taxes and HOA fees
Annual Taxes
$20,156
Amenities
Fully Finished
Natural Gas
Yes
Natural Gas,Electric
No
Estimated
4
No Pool
Public
DD0
34.00 x 90.00
0.07
Assessor
Driveway
Concrete Perimeter
287980.00
Building Details
Building Size
8,959 SF
Year Built
1853
Listing Agency:
Samson Properties
(856) 222-0077
Listed By:
Ryan LeBon
Source:
Thetristaterealestategroup
Added: Mar 17, 2025
Changed: Oct 6
Last Checked: Oct 20 at 6:51PM
Displayed information is deemed reliable but is not guaranteed and should be independently verified. All listing content including descriptions, pricing, images are the copyrighted material of Samson Properties

Ask AI about this property
Review the available facts, identify missing information and prepare questions for the agent.
Investment Insights
Based on property information with market context.
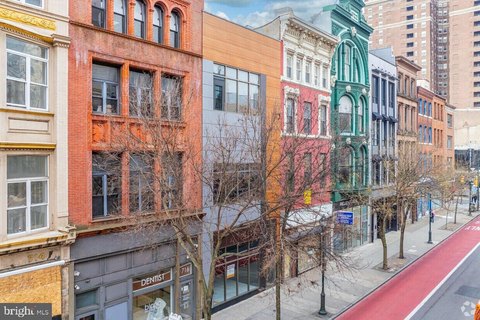
Built circa 1853, 1710–1712 Locust is a historic brick property that has been superbly and completely renovated throughout in pristine, meticulously maintained condition. The building is currently configured as a spacious office with an elevator, reception area, multiple offices and conference rooms, kitchen and eating area, and significant storage, supported by multi-bathroom facilities.
The property features a broad, historic brick façade with a large window assembly that brings substantial natural light into the building. It includes multiple conference rooms, numerous offices, and additional interior spaces designed to operate as an office or transition to other formats.
At approximately 34 feet wide, the offering totals 9,500 square feet and is listed with CMX-3 zoning. The property is described as having 3 to 4 car parking and is positioned within a half block of Rittenhouse Square, providing a setting for multiple flexible use possibilities, including office, residential conversion, live-work, or mixed-use arrangements.
The property features a broad, historic brick façade with a large window assembly that brings substantial natural light into the building. It includes multiple conference rooms, numerous offices, and additional interior spaces designed to operate as an office or transition to other formats.
At approximately 34 feet wide, the offering totals 9,500 square feet and is listed with CMX-3 zoning. The property is described as having 3 to 4 car parking and is positioned within a half block of Rittenhouse Square, providing a setting for multiple flexible use possibilities, including office, residential conversion, live-work, or mixed-use arrangements.
Key Highlights
- Completely renovated historic double property c. 1853 with 9,500 SF and CMX‑3 zoning
- First‑floor office setup includes elevator, reception, multiple offices, conference rooms, kitchen/eating area, and significant storage
- 3 to 4 car parking with total 4 parking spaces and driveway parking; concrete perimeter foundation
Financial Insights
Estimated NOI and Cap Rate
NOI / Yr
$125,016
Cap Rate
3.13%
Suggested Prices Based on Cap Rates
Cap Rate 5%
$2,500,320
$2.5M
Cap Rate 7%
$1,785,943
$1.8M
Cap Rate 9%
$1,389,067
$1.4M
Market Conditions
NOI Build-Up for 9,500 SF
Gross rent
$208.6K $21.96/SF
− Vacancy
−$41.9K −$4.41/SF
EGI
$166.7K $17.55/SF
− OpEx
−$41.7K −$4.39/SF
NOI
$125.0K $13.16/SF
Area
Philadelphia, PA
Vacancy
20.10%
Lease Rate
$21.96 /SF/Yr
Expense Ratio
25.00%
Simulate Cap Rate and NOI
Suggested Prices Based on Cap Rates
Cap Rate 5%
$2,500,320
Cap Rate 7%
$1,785,943
Cap Rate 9%
$1,389,067
Alternative Uses
Best Use
Office B
$1.79M
$1.56M – $2.08M
NOI $125,016 @ 7.0% cap · market cap 3.13%
Second Best
Mixed Use
$1.61M
$1.41M – $1.88M
NOI $112,860 @ 7.0% cap · market cap 2.83%
Theoretical Best
Multifamily LT 5
$2.32M
$2.03M – $2.70M
NOI $162,116 @ 7.0% cap · market cap 4.06%
Zoning and permitted uses should be independently verified with authorities.
How Realmo checks its estimates
Property Analytics
Current Use
Location Intelligence
Trade Area within ½ mile
21,096
Businesses Nearby
Explore this area
Business Placement
Demographics for 19103, PA
28,717
Population
20,064
Households
1.4
Avg Household Size
36
Median Age
81%
College-Educated
98%
High-School Grad
0.6 sq mi
ZIP Area
47,862
Density / Sq Mi
$97,940
Median Household Income
$76,680
Median Earnings
$1,955
Median Rent
$551,700
Median Home Value
Market
Vacancy Rate% for Office in Philadelphia, PA



Frequently Asked Questions
What type of property is this?
Office building - Completely renovated historic building with elevator, offices, conference rooms, and 3–4 car parking.
Where is this office building located?
The property is located at 1710-12 Locust Street Philadelphia, PA.
What is the asking price?
The asking price for this property is $3,995,000.
What are key features of this property?
This property features: Completely renovated historic double property c. 1853 with 9,500 SF and CMX‑3 zoning; First‑floor office setup includes elevator, reception, multiple offices, conference rooms, kitchen/eating area, and significant storage; 3 to 4 car parking with total 4 parking spaces and driveway parking; concrete perimeter foundation