Three-Unit Brick Income
For Sale
$1,649,000
Pending
2456 W 2nd St, Brooklyn, NY 11223
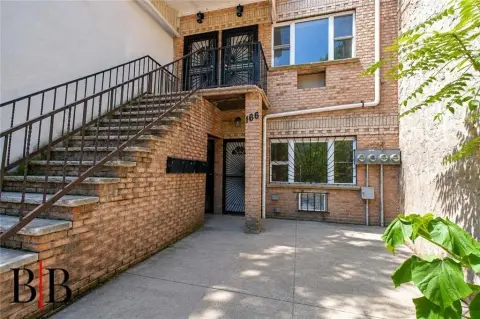
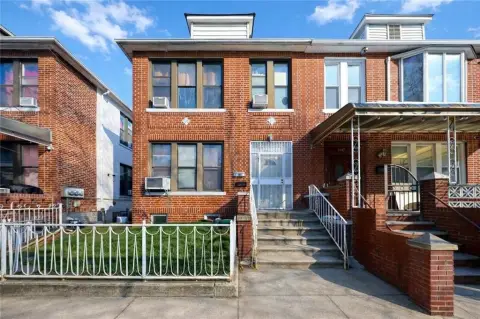
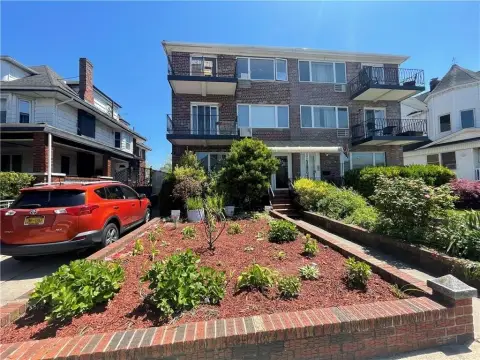
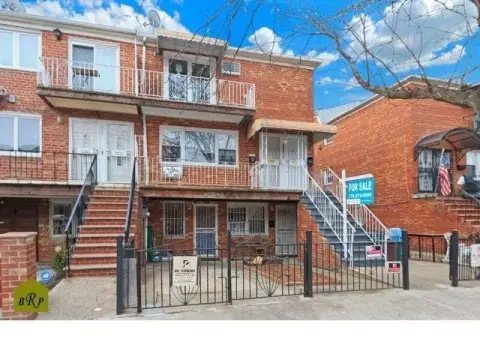
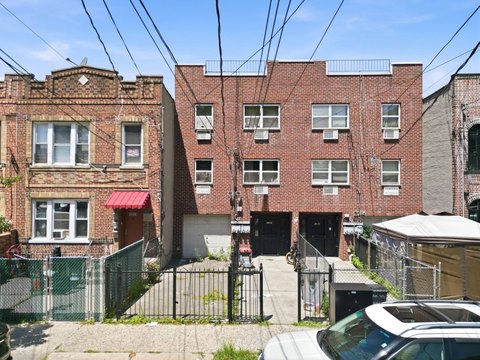
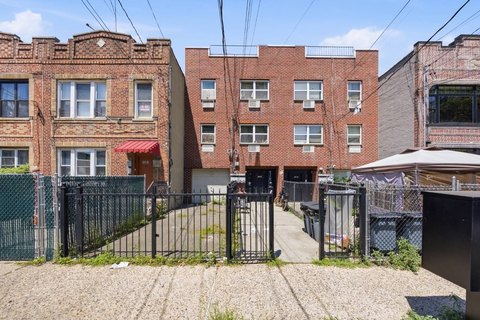
Turnkey 3-family brick residence with finished basement and separate entrance, well-suited for owner-occupants or investors.
Property Size4,400 SF
Days on Market119
Property Features for 2456 W 2nd St
General Information
Standard status
Pending
Size
4,400 SF
Property subtype
Multi Family
Additional Details
Business Included
Yes
Multifamily Units
3
Taxes and HOA fees
Annual Taxes
$11,160
Building Details
Building Size
4,400 SF
Year Built
1993
Stories
4
Tenancy
Multi
Listing Agency:
Ilite Realty Inc
Listed By:
Ayzik Nasimov
(718) 975-0555
Source:
Elliman
Added: Jun 12
Changed: Sep 29
Last Checked: Oct 7 at 1:08PM
Displayed information is deemed reliable but is not guaranteed and should be independently verified. All listing content including descriptions, pricing, images are the copyrighted material of Ilite Realty Inc
Investment Insights
Based on property information with market context.
Four-level legal three-family brick house measuring 20 feet wide by 55 feet deep, totaling 4,400 square feet. The property offers five bedrooms and 6.5 bathrooms across three units, with hardwood and parquet flooring. A fully finished basement includes a separate entrance and access to the backyard, and there is a garage accessed via a private driveway.
All three units are described as move-in ready. The first floor is configured as a 1-bedroom duplex with two bathrooms. The second and third floors each provide 2 bedrooms and 2 bathrooms and feature two balconies apiece; the third-floor unit also includes a custom-built Italian kitchen and closets. The home is located in Gravesend and is noted as being near major shopping, with two major supermarkets within a block in each direction, along with dining, schools, healthcare, and public transportation. NYC Health/Coney Island Hospital, a fitness center, and Chase Bank are also mentioned, with the Coney Island beach and boardwalk minutes away.
With separate entrances and a layout designed for distinct living spaces, the property can fit a multi-generational household or a buyer seeking a straightforward, all-units-move-in configuration. The combination of finished basement access, multiple balconies, and off-street parking supports practical day-to-day living while keeping unit turnover expectations simple for an operator.
All three units are described as move-in ready. The first floor is configured as a 1-bedroom duplex with two bathrooms. The second and third floors each provide 2 bedrooms and 2 bathrooms and feature two balconies apiece; the third-floor unit also includes a custom-built Italian kitchen and closets. The home is located in Gravesend and is noted as being near major shopping, with two major supermarkets within a block in each direction, along with dining, schools, healthcare, and public transportation. NYC Health/Coney Island Hospital, a fitness center, and Chase Bank are also mentioned, with the Coney Island beach and boardwalk minutes away.
With separate entrances and a layout designed for distinct living spaces, the property can fit a multi-generational household or a buyer seeking a straightforward, all-units-move-in configuration. The combination of finished basement access, multiple balconies, and off-street parking supports practical day-to-day living while keeping unit turnover expectations simple for an operator.
Key Highlights
- Legal 3‑family brick residence built in 1993 with 4 levels and 4,400 SF total size
- Total of 5 bedrooms and 6.5 bathrooms across the home
- Fully finished basement with separate entrance plus backyard access
Financial Insights
Estimated NOI and Cap Rate
NOI / Yr
$134,327
Cap Rate
8.15%
Suggested Prices Based on Cap Rates
Cap Rate 5%
$2,686,540
$2.7M
Cap Rate 7%
$1,918,957
$1.9M
Cap Rate 9%
$1,492,522
$1.5M
Market Conditions
NOI Build-Up for 4,400 SF
Gross rent
$249.2K $56.64/SF
− Vacancy
−$5.0K −$1.13/SF
EGI
$244.2K $55.51/SF
− OpEx
−$109.9K −$24.98/SF
NOI
$134.3K $30.53/SF
Area
Brooklyn, NY
Vacancy
2.00%
Lease Rate
$56.64 /SF/Yr
Expense Ratio
45.00%
Simulate Cap Rate and NOI
Suggested Prices Based on Cap Rates
Cap Rate 5%
$2,686,540
Cap Rate 7%
$1,918,957
Cap Rate 9%
$1,492,522
Alternative Uses
Best Use
Multifamily LT 5
$2.20M
$1.93M – $2.57M
NOI $154,095 @ 7.0% cap · market cap 9.34%
Second Best
Apartment 5plus
$1.92M
$1.68M – $2.24M
NOI $134,327 @ 7.0% cap · market cap 8.15%
Theoretical Best
Specialty Retail
$3.64M
$3.19M – $4.25M
NOI $255,024 @ 7.0% cap · market cap 15.47%
Zoning and permitted uses should be independently verified with authorities.
Property Analytics
Unlock full access to Insights
Subscribe to Realmo Intelligence
Open Analytics
Current Use
Lease Details
3
Residential units
Multi-tenant
Tenancy
Turnkey business
Opportunity
Location Intelligence
Trade Area within ½ mile
2,819
Businesses Nearby
Explore this area
Business Placement
Demographics for 11223, NY
83,519
Population
28,857
Households
2.9
Avg Household Size
37
Median Age
34%
College-Educated
78%
High-School Grad
2.1 sq mi
ZIP Area
39,771
Density / Sq Mi
$63,950
Median Household Income
$40,592
Median Earnings
$1,653
Median Rent
$1,063,200
Median Home Value
Check the figures for this property
Cap Rate, Value Estimation, Potential NOI and more
View Realmo Analytics
Market
Vacancy Rate% for Multifamily in Northeast region

Questions? Ask Rey
Realmo’s AI knows this listing — price, zoning, demand, history. Ask anything.





Frequently Asked Questions
What type of property is this?
Triplex - Turnkey 3-family brick residence with finished basement and separate entrance, well-suited for owner-occupants or investors.
Where is this triplex located?
The property is located at 2456 W 2nd St Brooklyn, NY.
What is the asking price?
The asking price for this property is $1,649,000.
What are key features of this property?
This property features: Legal 3‑family brick residence built in 1993 with 4 levels and 4,400 SF total size; Total of 5 bedrooms and 6.5 bathrooms across the home; Fully finished basement with separate entrance plus backyard access


