Auto Collision Shop with Secure
For Sale
Contact for pricing
2345 Merrick Rd, Bellmore, NY 11710
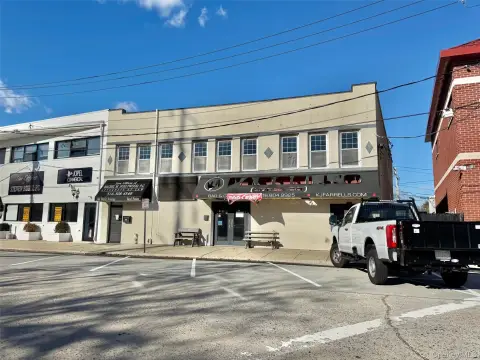
Operational collision-repair facility with service bays, fenced storage areas, customer parking, and dedicated spray-booth space.
Property Size6,000 SF
Lot Size0.39 Acres
Price / SF$666.50
Days on Market59
Property Features for 2345 Merrick Rd
General Information
Standard status
Active
Size
6,000 SF
Total Parking Spaces
11
Lot size
0.39 Acres
Property subtype
Business for Sale
Investment Type
Owner/User
Site & Location
Traffic Count
36,000 vehicles/day
Road Access
Yes
Fenced Yard
Yes
Outdoor Storage
Yes
Additional Details
Sprinkler System
Yes
Service Bays
6
Amenities
monitored security system
fire suppression system
spray booth
oil-fired heating
central air conditioning
marquee signage
Building Details
Buildings
1
Listing Agency:
Douglas Elliman Commercial Division
Listed By:
Michael Murphy · License #NY 10491211076
(631) 858-2405
Source:
Crexi
Added: Aug 19
Changed: Oct 14
Last Checked: Oct 14 at 9:40PM
Displayed information is deemed reliable but is not guaranteed and should be independently verified. All listing content including descriptions, pricing, images are the copyrighted material of Douglas Elliman Commercial Division

Ask AI about this property
Review the available facts, identify missing information and prepare questions for the agent.
Investment Insights
Based on property information with market context.
Located at 2345 Merrick Rd in Bellmore, this 6,000-square-foot auto collision facility occupies a 0.39-acre parcel and is configured for body repair operations. The building includes six drive-in service bays, a dedicated spray booth area, office space, and workspace for vehicle processing. Shop and spray booth areas use oil-fired heat, while the office has electric heat and central air conditioning. A monitored security system and fire suppression system are also in place.
Outdoor functionality includes fenced side and rear yards for vehicle storage, staging, inventory, equipment, or fleet use. Eleven front parking spaces serve customers and employees. The property is two minutes from the Bellmore Long Island Rail Road station, with surrounding national retailers, local businesses, restaurants, and service providers. Traffic counts exceed 36,000 vehicles per day, and the site includes marquee signage and street frontage along Merrick Rd.
Outdoor functionality includes fenced side and rear yards for vehicle storage, staging, inventory, equipment, or fleet use. Eleven front parking spaces serve customers and employees. The property is two minutes from the Bellmore Long Island Rail Road station, with surrounding national retailers, local businesses, restaurants, and service providers. Traffic counts exceed 36,000 vehicles per day, and the site includes marquee signage and street frontage along Merrick Rd.
Key Highlights
- 6,000‑square‑foot auto collision facility on a 0.39‑acre parcel
- Six drive‑in service bays with dedicated spray booth area
- Fenced side yard and fenced rear yard for storage and staging
Financial Insights
Estimated NOI and Cap Rate
NOI / Yr
$118,818
Cap Rate
2.97%
Suggested Prices Based on Cap Rates
Cap Rate 5%
$2,376,360
$2.4M
Cap Rate 7%
$1,697,400
$1.7M
Cap Rate 9%
$1,320,200
$1.3M
Market Conditions
NOI Build-Up for 6,000 SF
Gross rent
$180.0K $30.00/SF
− Vacancy
−$10.3K −$1.71/SF
EGI
$169.7K $28.29/SF
− OpEx
−$50.9K −$8.49/SF
NOI
$118.8K $19.80/SF
Area
Nassau County, NY
Vacancy
5.70%
Lease Rate
$30.00 /SF/Yr
Expense Ratio
30.00%
Simulate Cap Rate and NOI
Suggested Prices Based on Cap Rates
Cap Rate 5%
$2,376,360
Cap Rate 7%
$1,697,400
Cap Rate 9%
$1,320,200
Alternative Uses
Best Use
Retail
$1.70M
$1.49M – $1.98M
NOI $118,818 @ 7.0% cap · market cap 2.97%
Second Best
Industrial
$1.23M
$1.07M – $1.43M
NOI $85,868 @ 7.0% cap · market cap 2.15%
Theoretical Best
Specialty Retail
$3.97M
$3.47M – $4.63M
NOI $277,695 @ 7.0% cap · market cap 6.94%
Zoning and permitted uses should be independently verified with authorities.
How Realmo checks its estimates
Property Analytics
Unlock full access to Insights
Subscribe to Realmo Intelligence
Open Analytics
Current Use
Lease Details
6
Service bays
36,000 VPD
Traffic count
Yes
Sprinkler system
Yes
Fenced yard
Yes
Paved road access
Location Intelligence
Trade Area within ½ mile
1,340
Businesses Nearby
Well-served
Demand for This Use
Explore this area
Business Placement
Demographics for 11710, NY
35,155
Population
11,717
Households
3
Avg Household Size
43
Median Age
54%
College-Educated
97%
High-School Grad
4.9 sq mi
ZIP Area
7,174
Density / Sq Mi
$173,136
Median Household Income
$76,812
Median Earnings
$2,495
Median Rent
$647,000
Median Home Value
Check the figures for this property
Cap Rate, Value Estimation, Potential NOI and more
View Realmo Analytics
Market
Vacancy Rate% for Retail in Northeast region




Similar Off Market Nearby
- Merrick Motors — 125 Merrick Rd, Merrick, NY 11566
- Seaford Tow Truck Company — 94 G00driĉh Śt Iseliň, NJ 08830 MG87+G8 Merrick Rd, Seaford Iseliň 08830, Seaford, NY 11783
- Vinny & JP auto — 2129 Merrick Rd, Merrick, NY 11566
- Dial Transmission Inc — 2242 Merrick Rd, Merrick, NY 11566
- Hennig Collision Inc — 2345 Merrick Rd, Bellmore, NY 11710
Frequently Asked Questions
What type of property is this?
Auto shop - Operational collision-repair facility with service bays, fenced storage areas, customer parking, and dedicated spray-booth space.
Where is this auto shop located?
The property is located at 2345 Merrick Rd Bellmore, NY.
What is the asking price?
The asking price for this property is $3,999,000.
What are key features of this property?
This property features: 6,000‑square‑foot auto collision facility on a 0.39‑acre parcel; Six drive‑in service bays with dedicated spray booth area; Fenced side yard and fenced rear yard for storage and staging


