All-Brick Two-Family
For Sale
$775,000
23 Twombly Ave, Staten Island, NY 10306
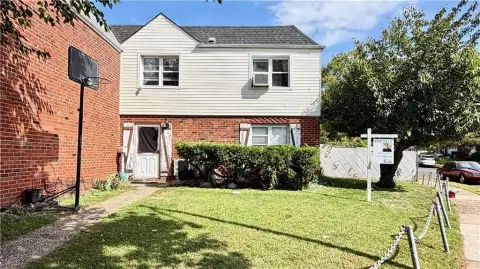
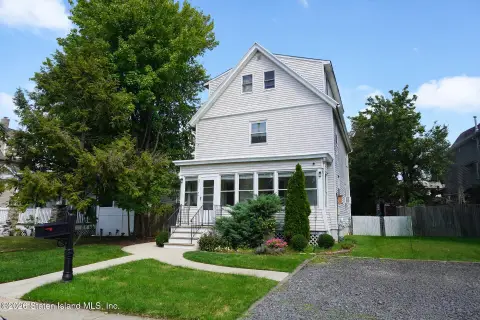
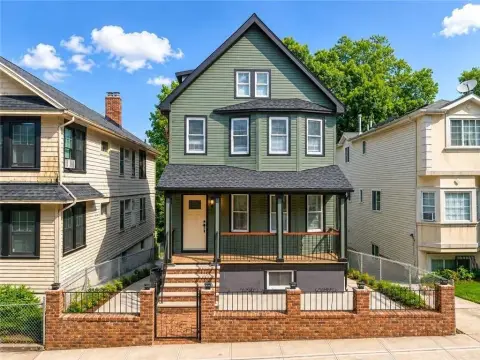
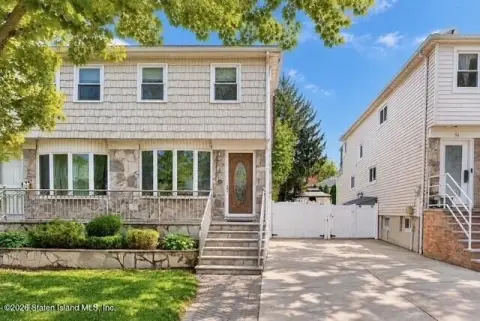
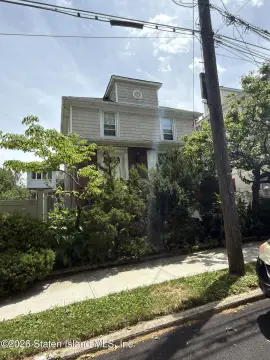
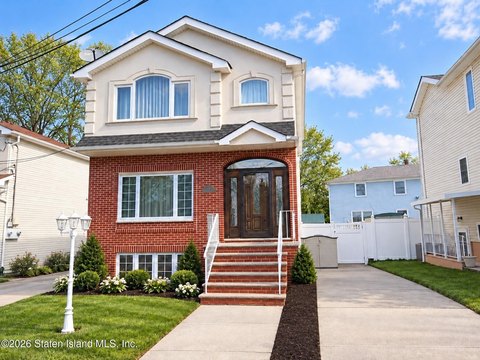
All-brick two-unit home with unfinished basement and tenant-paid utilities, sold as-is with both units occupied.
Property Size1,820 SF
Price / SF$425.82
Days on Market121
Property Features for 23 Twombly Ave
General Information
Standard status
Active
Size
1,820 SF
Property subtype
Multi-Family
Additional Details
Multifamily Units
2
Building Details
Year Built
1960
Listing Agency:
Ed Bruno Realty, LLC
Listed By:
Edward M Bruno · License #10491206964
(917) 365-5652
Source:
Statenislandhomelistings
Added: Jun 14
Changed: Oct 10
Last Checked: Oct 11 at 6:33AM
Displayed information is deemed reliable but is not guaranteed and should be independently verified. All listing content including descriptions, pricing, images are the copyrighted material of Ed Bruno Realty, LLC
Investment Insights
Based on property information with market context.
This all-brick two-family semi offers two separate units, each described as 4 rooms with 2 bedrooms. The property includes a full unfinished basement, providing additional storage or expansion options depending on how it is finished. The home requires some TLC, and it is being sold as-is. Both units are being conveyed with occupancy of both tenants, and there are no leases in place.
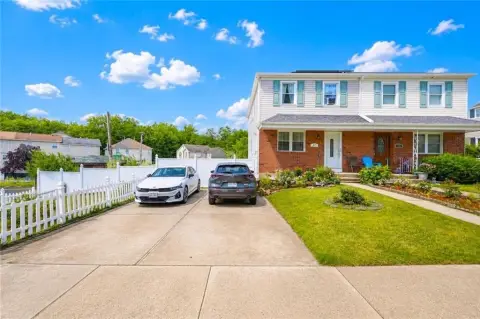
The layout is supported by individual utility setups, with tenants paying their own utilities through separate metering. The property lists 2 gas forced-air heating units and 2 gas hot water tanks, along with 2 gas meters and 2 electric meters. Outside, there is a driveway plus side and rear yard space.
For buyers and investors seeking an occupied, ready-to-hold income property, this two-family semi presents two units under current tenant occupancy while avoiding lease assumptions. The unfinished basement and outdoor yard areas may appeal to owners planning improvements after closing, though the current condition should be reviewed closely given the stated need for TLC. Utilities are handled by tenants, which can simplify ongoing operating considerations for the next owner.
The layout is supported by individual utility setups, with tenants paying their own utilities through separate metering. The property lists 2 gas forced-air heating units and 2 gas hot water tanks, along with 2 gas meters and 2 electric meters. Outside, there is a driveway plus side and rear yard space.
For buyers and investors seeking an occupied, ready-to-hold income property, this two-family semi presents two units under current tenant occupancy while avoiding lease assumptions. The unfinished basement and outdoor yard areas may appeal to owners planning improvements after closing, though the current condition should be reviewed closely given the stated need for TLC. Utilities are handled by tenants, which can simplify ongoing operating considerations for the next owner.
Key Highlights
- All‑brick 2‑family semi home built in 1960
- Both units are occupied at sale with no leases in place
- Tenant‑paid utilities with 2 gas forced‑air heating units and 2 gas hot water tanks
Financial Insights
Estimated NOI and Cap Rate
NOI / Yr
$46,231
Cap Rate
5.97%
Suggested Prices Based on Cap Rates
Cap Rate 5%
$924,620
$924.6K
Cap Rate 7%
$660,443
$660.4K
Cap Rate 9%
$513,678
$513.7K
Market Conditions
NOI Build-Up for 1,820 SF
Gross rent
$69.9K $38.40/SF
− Vacancy
−$3.8K −$2.11/SF
EGI
$66.0K $36.29/SF
− OpEx
−$19.8K −$10.89/SF
NOI
$46.2K $25.40/SF
Area
ZIP 10306
Vacancy
5.50%
Lease Rate
$38.40 /SF/Yr
Expense Ratio
30.00%
Simulate Cap Rate and NOI
Suggested Prices Based on Cap Rates
Cap Rate 5%
$924,620
Cap Rate 7%
$660,443
Cap Rate 9%
$513,678
Alternative Uses
Best Use
Multifamily LT 5
$660.4K
$577.9K – $770.5K
NOI $46,231 @ 7.0% cap · market cap 5.97%
Second Best
Apartment 5plus
$586.9K
$513.5K – $684.7K
NOI $41,081 @ 7.0% cap · market cap 5.30%
Theoretical Best
Office A
$868.4K
$759.9K – $1.01M
NOI $60,788 @ 7.0% cap · market cap 7.84%
Zoning and permitted uses should be independently verified with authorities.
How Realmo checks its estimates
Property Analytics
Unlock full access to Insights
Subscribe to Realmo Intelligence
Open Analytics
Current Use
Lease Details
2
Residential units
Location Intelligence
Trade Area within ½ mile
536
Businesses Nearby
Explore this area
Business Placement
Demographics for 10306, NY
57,919
Population
21,299
Households
2.7
Avg Household Size
43
Median Age
34%
College-Educated
88%
High-School Grad
7.2 sq mi
ZIP Area
8,044
Density / Sq Mi
$97,746
Median Household Income
$54,052
Median Earnings
$1,743
Median Rent
$675,400
Median Home Value
Check the figures for this property
Cap Rate, Value Estimation, Potential NOI and more
View Realmo Analytics
Market
Vacancy Rate% for Multifamily in Northeast region

Questions? Ask Rey
Realmo’s AI knows this listing — price, zoning, demand, history. Ask anything.
Frequently Asked Questions
What type of property is this?
Duplex - All-brick two-unit home with unfinished basement and tenant-paid utilities, sold as-is with both units occupied.
Where is this duplex located?
The property is located at 23 Twombly Ave Staten Island, NY.
What is the asking price?
The asking price for this property is $775,000.
What are key features of this property?
This property features: All‑brick 2‑family semi home built in 1960; Both units are occupied at sale with no leases in place; Tenant‑paid utilities with 2 gas forced‑air heating units and 2 gas hot water tanks


