Warehouse Property with Secured
For Sale
Contact for pricing
225 W 30th St, National City, CA 91950
Industrial-zoned warehouse property with paved, fenced outdoor storage and substantial office space.
Property Size46,454 SF
Lot Size2.29 Acres
Price / SF$275
Days on Market226
Property Features for 225 W 30th St
General Information
Standard status
Active
Size
46,454 SF
Total Parking Spaces
28
Lot size
2.29 Acres
Property subtype
Industrial
Zoning
ML (LIGHT INDUSTRIAL) – NATIONAL CITY
Investment Type
Owner/User
Site & Location
Highway Access
Yes
Fenced Yard
Yes
Outdoor Storage
Yes
Utilities to Site
Yes
Warehouse & Industrial
Clear Height
22 ft
Warehouse Space
44,498 SF
Office Build-Out
10,000 SF
Dock-High Doors
2
Drive-In Doors
4
Power
1,800 amps
Voltage
480 V
Heavy Power
Yes
Sprinkler System
Yes
Amenities
Gated Secured Outside Storage Yard
Fully Paved And Fenced
Heavy Power To Site
Solar System
Building Details
Year Built
1971
Buildings
3
Stories
1
Tenancy
Multi
Listing Agency:
CBRE - San Diego
Listed By:
Matt Pourcho · License #CA 01705763
(858) 546-4622
Source:
Crexi
Added: Mar 3
Changed: Oct 4
Last Checked: Oct 14 at 9:24PM
Displayed information is deemed reliable but is not guaranteed and should be independently verified. All listing content including descriptions, pricing, images are the copyrighted material of CBRE - San Diego

Ask AI about this property
Review the available facts, identify missing information and prepare questions for the agent.
Investment Insights
Based on property information with market context.
This industrial warehouse property contains 44,498 SF of warehouse area along with approximately 10,000 SF of office space. The improvements include four grade-level roll-up doors, two dock-high doors, 22-foot clear height, full fire sprinklers, and heavy electrical capacity rated at 1,800 amps and 480 volts. Conduit is in place for 4,000 amps. A new roof and solar system are also part of the property improvements.
The facility occupies a 99,752-square-foot, or 2.29-acre, lot in the City of National City’s industrial zoning district. The secured exterior storage yard is paved, enclosed, and accessed through gated entry. Freeway connections include I-5, I-805, and SR-54, with proximity to the 32nd Street Marine Terminal, Navy, NASSCO, and BAE.
The facility occupies a 99,752-square-foot, or 2.29-acre, lot in the City of National City’s industrial zoning district. The secured exterior storage yard is paved, enclosed, and accessed through gated entry. Freeway connections include I-5, I-805, and SR-54, with proximity to the 32nd Street Marine Terminal, Navy, NASSCO, and BAE.
Key Highlights
- 44,498 SF of warehouse space plus approximately 10,000 SF of office area
- Four grade‑level roll‑up doors and two dock‑high doors
- Gated, secured outside storage yard with full paving and fencing
Financial Insights
Estimated NOI and Cap Rate
NOI / Yr
$1,074,899
Cap Rate
8.41%
Suggested Prices Based on Cap Rates
Cap Rate 5%
$21,497,980
$21.5M
Cap Rate 7%
$15,355,700
$15.4M
Cap Rate 9%
$11,943,322
$11.9M
Market Conditions
NOI Build-Up for 46,454 SF
Gross rent
$1.67M $36.00/SF
− Vacancy
−$239.1K −$5.15/SF
EGI
$1.43M $30.85/SF
− OpEx
−$358.3K −$7.71/SF
NOI
$1.07M $23.14/SF
Area
San Diego County, CA
Vacancy
14.30%
Lease Rate
$36.00 /SF/Yr
Expense Ratio
25.00%
Simulate Cap Rate and NOI
Suggested Prices Based on Cap Rates
Cap Rate 5%
$21,497,980
Cap Rate 7%
$15,355,700
Cap Rate 9%
$11,943,322
Alternative Uses
Best Use
Office B
$15.36M
$13.44M – $17.91M
NOI $1,074,899 @ 7.0% cap · market cap 8.41%
Second Best
Flex RnD
$13.68M
$11.97M – $15.96M
NOI $957,537 @ 7.0% cap · market cap 7.50%
Theoretical Best
Office A
$21.28M
$18.62M – $24.83M
NOI $1,489,858 @ 7.0% cap · market cap 11.66%
Zoning and permitted uses should be independently verified with authorities.
How Realmo checks its estimates
Property Analytics
Unlock full access to Insights
Subscribe to Realmo Intelligence
Open Analytics
Current Use
Lease Details
22 ft
Clear height
2
Dock-high doors
4
Drive-in doors
Yes
Heavy power
Yes
Sprinkler system
Yes
Fenced yard
Yes
Highway access
Yes
Utilities to site
Location Intelligence
Trade Area within ½ mile
1,327
Businesses Nearby
Well-served
Demand for This Use
Explore this area
Business Placement
Demographics for 91950, CA
57,849
Population
19,049
Households
3
Avg Household Size
36
Median Age
16%
College-Educated
76%
High-School Grad
7.3 sq mi
ZIP Area
7,925
Density / Sq Mi
$63,858
Median Household Income
$34,013
Median Earnings
$1,600
Median Rent
$580,700
Median Home Value
Check the figures for this property
Cap Rate, Value Estimation, Potential NOI and more
View Realmo Analytics
Market
Vacancy Rate% for Office in West region


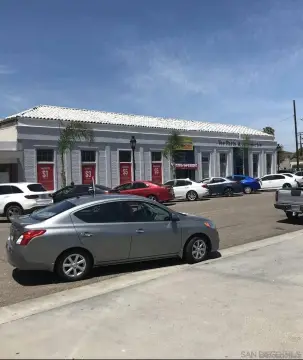


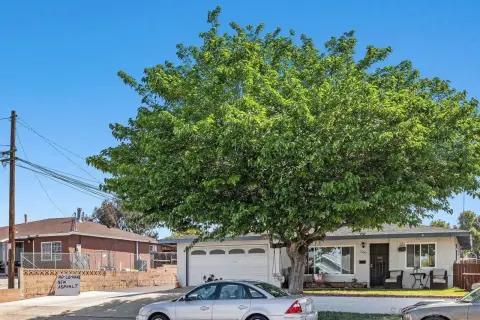

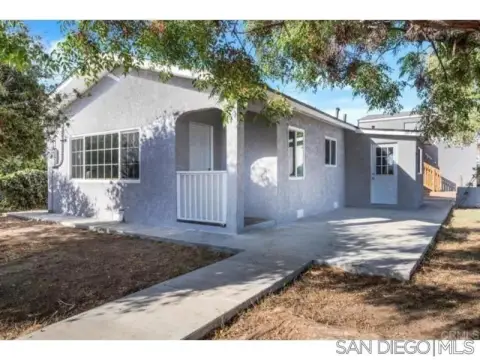
Similar Off Market Nearby
- Iron Mountain — 310 W 35th St A, National City, CA 91950
- Self-Storage at U-Haul — 99 N 4th Ave, Chula Vista, CA 91910
- National City Self Storage — 430 W 30th St, National City, CA 91950
- A-1 Self Storage — 3200 National City Blvd, National City, CA 91950
- Prime Storage — 325 Trousdale Dr, Chula Vista, CA 91910
Frequently Asked Questions
What type of property is this?
Warehouse - Industrial-zoned warehouse property with paved, fenced outdoor storage and substantial office space.
Where is this warehouse located?
The property is located at 225 W 30th St National City, CA.
What is the asking price?
The asking price for this property is $12,775,000.
What are key features of this property?
This property features: 44,498 SF of warehouse space plus approximately 10,000 SF of office area; Four grade‑level roll‑up doors and two dock‑high doors; Gated, secured outside storage yard with full paving and fencing


