Renovated Multifamily Property in
For Sale
$1,600,000
Pending
2190 Southwest 14th Terrace, Miami, FL 33145
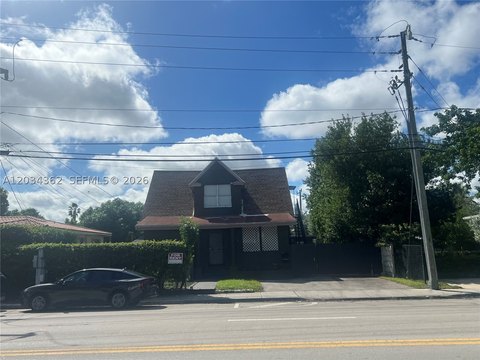
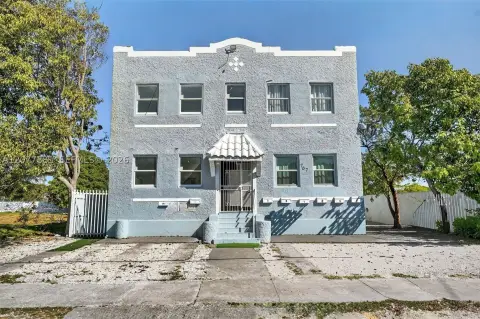
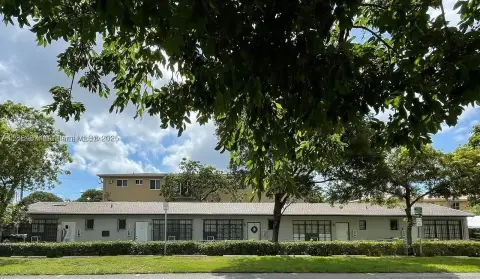
Fully renovated, 6-unit multifamily property in Miami's Shenandoah corridor.
Property Size3,290 SF
Days on Market155
Property Features for 2190 Southwest 14th Terrace
General Information
Standard status
Pending
Size
3,290 SF
Property subtype
Residential Income / Fourplex
Taxes and HOA fees
Annual Taxes
$15,900
Building Details
Year Built
1957
Listing Agency:
Compass Florida, LLC
Listed By:
Jesse Spencer · License #3282789
(305) 632-7195
Source:
Compass
Added: May 13
Changed: Oct 14
Last Checked: Oct 13 at 1:35AM
Displayed information is deemed reliable but is not guaranteed and should be independently verified. All listing content including descriptions, pricing, images are the copyrighted material of Compass Florida, LLC
Investment Insights
Based on property information with market context.
Located in Miami's Shenandoah corridor, 2190 SW 14th Terrace is a fully renovated, turnkey, 100% leased 6-unit multifamily property. The property generates a stabilized in-place income of $132,000 annually, with all leases running through mid-2027. A comprehensive renovation in 2020 included a new roof, hurricane-rated impact windows and doors, individual mini-split HVAC (central AC in one unit), new electrical systems, perimeter fencing, a full interior renovation with new tile flooring, kitchens and bathrooms, coinless laundry (owned), and tankless water heaters. The unit mix consists of 2 studios, each approximately 450 square feet, and 4 one-bed/one-bath apartments, each approximately 600 square feet. Each unit has an assigned on-site parking space. The property is centrally positioned minutes from Brickell, the Health District, Coral Gables, Coconut Grove, and Calle Ocho. Shenandoah is at a higher elevation than Miami's coastal submarkets.
Key Highlights
- Fully renovated in 2020 with new roof, impact windows/doors, mini‑split HVAC (central AC in one unit), electrical, and interior finishes.
- 100% leased 6‑unit multifamily property providing stabilized in‑place income of $132,000 annually.**
- All leases run through mid‑2027.
Financial Insights
Estimated NOI and Cap Rate
NOI / Yr
$60,777
Cap Rate
3.80%
Suggested Prices Based on Cap Rates
Cap Rate 5%
$1,215,540
$1.2M
Cap Rate 7%
$868,243
$868.2K
Cap Rate 9%
$675,300
$675.3K
Market Conditions
NOI Build-Up for 3,290 SF
Gross rent
$118.4K $36.00/SF
− Vacancy
−$7.9K −$2.41/SF
EGI
$110.5K $33.59/SF
− OpEx
−$49.7K −$15.11/SF
NOI
$60.8K $18.47/SF
Area
Miami, FL
Vacancy
6.70%
Lease Rate
$36.00 /SF/Yr
Expense Ratio
45.00%
Simulate Cap Rate and NOI
Suggested Prices Based on Cap Rates
Cap Rate 5%
$1,215,540
Cap Rate 7%
$868,243
Cap Rate 9%
$675,300
Alternative Uses
Best Use
Apartment 5plus
$868.2K
$759.7K – $1.01M
NOI $60,777 @ 7.0% cap · market cap 3.80%
Second Best
—
—
no second resolved use
Theoretical Best
Specialty Retail
$2.22M
$1.94M – $2.59M
NOI $155,454 @ 7.0% cap · market cap 9.72%
Zoning and permitted uses should be independently verified with authorities.
How Realmo checks its estimates
Property Analytics
Unlock full access to Insights
Subscribe to Realmo Intelligence
Open Analytics
Current Use
Location Intelligence
Trade Area within ½ mile
2,352
Businesses Nearby
Explore this area
Business Placement
Demographics for 33145, FL
29,737
Population
12,773
Households
2.3
Avg Household Size
44
Median Age
42%
College-Educated
85%
High-School Grad
2.5 sq mi
ZIP Area
11,895
Density / Sq Mi
$70,592
Median Household Income
$43,039
Median Earnings
$1,769
Median Rent
$560,300
Median Home Value
Check the figures for this property
Cap Rate, Value Estimation, Potential NOI and more
View Realmo Analytics
Market
Vacancy Rate% for Multifamily in South region

Questions? Ask Rey
Realmo’s AI knows this listing — price, zoning, demand, history. Ask anything.






Frequently Asked Questions
What type of property is this?
Apartment building - Fully renovated, 6-unit multifamily property in Miami's Shenandoah corridor.
Where is this apartment building located?
The property is located at 2190 Southwest 14th Terrace Miami, FL.
What is the asking price?
The asking price for this property is $1,600,000.
What are key features of this property?
This property features: Fully renovated in 2020 with **new roof, impact windows/doors, mini‑split HVAC (central AC in one unit), electrical, and interior finishes.**; 100% leased 6‑unit multifamily property providing stabilized in‑place income of $132,000 annually.**; All leases run through mid‑2027.


