Commercial Land with
For Sale
$875,000
2168 John G Richards Rd, Camden, SC 29020
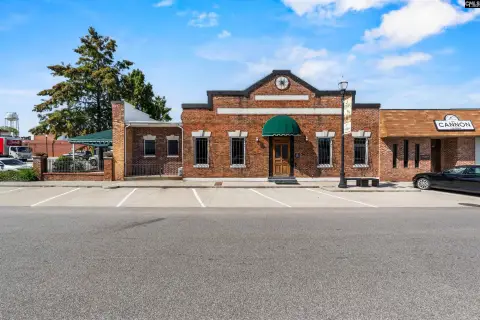
Large commercial tract with an existing building, septic system, and proximity to Lake Wateree public access.
Property Size2,400 SF
Price / SF$364.58
Days on Market118
Property Features for 2168 John G Richards Rd
General Information
Standard status
Active
Size
2,400 SF
Listing Agency:
Home & Land Pros LLC
Listed By:
Mindy Player · License #22055
(803) 600-6652
Source:
Exprealty
Added: Jun 19
Changed: Oct 14
Last Checked: Oct 12 at 10:23PM
Displayed information is deemed reliable but is not guaranteed and should be independently verified. All listing content including descriptions, pricing, images are the copyrighted material of Home & Land Pros LLC
Investment Insights
Based on property information with market context.
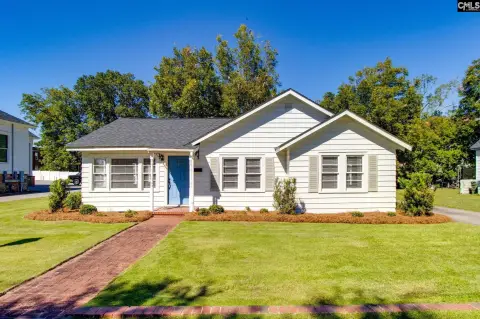
This commercial land offering encompasses 28+ acres and includes an approximately 2,400-square-foot building with an existing septic system. The property combines substantial land area with an existing improvement, providing a physical base for future commercial or mixed-use planning.
Located at 2168 John G Richards Rd in Camden, South Carolina, the property is near Lake Wateree and public lake access. The source information identifies potential applications including an RV campground, marina-related business, boat sales and service, restaurant, outdoor recreation venue, or mixed-use commercial development. The offering includes parcels 029, 030, 011, 003, and 056.
Located at 2168 John G Richards Rd in Camden, South Carolina, the property is near Lake Wateree and public lake access. The source information identifies potential applications including an RV campground, marina-related business, boat sales and service, restaurant, outdoor recreation venue, or mixed-use commercial development. The offering includes parcels 029, 030, 011, 003, and 056.
Key Highlights
- 28+ acres of commercial and residential property
- Approximately 2,400‑square‑foot building included
- Existing septic system
Financial Insights
Estimated NOI and Cap Rate
NOI / Yr
$31,464
Cap Rate
3.60%
Suggested Prices Based on Cap Rates
Cap Rate 5%
$629,280
$629.3K
Cap Rate 7%
$449,486
$449.5K
Cap Rate 9%
$349,600
$349.6K
Market Conditions
NOI Build-Up for 2,400 SF
Gross rent
$54.7K $22.80/SF
− Vacancy
−$4.4K −$1.82/SF
EGI
$50.3K $20.98/SF
− OpEx
−$18.9K −$7.87/SF
NOI
$31.5K $13.11/SF
Area
Kershaw County, SC
Vacancy
8.00%
Lease Rate
$22.80 /SF/Yr
Expense Ratio
37.50%
Simulate Cap Rate and NOI
Suggested Prices Based on Cap Rates
Cap Rate 5%
$629,280
Cap Rate 7%
$449,486
Cap Rate 9%
$349,600
Alternative Uses
Best Use
Mixed Use
$449.5K
$393.3K – $524.4K
NOI $31,464 @ 7.0% cap · market cap 3.60%
Second Best
—
—
no second resolved use
Theoretical Best
Office A
$591.0K
$517.1K – $689.5K
NOI $41,368 @ 7.0% cap · market cap 4.73%
Zoning and permitted uses should be independently verified with authorities.
How Realmo checks its estimates
Property Analytics
Unlock full access to Insights
Subscribe to Realmo Intelligence
Open Analytics
Current Use
Location Intelligence
Trade Area within ½ mile
5
Businesses Nearby
Explore this area
Business Placement
Demographics for 29020, SC
23,264
Population
11,324
Households
2.1
Avg Household Size
45
Median Age
28%
College-Educated
89%
High-School Grad
232.7 sq mi
ZIP Area
100
Density / Sq Mi
$59,389
Median Household Income
$38,329
Median Earnings
$842
Median Rent
$208,800
Median Home Value
Check the figures for this property
Cap Rate, Value Estimation, Potential NOI and more
View Realmo Analytics

Questions? Ask Rey
Realmo’s AI knows this listing — price, zoning, demand, history. Ask anything.




Frequently Asked Questions
What type of property is this?
Commercial land - Large commercial tract with an existing building, septic system, and proximity to Lake Wateree public access.
Where is this commercial land located?
The property is located at 2168 John G Richards Rd Camden, SC.
What is the asking price?
The asking price for this property is $875,000.
What are key features of this property?
This property features: 28+ acres of commercial and residential property; Approximately 2,400‑square‑foot building included; Existing septic system