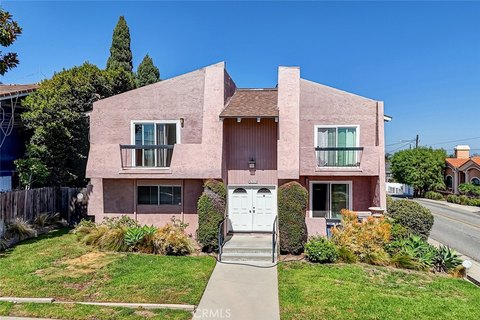
Remodeled Fourplex with Rooftop
For Sale
$3,045,000
2118 Carnegie Ln, Redondo Beach, CA 90278
Updated interiors feature contemporary finishes, stacking laundry units, garages, storage, and EV charging capability.
Property Size5,302 SF
Days on Market59
Property Features for 2118 Carnegie Ln
General Information
Standard status
Active
Size
5,302 SF
Property subtype
Multifamily
Site & Location
Highway Access
Yes
Public Transit
Yes
Units
Unit Mix
1 x 4BR/3BA, 2 x 2BR/2BA, 1 x 2BR/1BA
Multifamily Units
4
Amenities
rooftop decks
garages with EV charging capability
storage
security features
stacking laundry units
Turnkey Redondo Beach Fourplex: Stunning asset has been completely remodeled
Strong Unit Mix: Property features one four-bed/three-bath unit, two two-bed/two-baths, and one two-bed/one-bath
Desirable Amenities: Rooftop decks, in-unit laundry, garages with E/V charging, remodeled interiors, and more
RUBS Program Already In Place: RUBS recoups utility costs to maximize cash flow
Excellent Rental Location: Coastal submarket with consistent rental demand and easy access to beaches, retail, and freeways
Building Details
Building Size
5,302 SF
Buildings
1
Units
4
Listing Agency:
South Bay Office
Listed By:
Austin Stuard · License #License(s): CA: 02363603
(424) 405-3899
Source:
Marcusmillichap
Added: Aug 13
Changed: Sep 10
Last Checked: Oct 9 at 4:17PM
Displayed information is deemed reliable but is not guaranteed and should be independently verified. All listing content including descriptions, pricing, images are the copyrighted material of South Bay Office
Investment Insights
Based on property information with market context.
This fourplex in Redondo Beach, CA 90278 was built in 1972 and extensively remodeled. The unit mix includes one four-bedroom, three-bathroom residence; two two-bedroom, two-bathroom residences; and one two-bedroom, one-bathroom residence. Interior improvements include vinyl plank flooring, quartz countertops, stainless steel appliances, updated cabinetry, modern fixtures, and stacking laundry units.
Additional property features include rooftop decks, garages with EV charging capability, storage areas, security features, a new roof, and a repaved driveway. The property is located in the coastal South Bay submarket, with access to beaches, retail, dining, and major freeways identified in the property information. Bike Score is 66, Walk Score is 0, and Transit Score is 44.
Additional property features include rooftop decks, garages with EV charging capability, storage areas, security features, a new roof, and a repaved driveway. The property is located in the coastal South Bay submarket, with access to beaches, retail, dining, and major freeways identified in the property information. Bike Score is 66, Walk Score is 0, and Transit Score is 44.
Key Highlights
- Four‑unit property in Redondo Beach, CA 90278
- Unit mix includes 1 four‑bedroom/3‑bathroom unit, 2 two‑bedroom/2‑bathroom units, and 1 two‑bedroom/1‑bathroom unit
- Extensively remodeled with vinyl plank flooring, quartz countertops, stainless steel appliances, and updated cabinetry
Financial Insights
Estimated NOI and Cap Rate
NOI / Yr
$92,592
Cap Rate
3.04%
Suggested Prices Based on Cap Rates
Cap Rate 5%
$1,851,840
$1.9M
Cap Rate 7%
$1,322,743
$1.3M
Cap Rate 9%
$1,028,800
$1.0M
Market Conditions
NOI Build-Up for 5,302 SF
Gross rent
$143.2K $27.00/SF
− Vacancy
−$10.9K −$2.05/SF
EGI
$132.3K $24.95/SF
− OpEx
−$39.7K −$7.48/SF
NOI
$92.6K $17.46/SF
Area
Los Angeles County, CA
Vacancy
7.60%
Lease Rate
$27.00 /SF/Yr
Expense Ratio
30.00%
Simulate Cap Rate and NOI
Suggested Prices Based on Cap Rates
Cap Rate 5%
$1,851,840
Cap Rate 7%
$1,322,743
Cap Rate 9%
$1,028,800
Alternative Uses
Best Use
Multifamily LT 5
$1.32M
$1.16M – $1.54M
NOI $92,592 @ 7.0% cap · market cap 3.04%
Second Best
Apartment 5plus
$1.22M
$1.07M – $1.42M
NOI $85,313 @ 7.0% cap · market cap 2.80%
Theoretical Best
Office A
$2.84M
$2.48M – $3.31M
NOI $198,707 @ 7.0% cap · market cap 6.53%
Zoning and permitted uses should be independently verified with authorities.
Property Analytics
Unlock full access to Insights
Subscribe to Realmo Intelligence
Open Analytics
Current Use
Lease Details
4
Residential units
Yes
Highway access
Location Intelligence
Trade Area within ½ mile
1,438
Businesses Nearby
Explore this area
Business Placement
Demographics for 90278, CA
42,188
Population
16,628
Households
2.5
Avg Household Size
39
Median Age
62%
College-Educated
96%
High-School Grad
3.7 sq mi
ZIP Area
11,402
Density / Sq Mi
$148,581
Median Household Income
$86,999
Median Earnings
$2,417
Median Rent
$1,195,700
Median Home Value
Check the figures for this property
Cap Rate, Value Estimation, Potential NOI and more
View Realmo Analytics
Market
Vacancy Rate% for Multifamily in West region

Questions? Ask Rey
Realmo’s AI knows this listing — price, zoning, demand, history. Ask anything.




Frequently Asked Questions
What type of property is this?
Quadplex - Updated interiors feature contemporary finishes, stacking laundry units, garages, storage, and EV charging capability.
Where is this quadplex located?
The property is located at 2118 Carnegie Ln Redondo Beach, CA.
What is the asking price?
The asking price for this property is $3,045,000.
What are key features of this property?
This property features: Four‑unit property in Redondo Beach, CA 90278; Unit mix includes 1 four‑bedroom/3‑bathroom unit, 2 two‑bedroom/2‑bathroom units, and 1 two‑bedroom/1‑bathroom unit; Extensively remodeled with vinyl plank flooring, quartz countertops, stainless steel appliances, and updated cabinetry


