Duplex with Private
For Sale
$1,380,000
18527 Grevillea Avenue, Redondo Beach, CA 90278
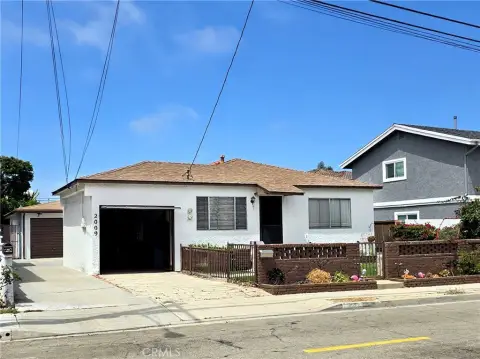
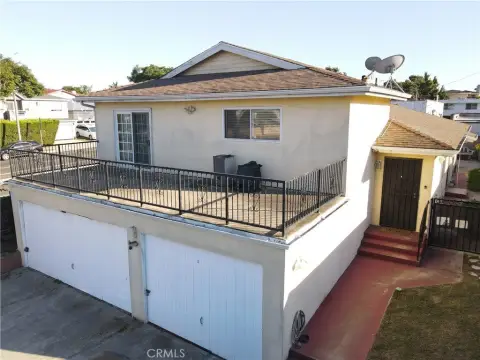
Single-level front and rear residences offer updated interiors, private patios with BBQ space, and three one-car garages.
Property Size6,005 SF
Price / SF$229.81
Days on Market135
Property Features for 18527 Grevillea Avenue
General Information
Standard status
Active
Size
6,005 SF
Total Parking Spaces
6
Property subtype
Residential Income
Zoning
Assessor
Net Operating Income
$56,015
Additional Details
Multifamily Units
2
Building Details
Year Built
1964
Buildings
2
Stories
1
Units
2
Tenancy
Multi
Listing Agency:
South Bay Brokers, Inc
Listed By:
Nick Phillips · License #01742107
(310) 208-9366
Source:
Compass
Added: May 29
Changed: Oct 6
Last Checked: Oct 10 at 12:06AM
Displayed information is deemed reliable but is not guaranteed and should be independently verified. All listing content including descriptions, pricing, images are the copyrighted material of South Bay Brokers, Inc
Investment Insights
Based on property information with market context.
This duplex features a single-level layout with two separate residences, each with its own private outdoor patio with BBQ space. The front home includes 3 bedrooms and 2 bathrooms, with one bedroom converted to an office, plus an open kitchen with granite countertops, stainless steel appliances, and abundant cabinetry. The rear unit offers 4 bedrooms and 2 bathrooms, an upgraded kitchen, and refreshed baths. Both units include generous communal living areas, newer windows, oversized closets, and updated finishes with updated bathrooms, tile, and carpet flooring. Exteriors are painted and include artificial turf, and the property’s privacy is supported by no shared walls other than a connected roofline. Three separate one-car garages provide additional parking and storage.
Located in the El Nido neighborhood along the Redondo Beach/Torrance border, the property is positioned for buyers looking for an owner-occupant or investor-friendly duplex in a highly sought-after area.
With long-term tenants in place, this setup suits an owner-user seeking to live in one residence while renting the other, or an investor looking to lease both units. The combination of maintained, updated interiors and private outdoor space supports a practical, move-in-ready use for a wide range of income-focused buyers and tenant needs.
Located in the El Nido neighborhood along the Redondo Beach/Torrance border, the property is positioned for buyers looking for an owner-occupant or investor-friendly duplex in a highly sought-after area.
With long-term tenants in place, this setup suits an owner-user seeking to live in one residence while renting the other, or an investor looking to lease both units. The combination of maintained, updated interiors and private outdoor space supports a practical, move-in-ready use for a wide range of income-focused buyers and tenant needs.
Key Highlights
- Duplex with front 3BR/2BA and rear 4BR/2BA, both on a single‑level layout
- Updated interiors in both units with newer windows, oversized closets, tile and carpet flooring
- Front unit features a large open kitchen with granite countertops, stainless steel appliances, and abundant cabinetry
Financial Insights
Estimated NOI and Cap Rate
NOI / Yr
$104,869
Cap Rate
7.60%
Suggested Prices Based on Cap Rates
Cap Rate 5%
$2,097,380
$2.1M
Cap Rate 7%
$1,498,129
$1.5M
Cap Rate 9%
$1,165,211
$1.2M
Market Conditions
NOI Build-Up for 6,005 SF
Gross rent
$162.1K $27.00/SF
− Vacancy
−$12.3K −$2.05/SF
EGI
$149.8K $24.95/SF
− OpEx
−$44.9K −$7.48/SF
NOI
$104.9K $17.46/SF
Area
Los Angeles County, CA
Vacancy
7.60%
Lease Rate
$27.00 /SF/Yr
Expense Ratio
30.00%
Simulate Cap Rate and NOI
Suggested Prices Based on Cap Rates
Cap Rate 5%
$2,097,380
Cap Rate 7%
$1,498,129
Cap Rate 9%
$1,165,211
Alternative Uses
Best Use
Multifamily LT 5
$1.50M
$1.31M – $1.75M
NOI $104,869 @ 7.0% cap · market cap 7.60%
Second Best
Apartment 5plus
$1.38M
$1.21M – $1.61M
NOI $96,625 @ 7.0% cap · market cap 7.00%
Theoretical Best
Office A
$3.22M
$2.81M – $3.75M
NOI $225,054 @ 7.0% cap · market cap 16.31%
Zoning and permitted uses should be independently verified with authorities.
Property Analytics
Unlock full access to Insights
Subscribe to Realmo Intelligence
Open Analytics
Current Use
Lease Details
2
Residential units
Multi-tenant
Tenancy
Location Intelligence
Trade Area within ½ mile
937
Businesses Nearby
Explore this area
Business Placement
Demographics for 90278, CA
42,188
Population
16,628
Households
2.5
Avg Household Size
39
Median Age
62%
College-Educated
96%
High-School Grad
3.7 sq mi
ZIP Area
11,402
Density / Sq Mi
$148,581
Median Household Income
$86,999
Median Earnings
$2,417
Median Rent
$1,195,700
Median Home Value
Check the figures for this property
Cap Rate, Value Estimation, Potential NOI and more
View Realmo Analytics
Market
Vacancy Rate% for Multifamily in West region

Questions? Ask Rey
Realmo’s AI knows this listing — price, zoning, demand, history. Ask anything.



Frequently Asked Questions
What type of property is this?
Duplex - Single-level front and rear residences offer updated interiors, private patios with BBQ space, and three one-car garages.
Where is this duplex located?
The property is located at 18527 Grevillea Avenue Redondo Beach, CA.
What is the asking price?
The asking price for this property is $1,380,000.
What are key features of this property?
This property features: Duplex with front 3BR/2BA and rear 4BR/2BA, both on a single‑level layout; Updated interiors in both units with newer windows, oversized closets, tile and carpet flooring; Front unit features a large open kitchen with granite countertops, stainless steel appliances, and abundant cabinetry


