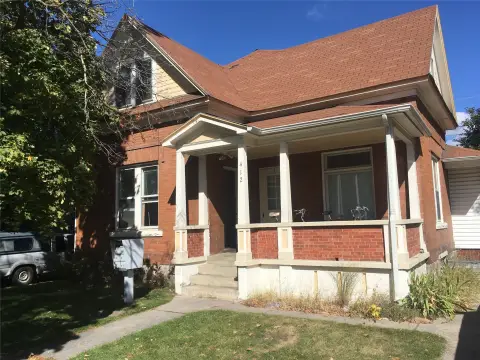
Mixed-Use Property With Wellness
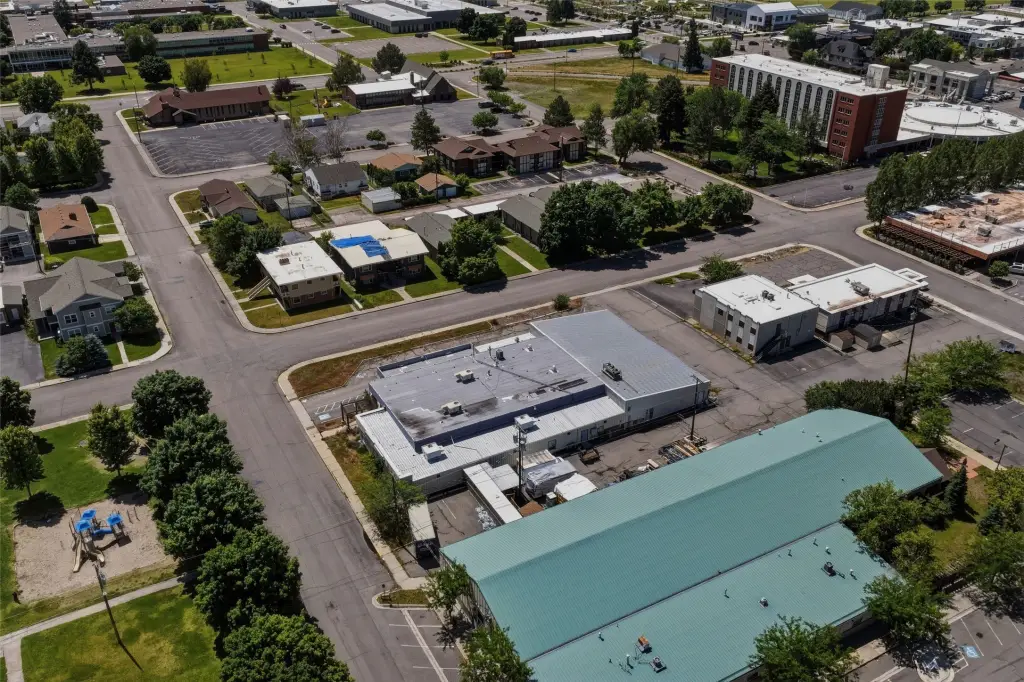
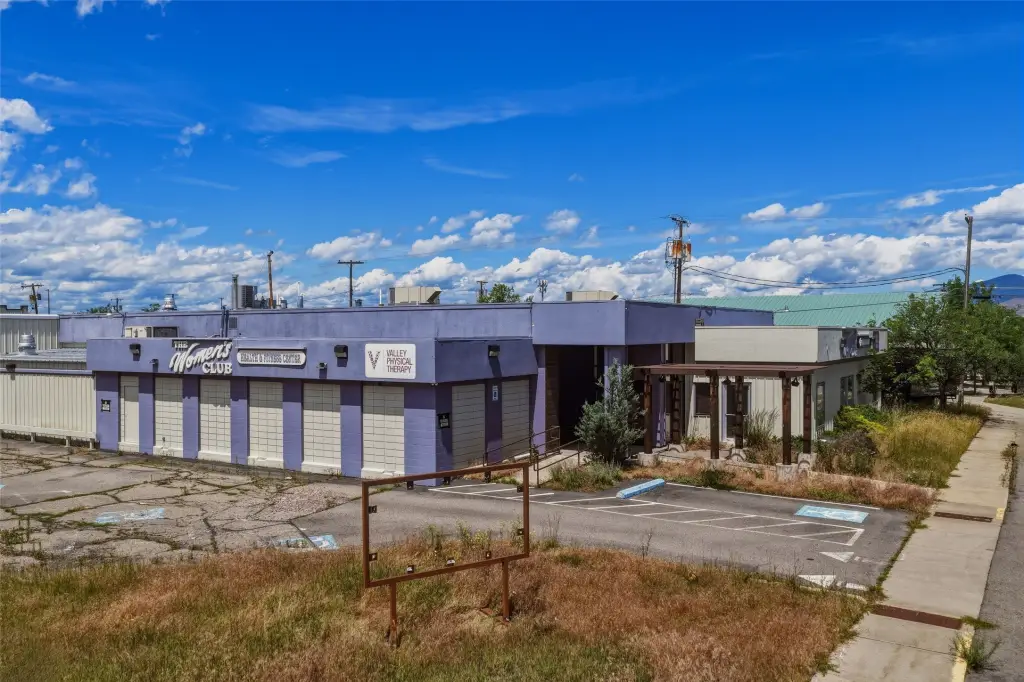
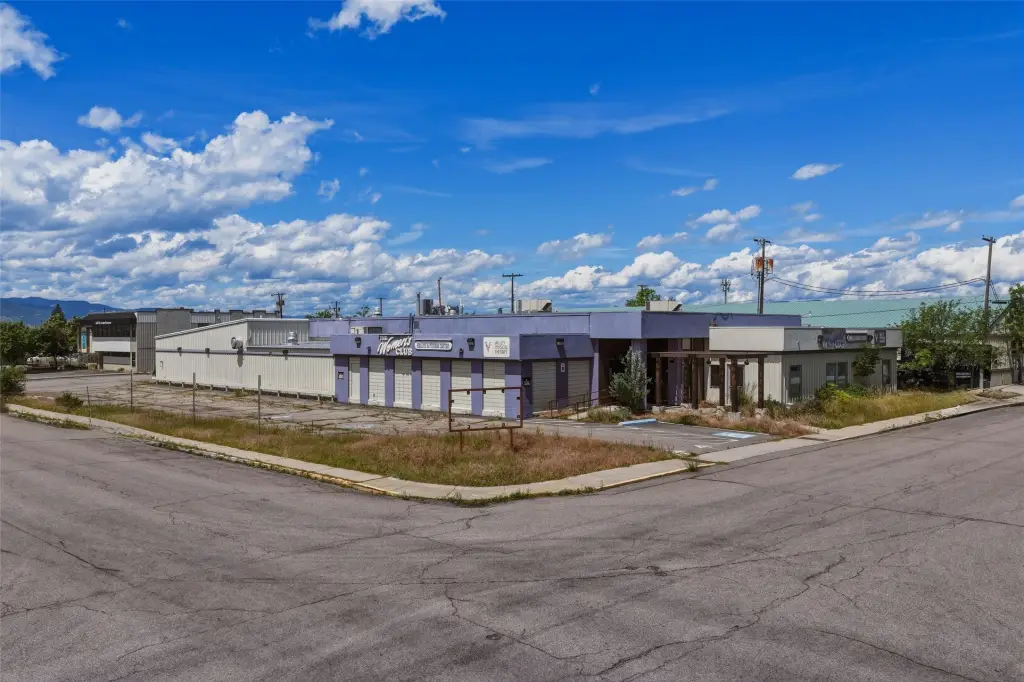
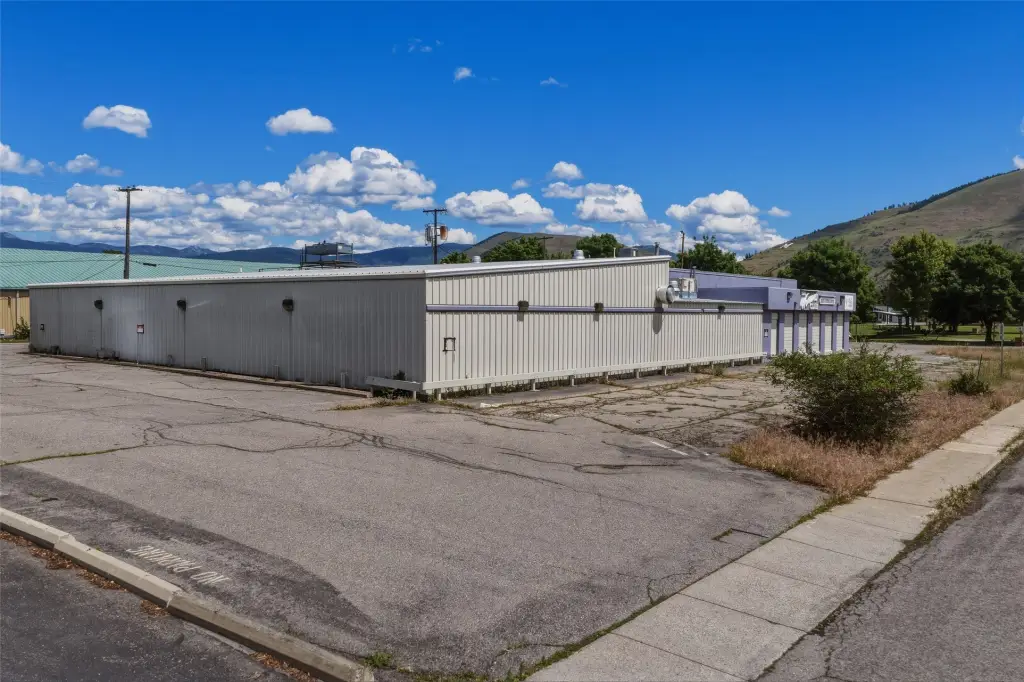
For Sale
$1,560,000
2105 Bow Street, Missoula, MT 59801
CommercialSale, Missoula, MT
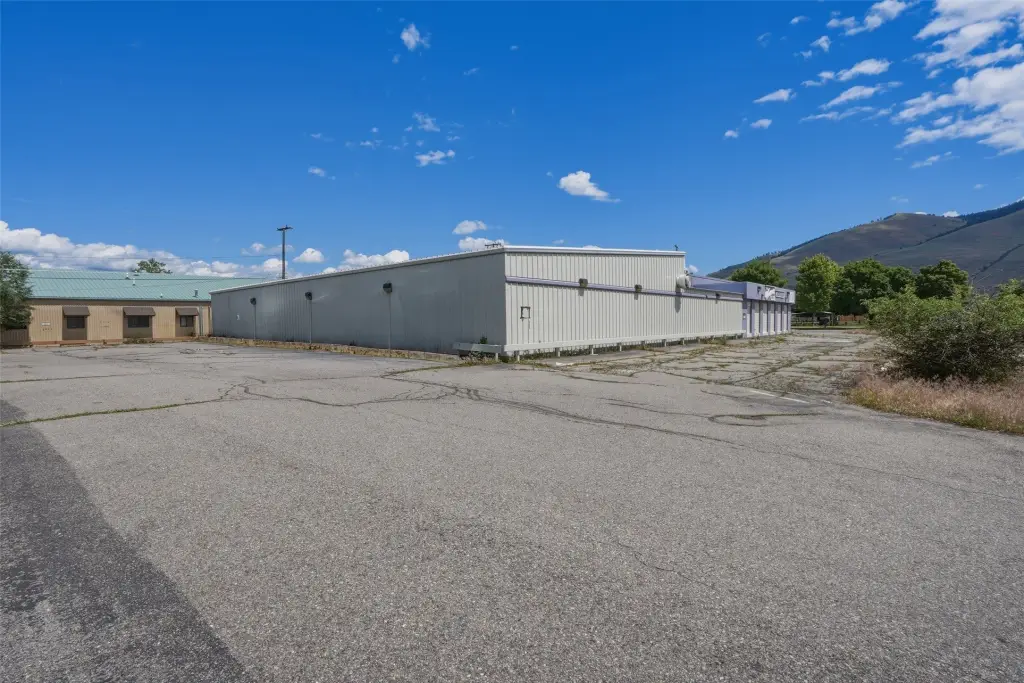
Property Size14,000 SF
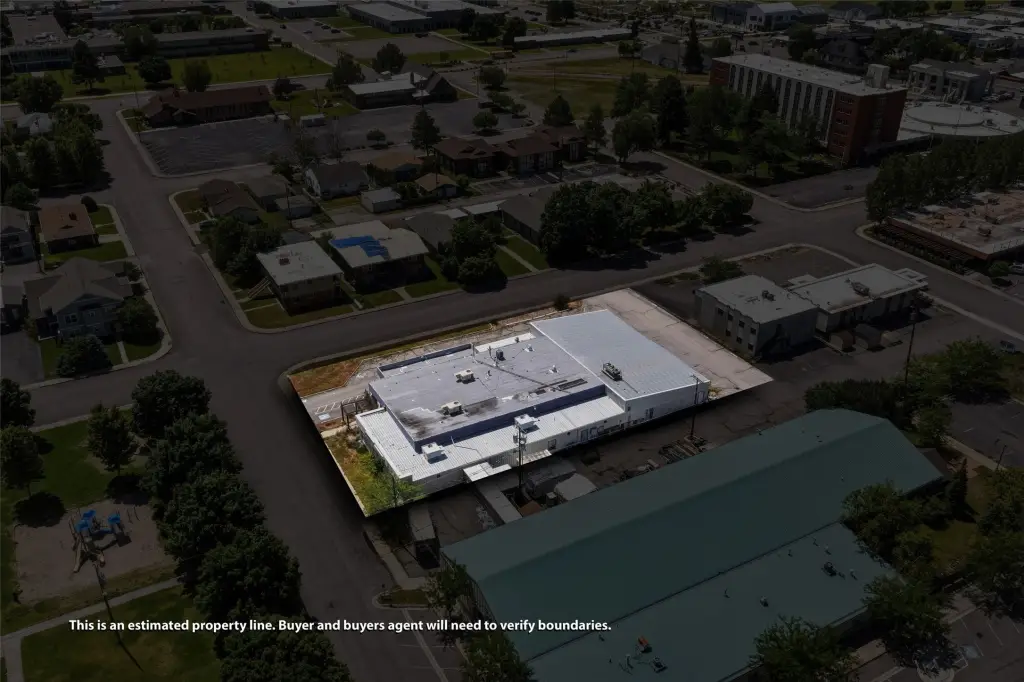
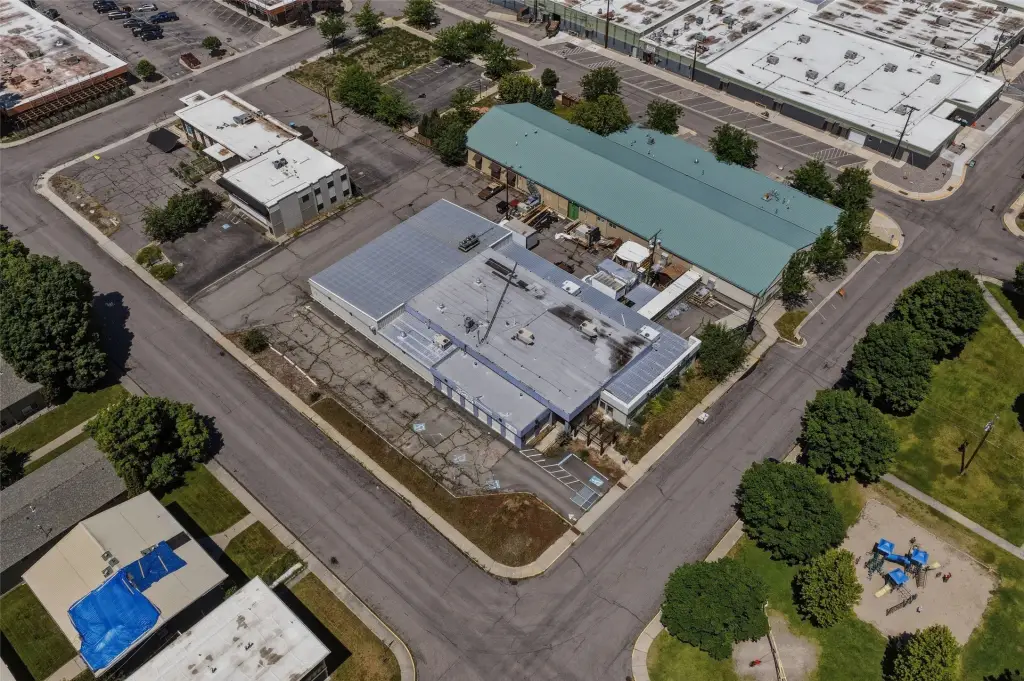
Lot Size0.67 Acres
Price / SF$111.43
Days on Market99
Property Features for 2105 Bow Street
General Information
Property type
Commercial Sale
Property subtype
Other
Zoning description
6
Rooms
Basement
Parking
28
Parking features
Alley
Security features
Security
Spa
1
Interior features
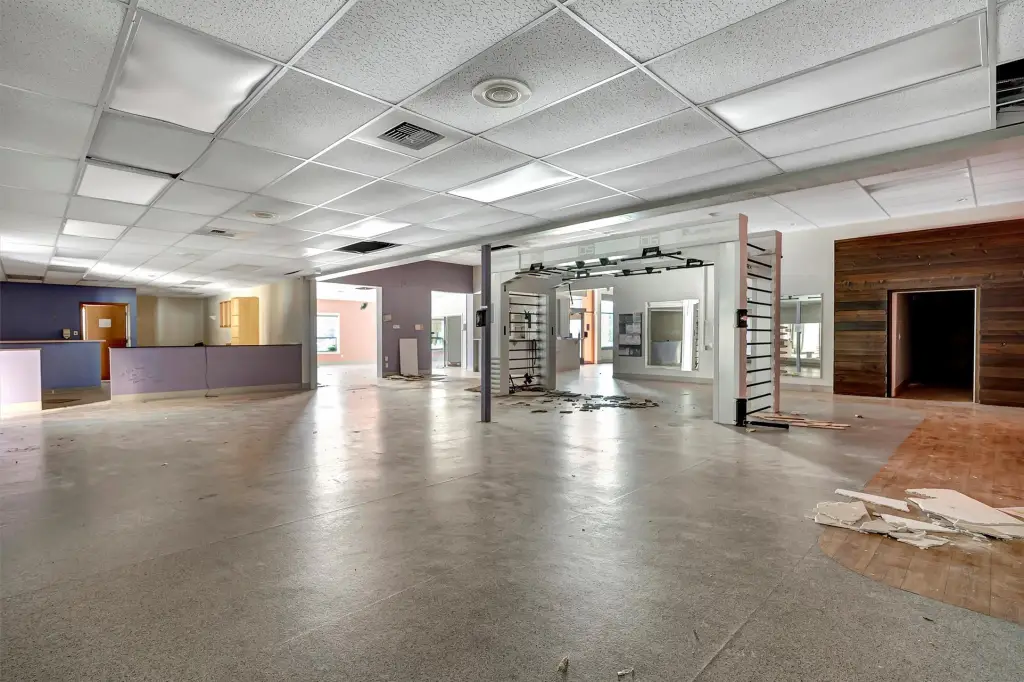
HotTubSpa, OpenFloorplan, Sauna, VaultedCeilings
Exterior features
RainGutters, Storage
Lot features
Split Possible, Level
Directions
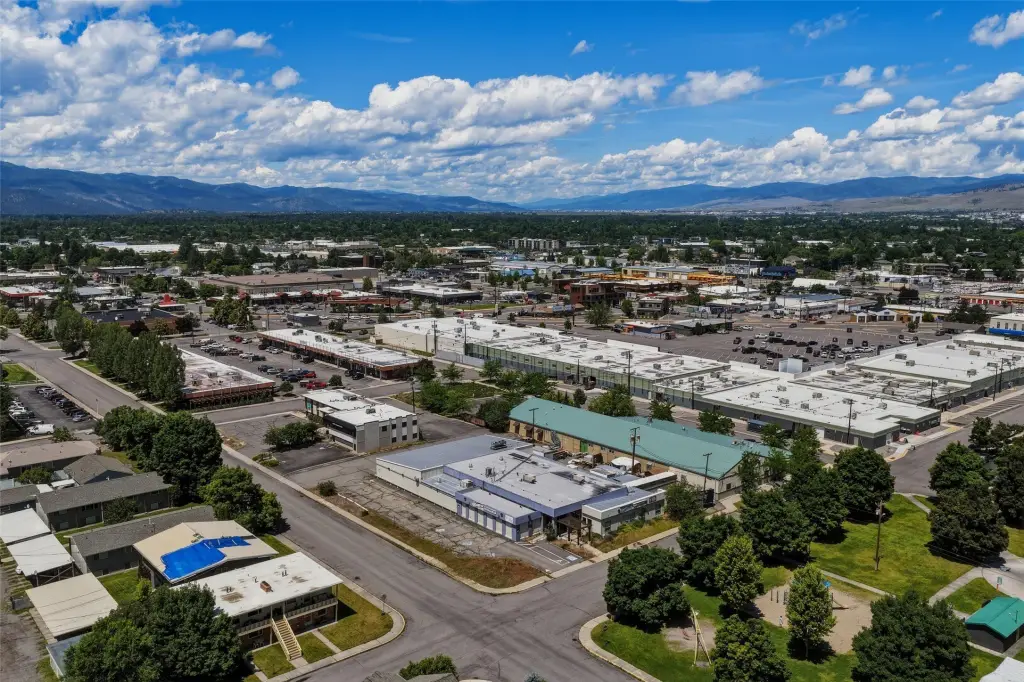
From the intersection of Brooks Street & Stephens Avenue, head southeast on Stephens Avenue (away from Brooks). Bow Street is the next street branching off to your left; turn onto it and 2105 Bow St will be right there on the south side. The whole trip is under a quarter mile - likely under a minute by car, or about a 3-4 minute walk.
Standard status
Active
APN
04220028318030000
Lot size
0.67 Acres
Taxes and HOA fees
Tax Year
2025
Tax Description
HOMEVALE ADDITION, S28, T13 N, R19 W, E 220' S1/2 OF BLK 16 PT VAC ALLEY PARCEL DESCRIBED IN COS 6878
Tax Annual Amount
48762
Legal Description
HOMEVALE ADDITION, S28, T13 N, R19 W, E 220' S1/2 OF BLK 16 PT VAC ALLEY PARCEL DESCRIBED IN COS 6878
Utilities
Sewer type
Public Sewer
Heating system
Forced Air, Zoned, Hot Water(Heating), Natural Gas
Cooling system
Central Air
Water source
Public
Amenities
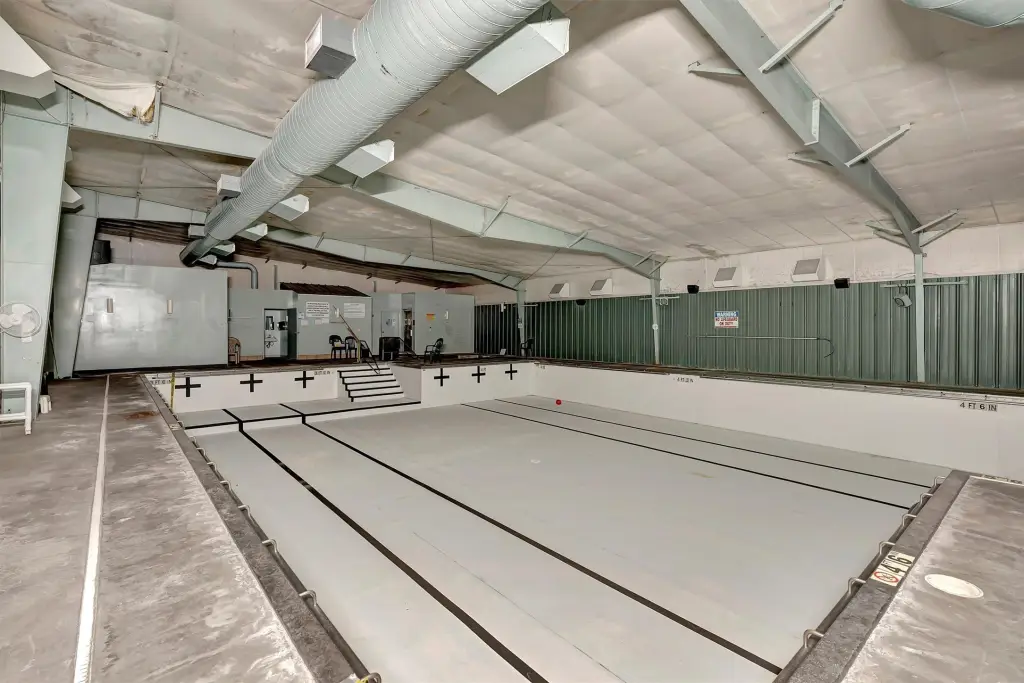
saltwater pool
hot tub
sauna
Building Details
Year built
1983
Building materials
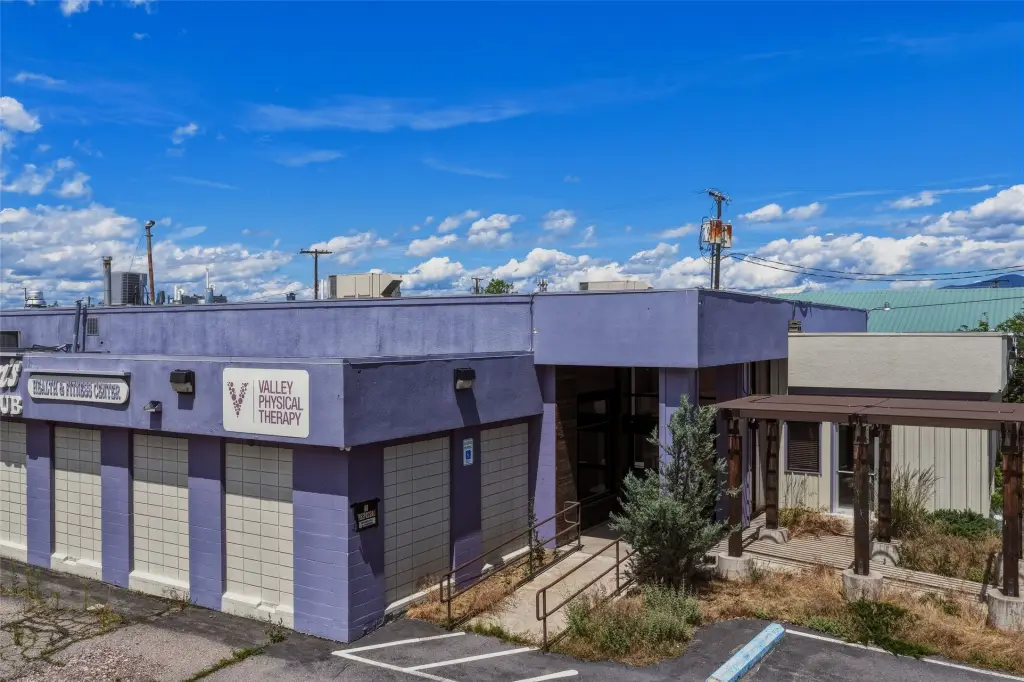
Brick, MetalFrame, MetalSiding
Roof type
Metal, Rubber
Additional Structures
Storage
Listing Agency:
Glacier Sotheby's International Realty Missoula
(406) 541-7020
Listed By:
Patrick Pozzi · License #RRE-RBS-LIC-98048
(406) 240-6767
Added: Jun 29
Changed: Oct 4
Last Checked: Oct 5 at 1:06PM
MLS# 30073978
Copyright © 2026 Montana Regional MLS. All rights reserved. All information provided by the listing agent/broker is deemed reliable but is not guaranteed and should be independently verified.
Investment Insights
Based on property information with market context.
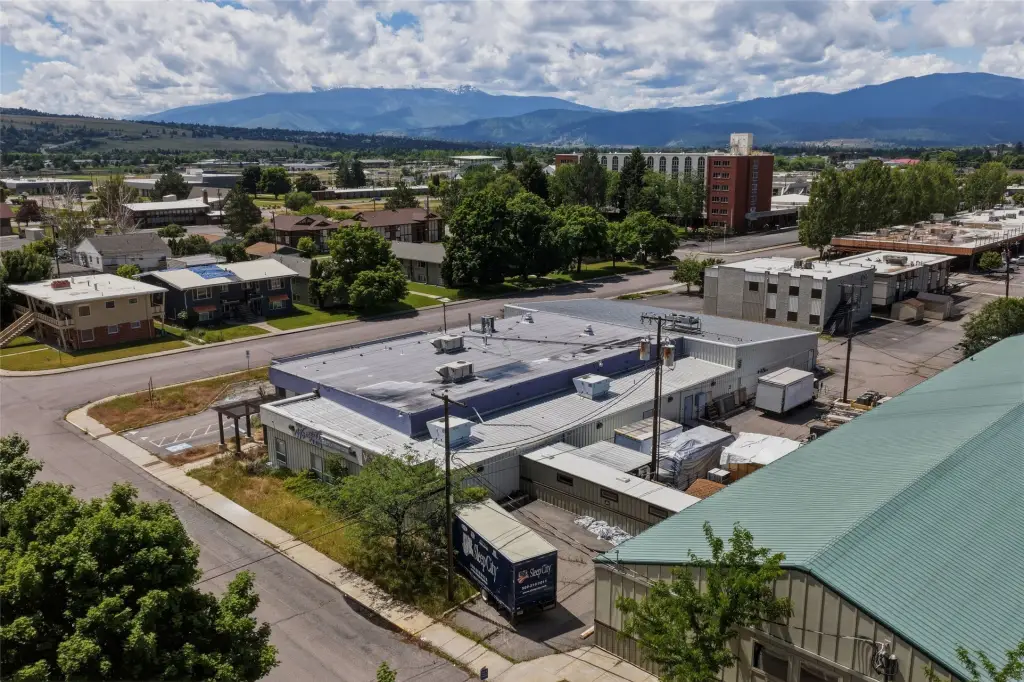
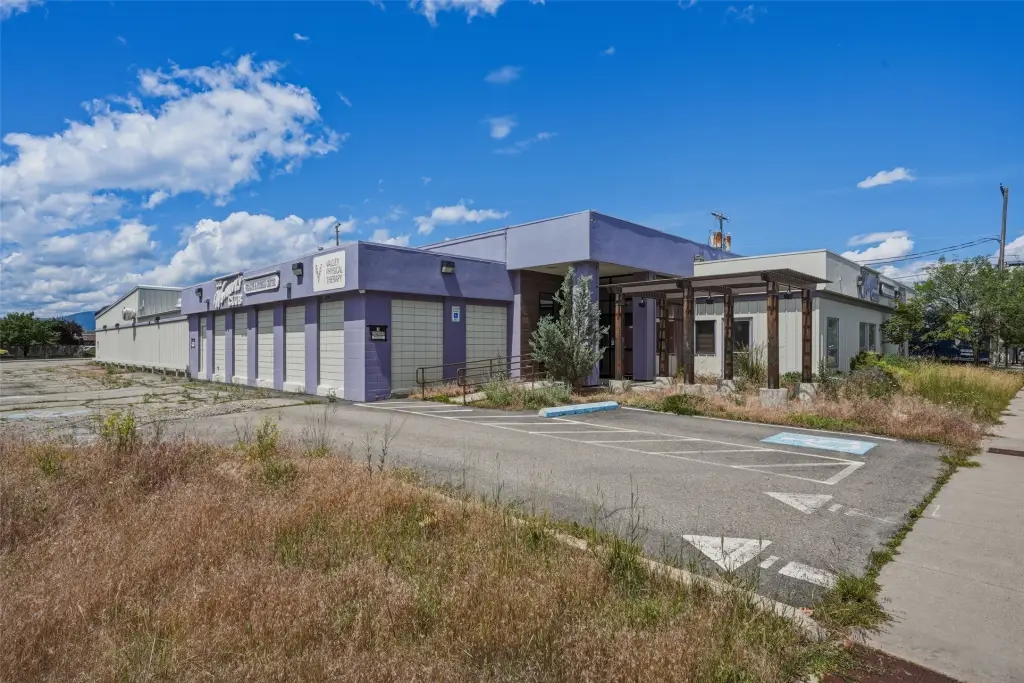
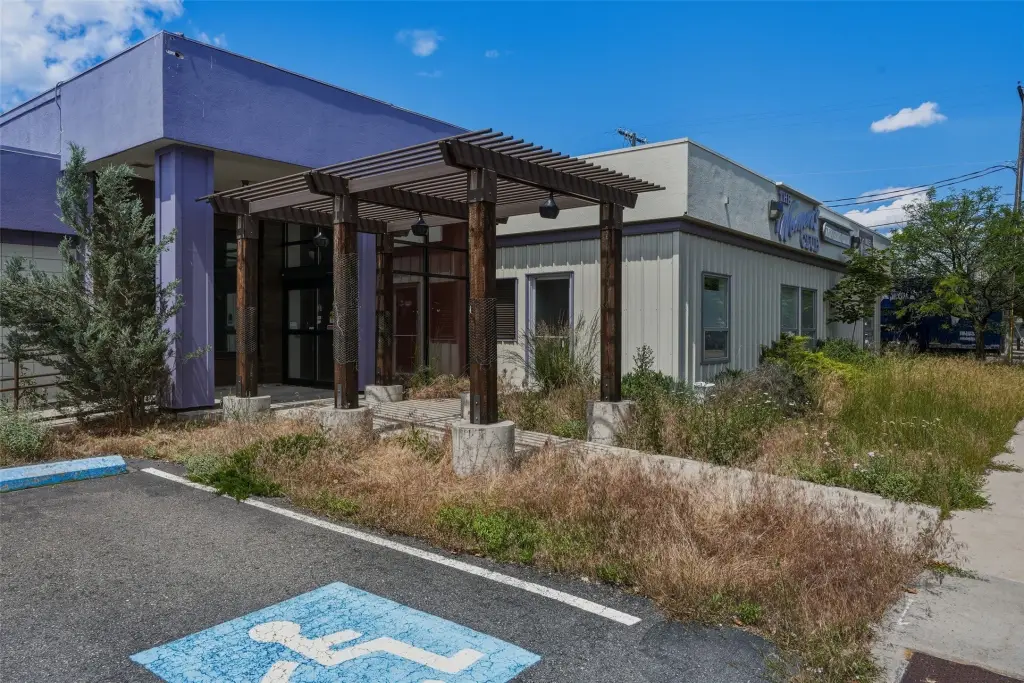
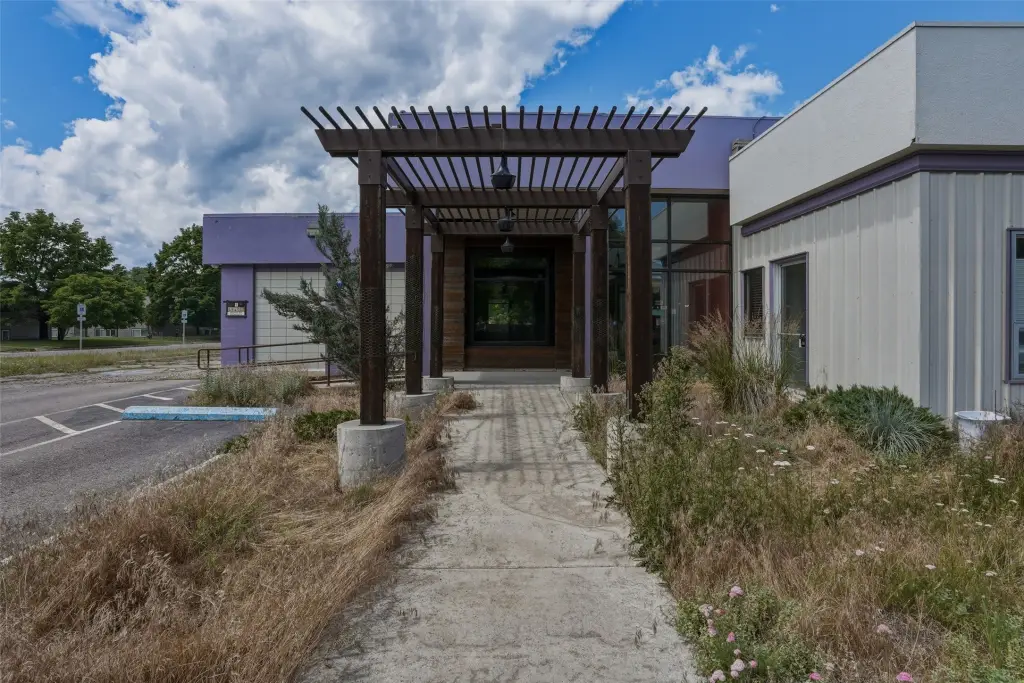
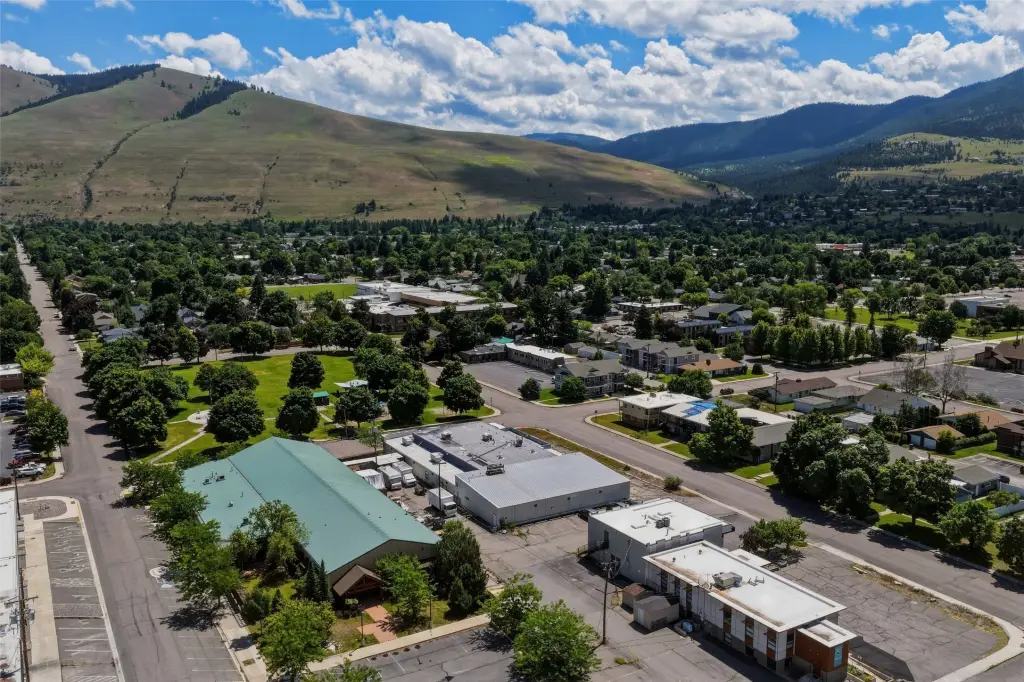
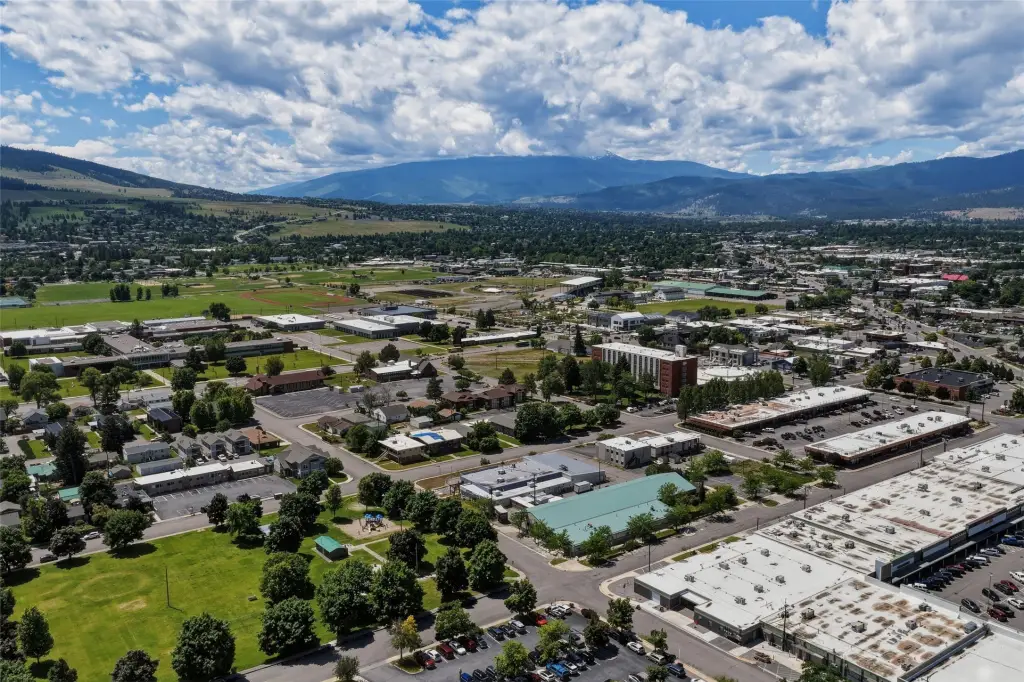
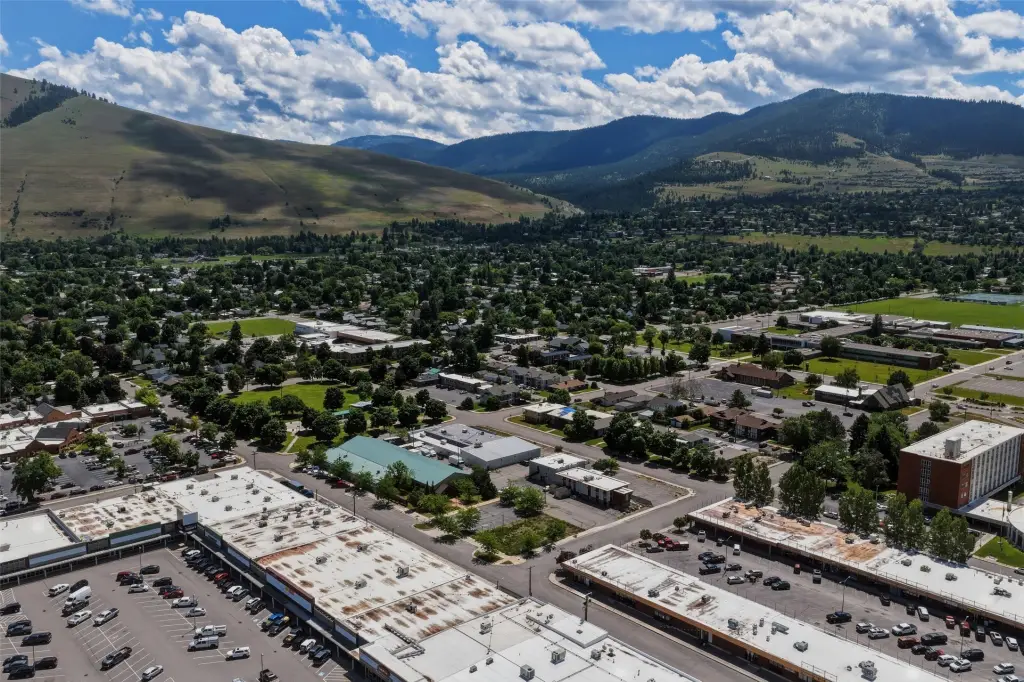
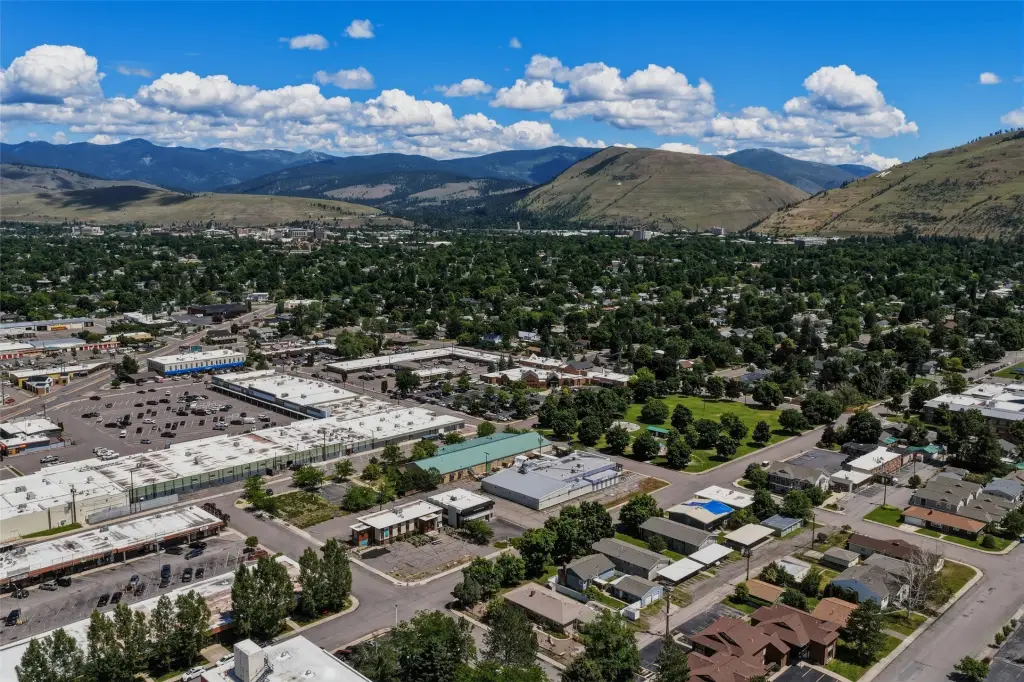
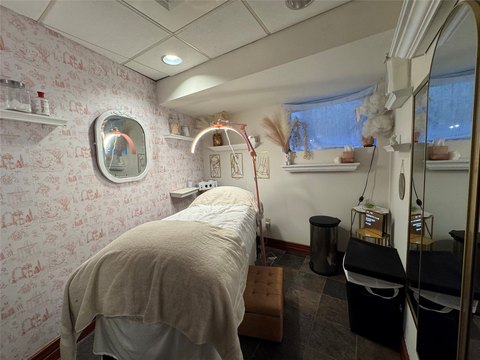
Located at 2105 Bow Street in Missoula, this mixed-use property occupies a 0.665-acre parcel and was built in 1983. The building combines brick, metal frame, and metal siding construction with an open floorplan, vaulted ceilings, basement storage, and dedicated wellness improvements including a saltwater pool, hot tub, and sauna. Central air conditioning and zoned natural-gas heating support the interior, while public water and public sewer serve the property.
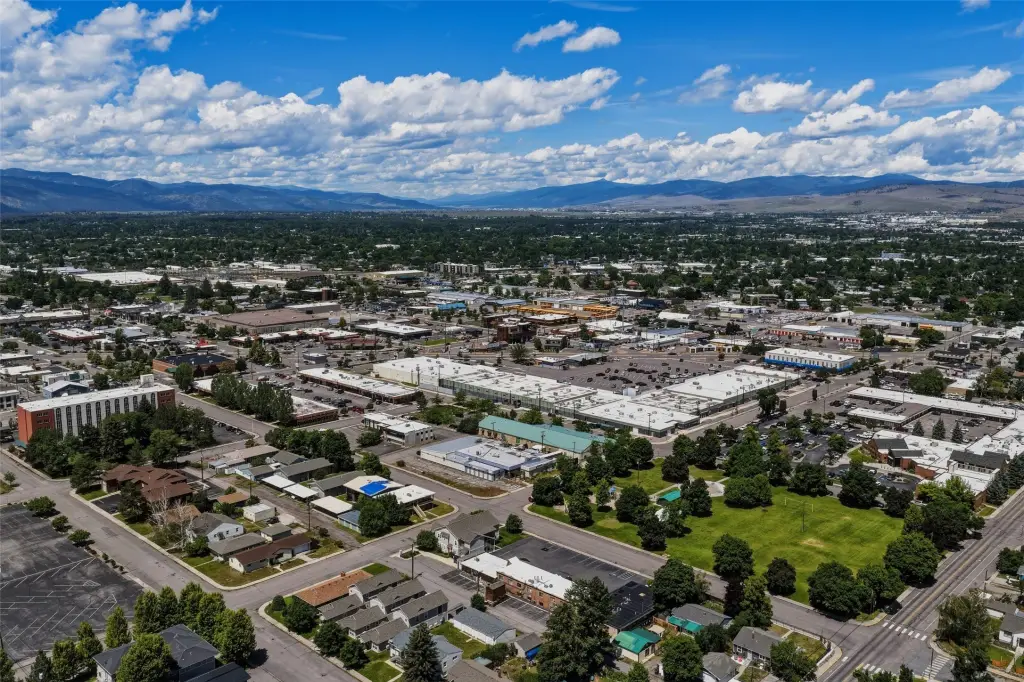
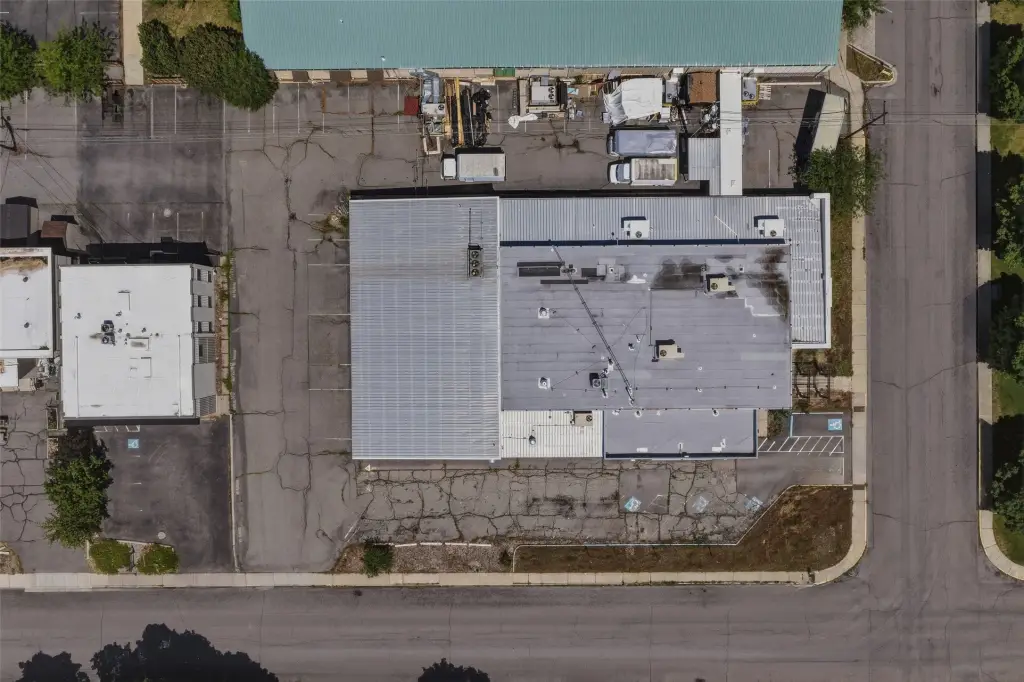
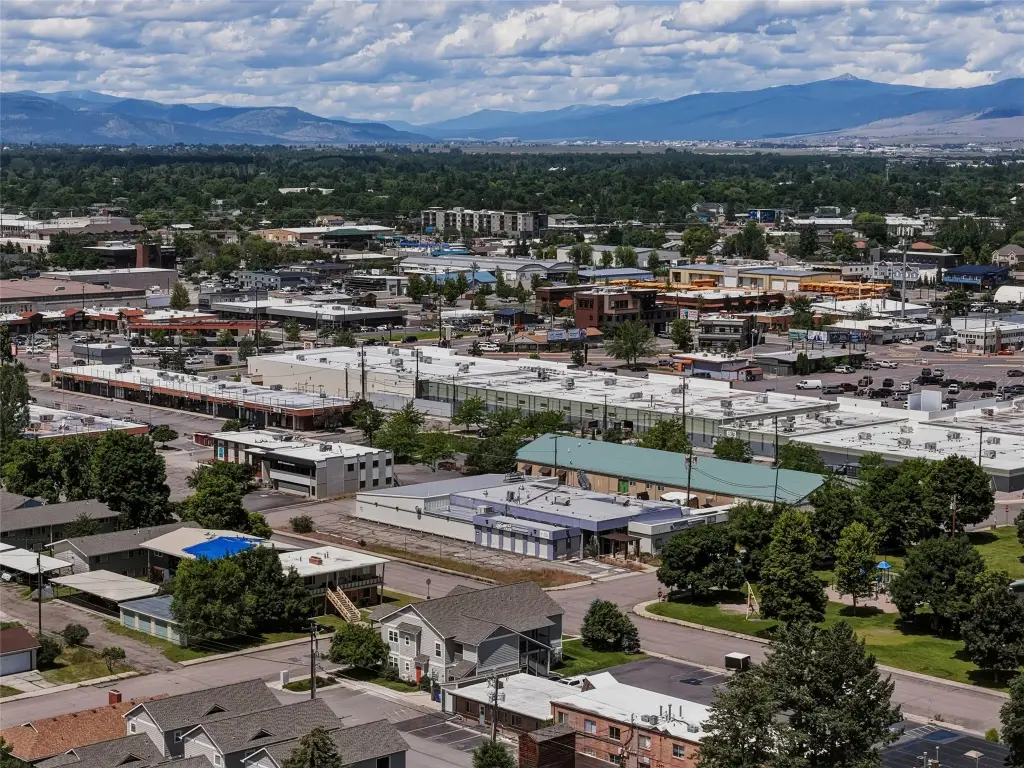
The site includes 25 dedicated parking spaces and alley access. Rubber and metal roofing, rain gutters, and additional storage are also part of the improvements. The property carries GREAT zoning and sits near the Brooks and Stephens junction in Missoula's midtown corridor.
The site includes 25 dedicated parking spaces and alley access. Rubber and metal roofing, rain gutters, and additional storage are also part of the improvements. The property carries GREAT zoning and sits near the Brooks and Stephens junction in Missoula's midtown corridor.
Key Highlights
- 0.665‑acre mixed‑use property at 2105 Bow Street in Missoula
- Approximately 14,000 square feet of flexible interior space
- Saltwater pool, hot tub, and sauna included
Financial Insights
Estimated NOI and Cap Rate
NOI / Yr
$98,700
Cap Rate
6.33%
Suggested Prices Based on Cap Rates
Cap Rate 5%
$1,974,000
$2.0M
Cap Rate 7%
$1,410,000
$1.4M
Cap Rate 9%
$1,096,667
$1.1M
Market Conditions
NOI Build-Up for 14,000 SF
Gross rent
$168.0K $12.00/SF
− Vacancy
−$10.1K −$0.72/SF
EGI
$157.9K $11.28/SF
− OpEx
−$59.2K −$4.23/SF
NOI
$98.7K $7.05/SF
Area
Missoula County, MT
Vacancy
6.00%
Lease Rate
$12.00 /SF/Yr
Expense Ratio
37.50%
Simulate Cap Rate and NOI
Suggested Prices Based on Cap Rates
Cap Rate 5%
$1,974,000
Cap Rate 7%
$1,410,000
Cap Rate 9%
$1,096,667
Alternative Uses
Best Use
Mixed Use
$1.41M
$1.23M – $1.65M
NOI $98,700 @ 7.0% cap · market cap 6.33%
Second Best
—
—
no second resolved use
Theoretical Best
Specialty Retail
$4.04M
$3.53M – $4.71M
NOI $282,555 @ 7.0% cap · market cap 18.11%
Zoning and permitted uses should be independently verified with authorities.
Property Analytics
Unlock full access to Insights
Subscribe to Realmo Intelligence
Open Analytics
Current Use
Location Intelligence
Trade Area within ½ mile
1,392
Businesses Nearby
Explore this area
Business Placement
Demographics for 59801, MT
30,629
Population
15,814
Households
1.9
Avg Household Size
34
Median Age
51%
College-Educated
97%
High-School Grad
7.7 sq mi
ZIP Area
3,978
Density / Sq Mi
$55,022
Median Household Income
$34,320
Median Earnings
$1,086
Median Rent
$393,400
Median Home Value
Check the figures for this property
Cap Rate, Value Estimation, Potential NOI and more
View Realmo Analytics

Questions? Ask Rey
Realmo’s AI knows this listing — price, zoning, demand, history. Ask anything.





Frequently Asked Questions
What type of property is this?
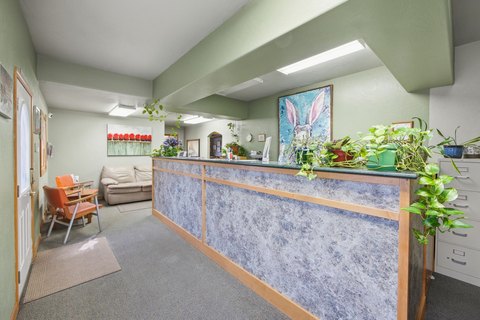
Mixed-use property - Flexible commercial building with a saltwater pool, hot tub, sauna, and 25 dedicated parking spaces.
Where is this mixed-use property located?
The property is located at 2105 Bow Street Missoula, MT.
What is the asking price?
The asking price for this property is $1,560,000.
What are key features of this property?
This property features: 0.665‑acre mixed‑use property at 2105 Bow Street in Missoula; Approximately 14,000 square feet of flexible interior space; Saltwater pool, hot tub, and sauna included


