Flex Space with Office
For Sale
$219,000
2103 WASHINGTON STREET, Monroe, LA 71201
COMMERCIAL/INDUSTRIAL, Monroe, LA
Property Size3,584 SF
Lot Size0.42 Acres
Price / SF$61.10
Days on Market51
Property Features for 2103 WASHINGTON STREET
General Information
Property type
Residential
Property subtype
Office
Zoning description
B-3
Rooms
Office
Security features
Security Lighting, Security System
Interior features
Extra Storage, Private Bathrooms, Showroom, Security System-Wired
Exterior features
Gutters, Landscaping, Lighting/Security
Lot features
Loc. in City Limits
Directions
Head West on Louisville Ave/Hwy 80, Left on Washington St. Property will be on the Right.
Subdivision
111 Central Monroe & Business District
Standard status
Active
APN
71771
Lot size
0.42 Acres
Taxes and HOA fees
Tax Description
LOT B RESUB LOT 7-D-1 REDEVELOPMENT AGENCY RESUB
Legal Description
LOT B RESUB LOT 7-D-1 REDEVELOPMENT AGENCY RESUB
Utilities
Heating system
Electric (Heating), Central
Cooling system
Electric, Central Air
Building Details
Building materials
Concrete Block
Roof type
Composition
Additional Structures
Storage
Listing Agency:
John Rea Realty
(318) 388-0941
Listed By:
Jennifer Causey · License #LA995693195
(318) 261-0892
Added: Aug 18
Changed: Sep 12
Last Checked: Oct 7 at 2:06PM
MLS# 220544
Copyright © 2026 Northeast Louisiana Association of REALTORS. All rights reserved. All information provided by the listing agent/broker is deemed reliable but is not guaranteed and should be independently verified.
Investment Insights
Based on property information with market context.
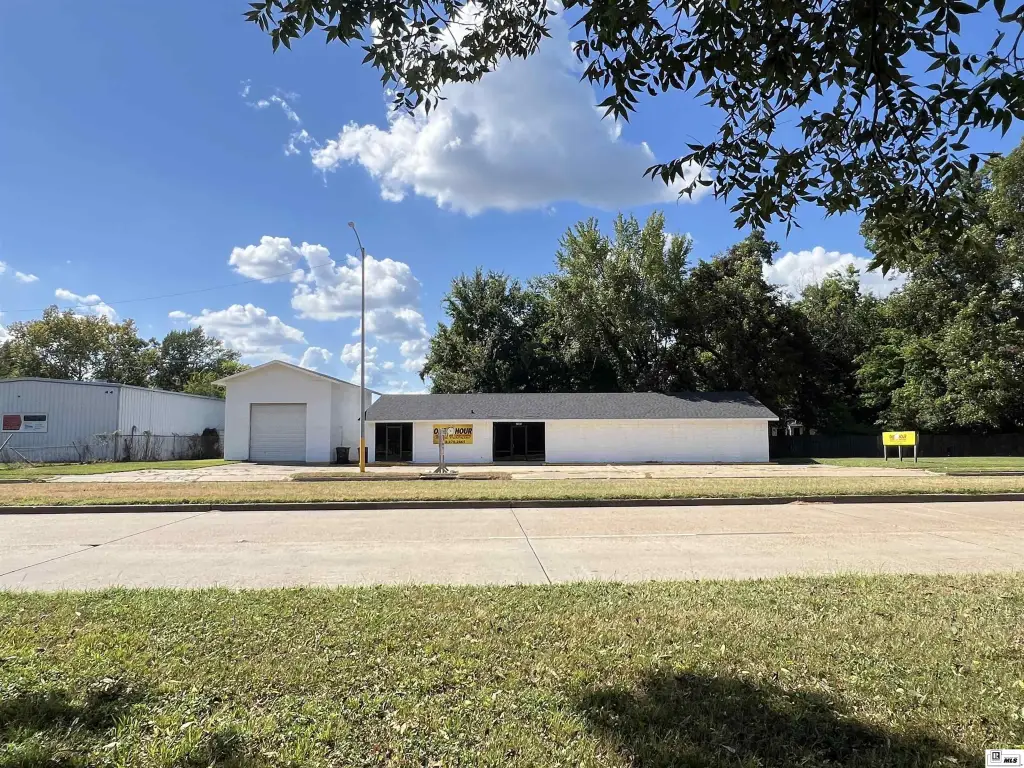
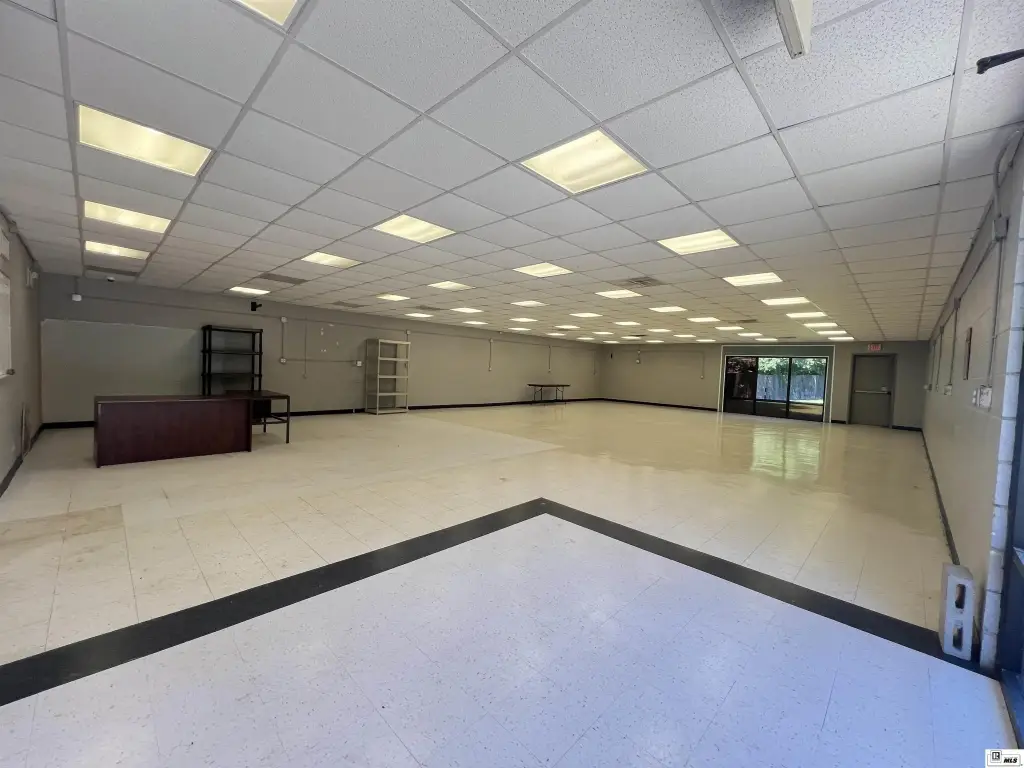
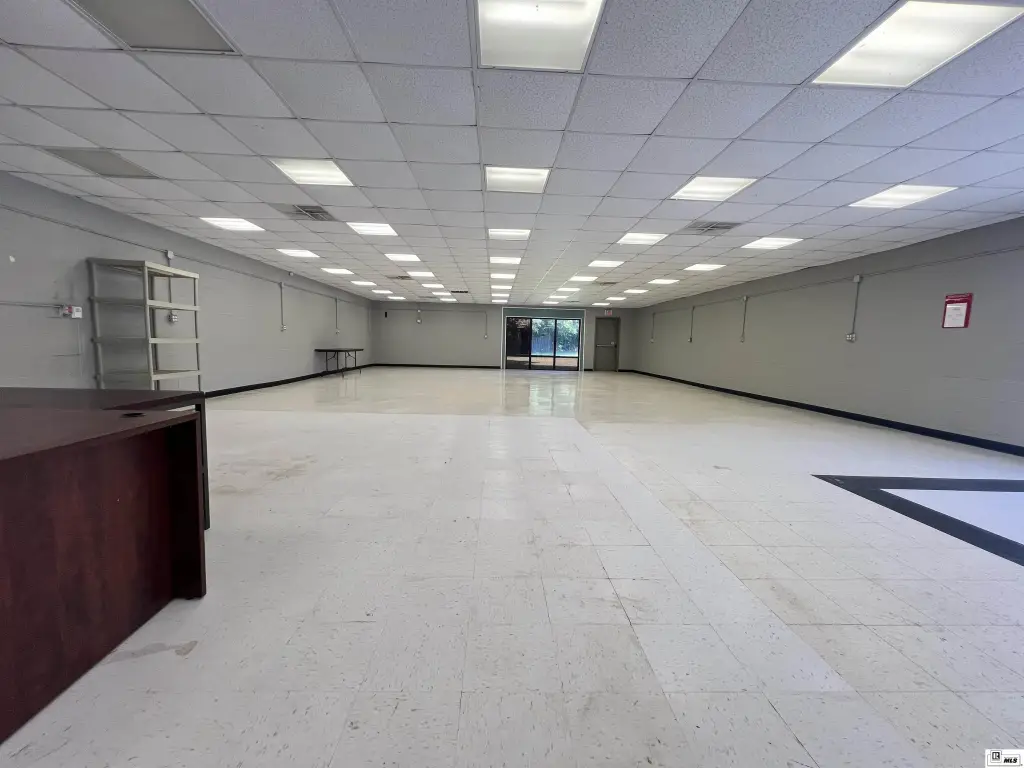
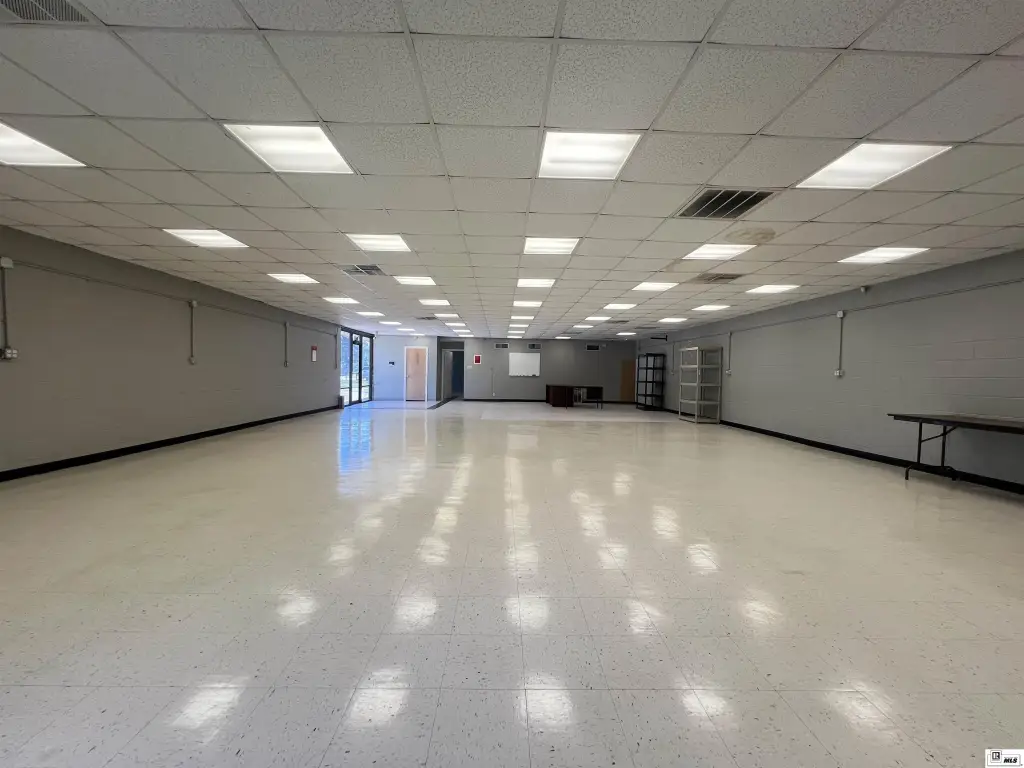
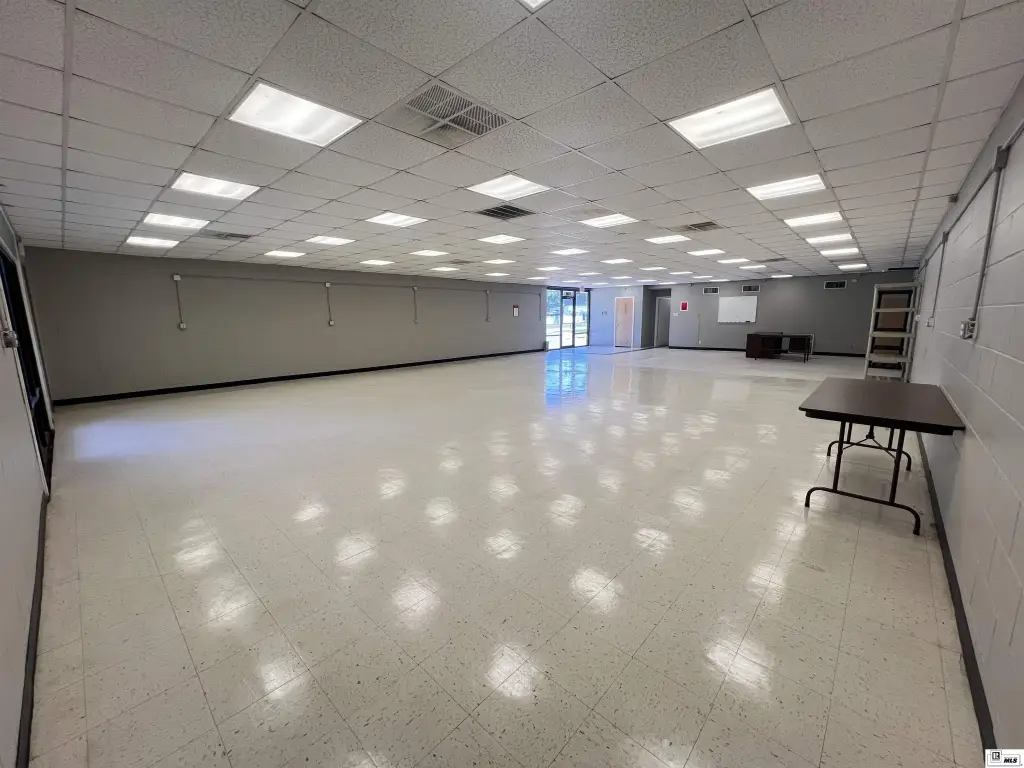
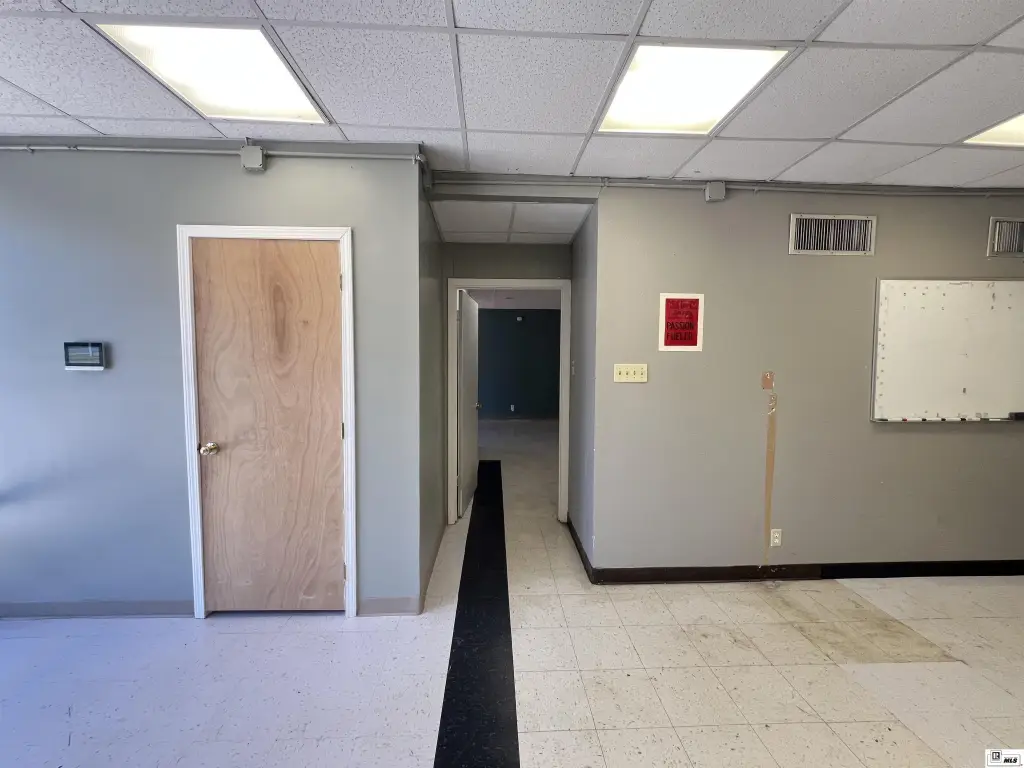
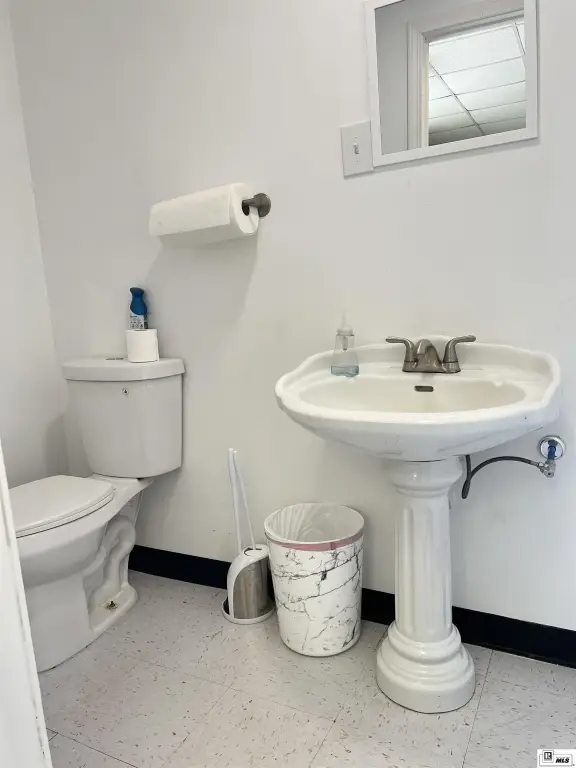
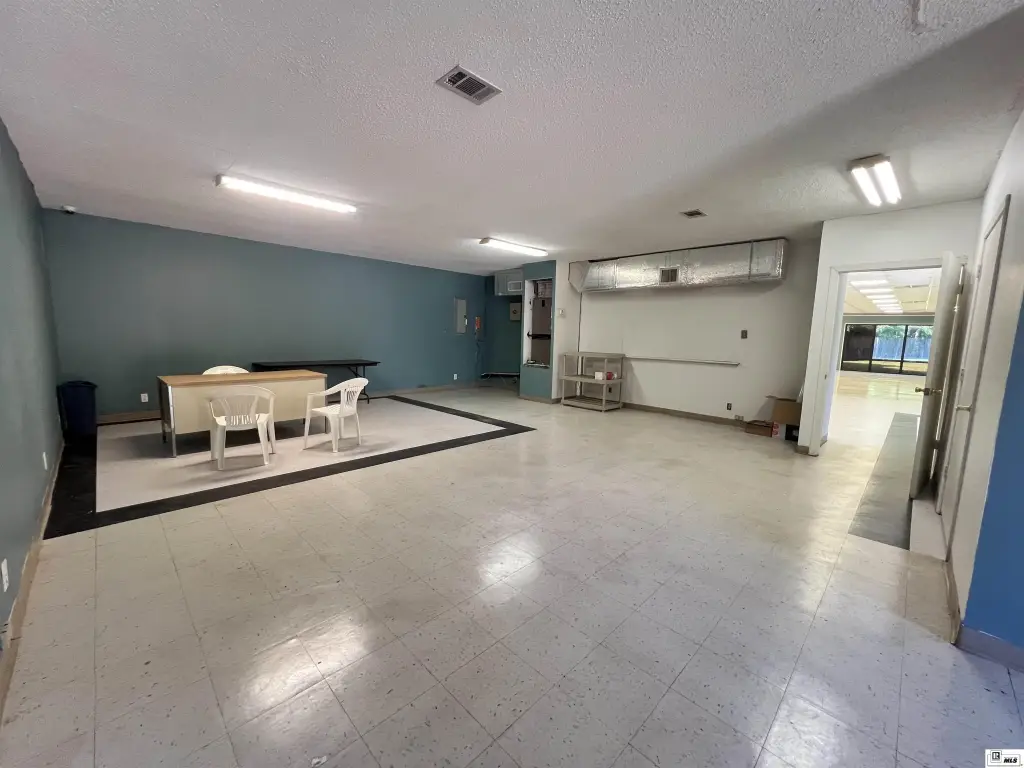
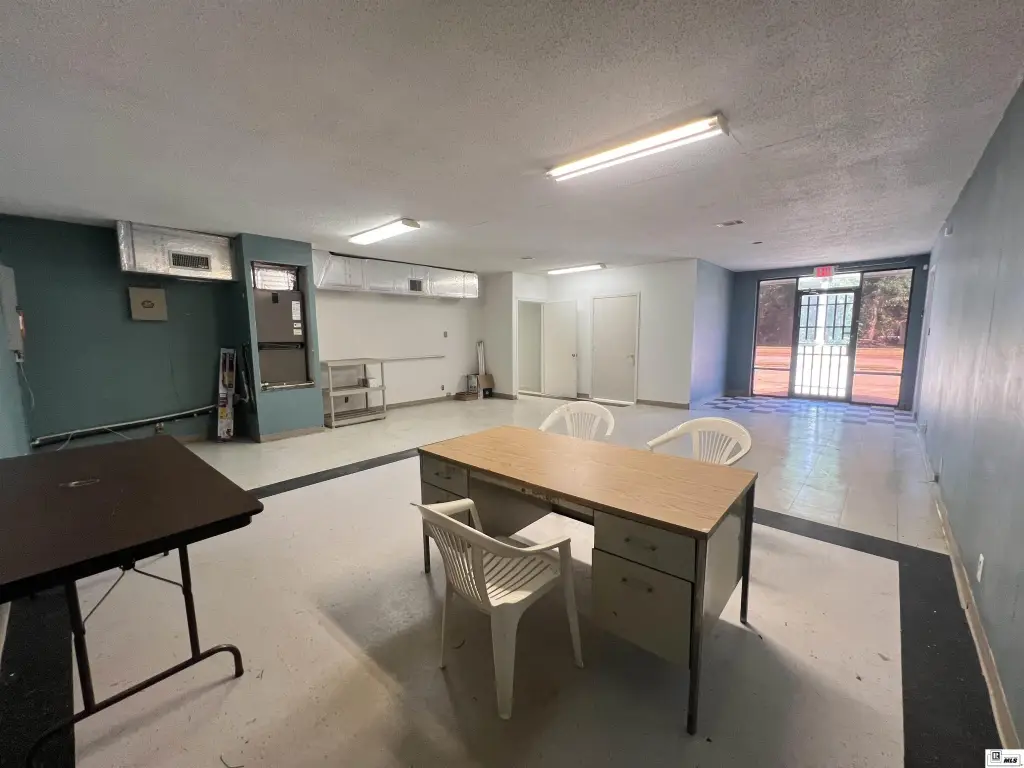
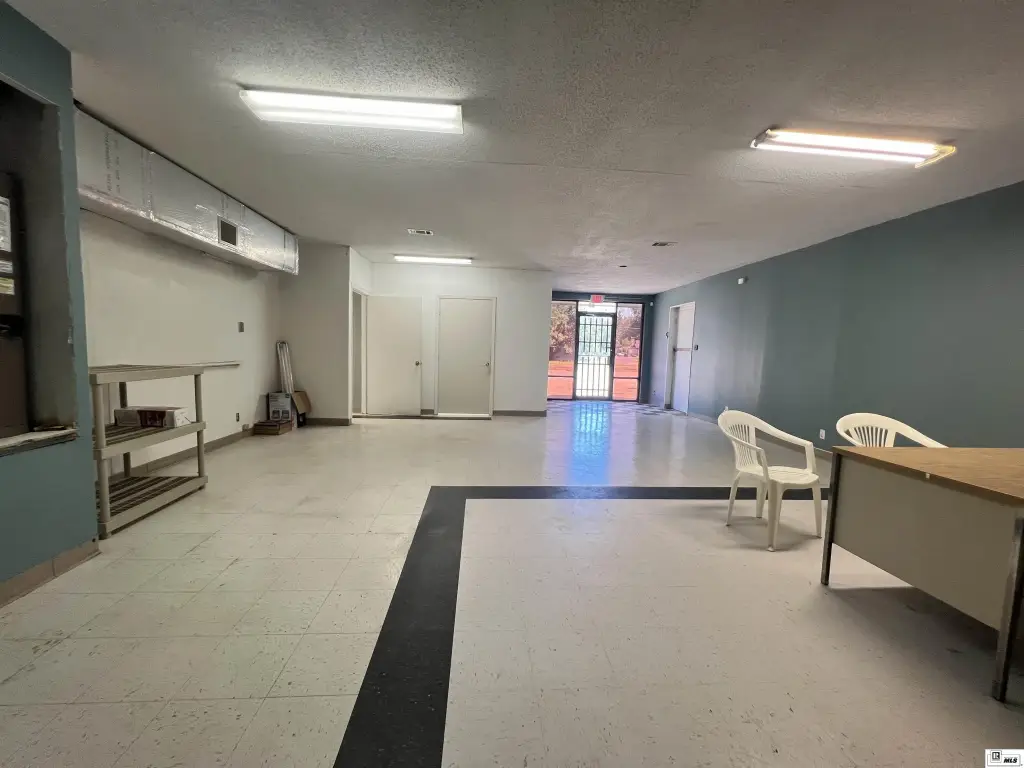
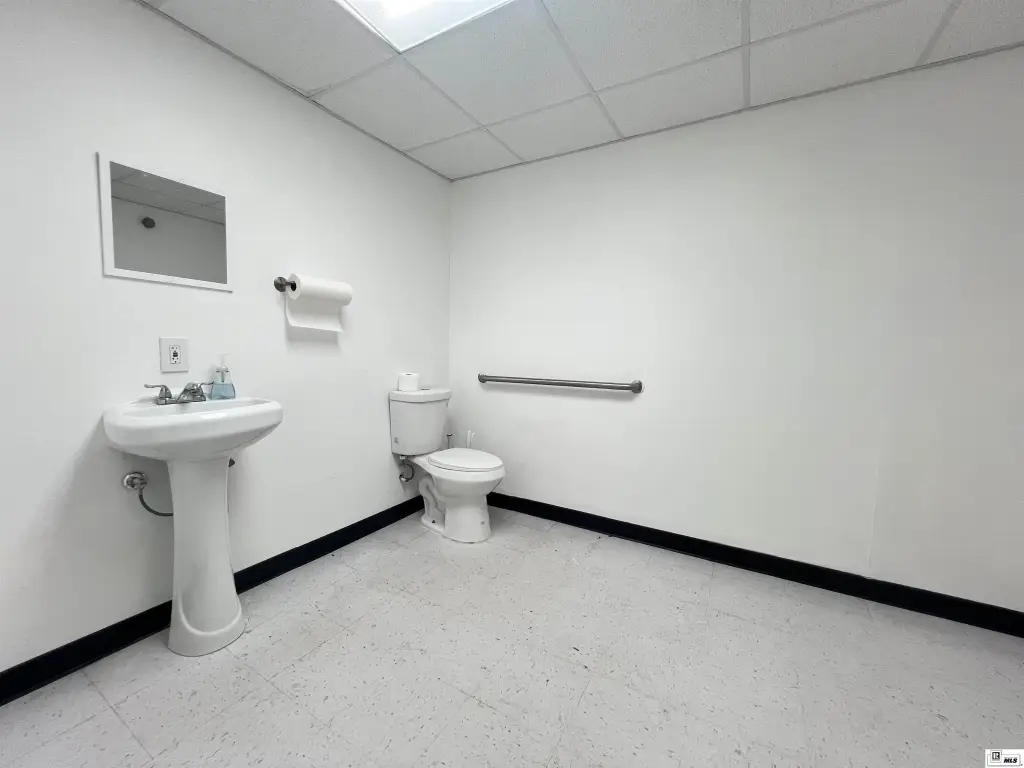
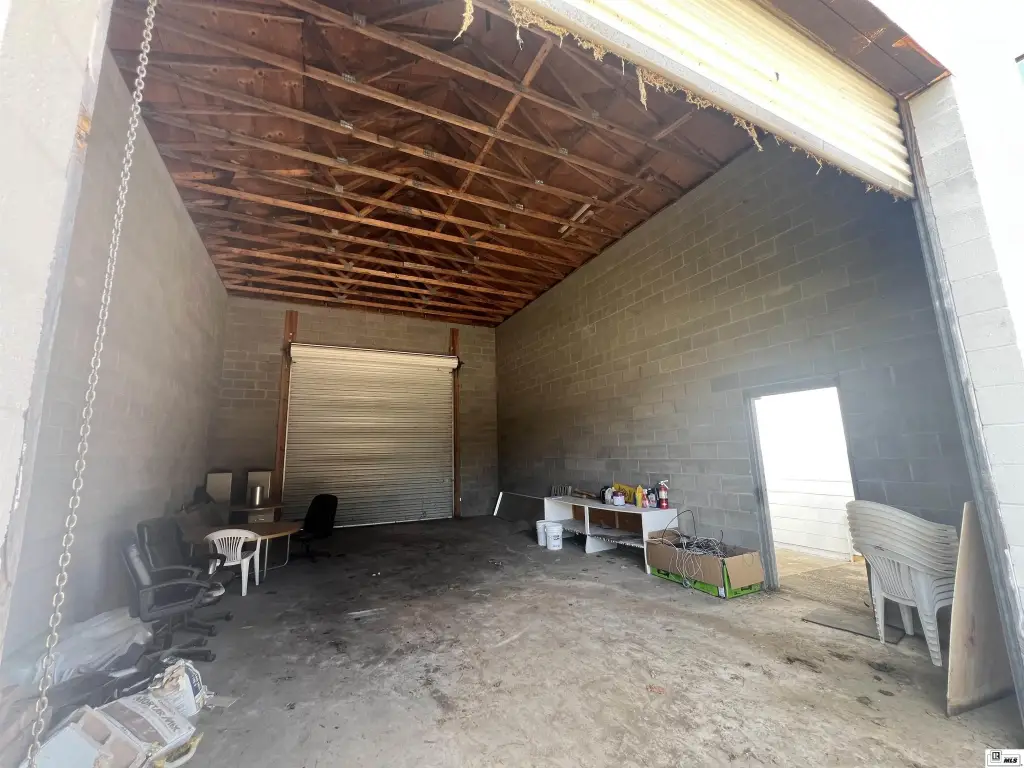
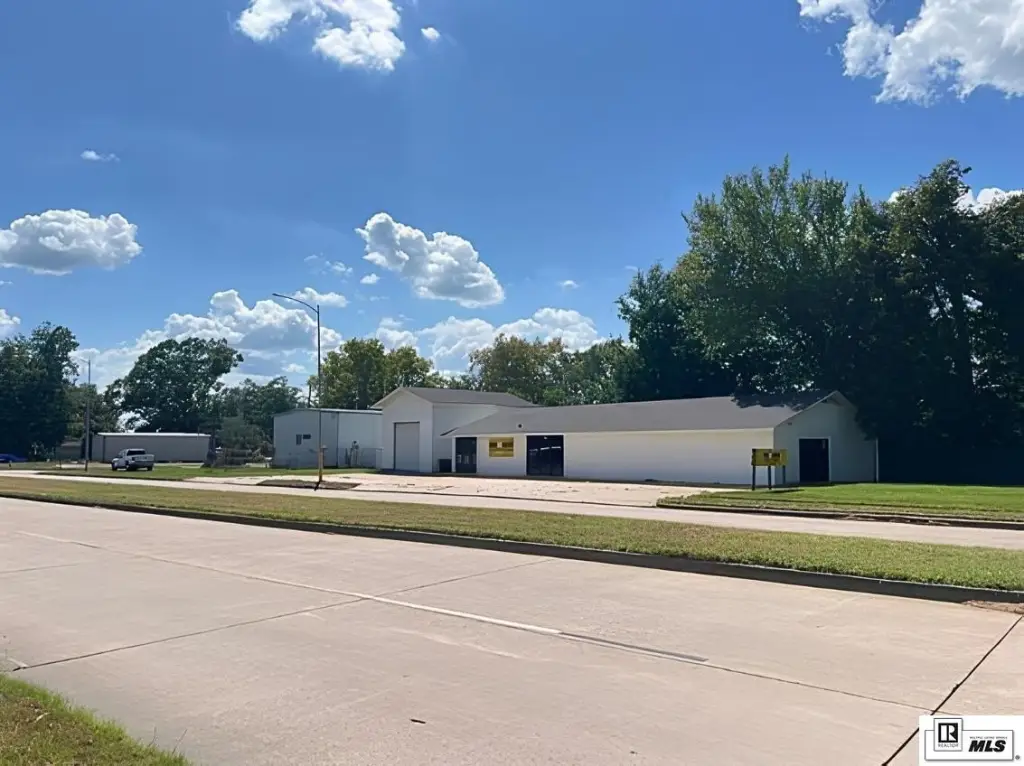
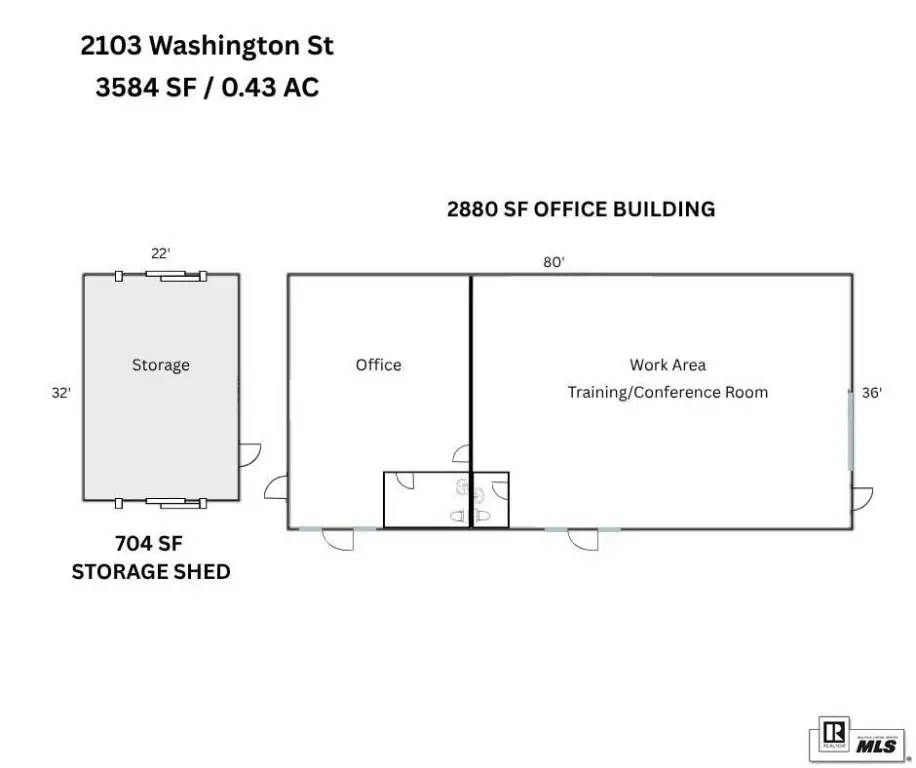
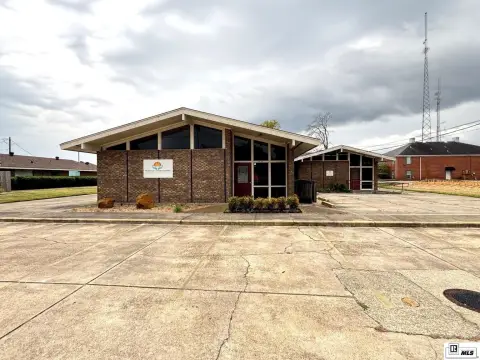
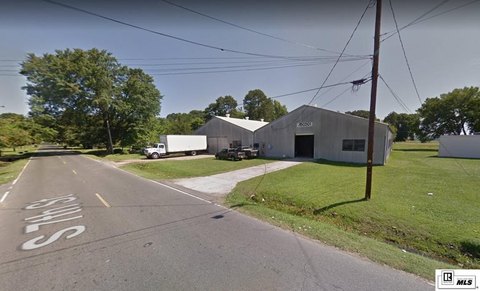
This flex property combines 3,584+/- SF of office and storage improvements on 0.42+/- AC. The 2,880 SF main building offers an open layout, private office, storage room, two restrooms, showroom space, and a wired security system. A separate 704 SF storage building adds 16' ceilings and a 10' x 14' roll-up door. The main building received a new roof in 2023, while interior and exterior painting and parking-lot striping have also been completed.
Located at 2103 Washington Street in Monroe, the property includes landscaping, gutters, exterior lighting, and security features. Central electric heating and cooling serve the office building, which is constructed with concrete block and topped by a composition roof.
Located at 2103 Washington Street in Monroe, the property includes landscaping, gutters, exterior lighting, and security features. Central electric heating and cooling serve the office building, which is constructed with concrete block and topped by a composition roof.
Key Highlights
- 3,584+/- SF of combined office and storage improvements on 0.42+/- AC
- 2,880 SF main office building with open layout, private office, storage room, and 2 restrooms
- Separate 704 SF storage building with 16' ceilings
Financial Insights
Estimated NOI and Cap Rate
NOI / Yr
$18,101
Cap Rate
8.27%
Suggested Prices Based on Cap Rates
Cap Rate 5%
$362,020
$362.0K
Cap Rate 7%
$258,586
$258.6K
Cap Rate 9%
$201,122
$201.1K
Market Conditions
NOI Build-Up for 3,584 SF
Gross rent
$28.0K $7.80/SF
− Vacancy
−$2.1K −$0.59/SF
EGI
$25.9K $7.22/SF
− OpEx
−$7.8K −$2.16/SF
NOI
$18.1K $5.05/SF
Area
Ouachita County, LA
Vacancy
7.50%
Lease Rate
$7.80 /SF/Yr
Expense Ratio
30.00%
Simulate Cap Rate and NOI
Suggested Prices Based on Cap Rates
Cap Rate 5%
$362,020
Cap Rate 7%
$258,586
Cap Rate 9%
$201,122
Alternative Uses
Best Use
Office B
$1.54M
$1.35M – $1.80M
NOI $107,935 @ 7.0% cap · market cap 49.29%
Second Best
Flex RnD
$440.9K
$385.8K – $514.4K
NOI $30,863 @ 7.0% cap · market cap 14.09%
Theoretical Best
Multifamily LT 5
$38.60M
$33.78M – $45.04M
NOI $2,702,315 @ 7.0% cap · market cap 1,233.93%
Zoning and permitted uses should be independently verified with authorities.
Property Analytics
Unlock full access to Insights
Subscribe to Realmo Intelligence
Open Analytics
Current Use
Lease Details
16 ft
Clear height
Yes
Paved road access
Location Intelligence
Trade Area within ½ mile
1,605
Businesses Nearby
Well-served
Demand for This Use
Explore this area
Business Placement
Demographics for 71201, LA
21,565
Population
10,352
Households
2.1
Avg Household Size
39
Median Age
43%
College-Educated
92%
High-School Grad
14.9 sq mi
ZIP Area
1,447
Density / Sq Mi
$53,538
Median Household Income
$44,262
Median Earnings
$882
Median Rent
$247,100
Median Home Value
Check the figures for this property
Cap Rate, Value Estimation, Potential NOI and more
View Realmo Analytics
Market
Vacancy Rate% for Office in South region

Questions? Ask Rey
Realmo’s AI knows this listing — price, zoning, demand, history. Ask anything.





Similar Off Market Nearby
- Rambo's Catering (Rambo Thompson) Chef/ Owner — 1511 breard st, monroe, la 71201
- Bountiful Catering — Monroe, LA 71201
- Trio Community Meals — 1807 Pine St, Monroe, LA 71201
- Southern Smoker Service — 1600 Hudson Ln #6, Monroe, LA 71201
- Rambo's Catering (Rambo Thompson) Chef/ Owner — 400 Cedar St, Monroe, LA 71201
Frequently Asked Questions
What type of property is this?
Flex space - Combined office and storage improvements include an open floor plan, private office, restrooms, and roll-up access.
Where is this flex space located?
The property is located at 2103 WASHINGTON STREET Monroe, LA.
What is the asking price?
The asking price for this property is $219,000.
What are key features of this property?
This property features: 3,584+/- SF of combined office and storage improvements on 0.42+/- AC; 2,880 SF main office building with open layout, private office, storage room, and 2 restrooms; Separate 704 SF storage building with 16' ceilings



