Flex Space With Loading
For Sale
$225,000
1401 Pine St, Monroe, LA 71201
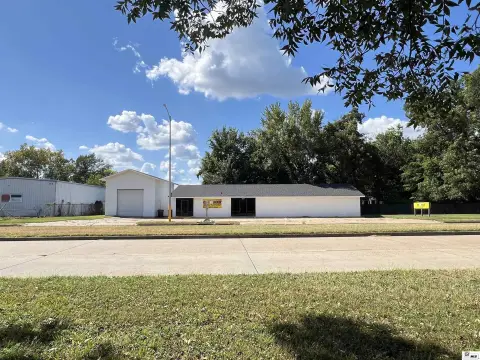
Corner-positioned commercial space combines warehouse capacity, offices, restrooms, and covered exterior work or storage space.
Property Size3,744 SF
Price / SF$60.10
Days on Market87
Property Features for 1401 Pine St
General Information
Standard status
Active
Size
3,744 SF
Property subtype
Industrial
Zoning
I-1
Site & Location
Highway Access
Yes
Road Access
Yes
Outdoor Storage
Yes
Additional Details
Office Build-Out
364 SF
Amenities
Power
Water
Sewer
Building Details
Building Size
3,744 SF
Listing Agency:
John Rea Realty
Listed By:
Mark Phelps · License #0995682435
(318) 237-5153
Source:
Lacdb.resimplifi
Added: Jul 24
Changed: Oct 12
Last Checked: Oct 16 at 5:51AM
Displayed information is deemed reliable but is not guaranteed and should be independently verified. All listing content including descriptions, pricing, images are the copyrighted material of John Rea Realty

Ask AI about this property
Review the available facts, identify missing information and prepare questions for the agent.
Investment Insights
Based on property information with market context.
This 3,744± square foot flex property combines warehouse space with approximately 364 square feet of office area and two restrooms. Three 12-foot roll-up doors support loading and unloading, while a covered 16' x 36' exterior area adds protected room for equipment or materials. The layout is suited to distribution, service, light industrial, and contractor operations.
The property occupies the corner of Pine Street and 14th Street in Monroe’s Central Business District. It is two blocks from Louisville Avenue and provides access to Interstate 20, connecting the site with major transportation routes. The combination of warehouse volume, office accommodations, loading access, and exterior work space supports a range of commercial operating needs.
The property occupies the corner of Pine Street and 14th Street in Monroe’s Central Business District. It is two blocks from Louisville Avenue and provides access to Interstate 20, connecting the site with major transportation routes. The combination of warehouse volume, office accommodations, loading access, and exterior work space supports a range of commercial operating needs.
Key Highlights
- 3,744± square foot flex property with warehouse and office components
- Three 12‑foot roll‑up doors for loading and unloading
- Approximately 364 square feet of office space plus two restrooms
Financial Insights
Estimated NOI and Cap Rate
NOI / Yr
$18,909
Cap Rate
8.40%
Suggested Prices Based on Cap Rates
Cap Rate 5%
$378,180
$378.2K
Cap Rate 7%
$270,129
$270.1K
Cap Rate 9%
$210,100
$210.1K
Market Conditions
NOI Build-Up for 3,744 SF
Gross rent
$29.2K $7.80/SF
− Vacancy
−$2.2K −$0.59/SF
EGI
$27.0K $7.22/SF
− OpEx
−$8.1K −$2.16/SF
NOI
$18.9K $5.05/SF
Area
Ouachita County, LA
Vacancy
7.50%
Lease Rate
$7.80 /SF/Yr
Expense Ratio
30.00%
Simulate Cap Rate and NOI
Suggested Prices Based on Cap Rates
Cap Rate 5%
$378,180
Cap Rate 7%
$270,129
Cap Rate 9%
$210,100
Alternative Uses
Best Use
Flex RnD
$460.6K
$403.0K – $537.3K
NOI $32,240 @ 7.0% cap · market cap 14.33%
Second Best
Warehouse
$315.2K
$275.8K – $367.8K
NOI $22,067 @ 7.0% cap · market cap 9.81%
Theoretical Best
Multifamily LT 5
$40.33M
$35.29M – $47.05M
NOI $2,822,954 @ 7.0% cap · market cap 1,254.65%
Zoning and permitted uses should be independently verified with authorities.
How Realmo checks its estimates
Property Analytics
Unlock full access to Insights
Subscribe to Realmo Intelligence
Open Analytics
Current Use
Lease Details
Yes
Highway access
Yes
Paved road access
Location Intelligence
Trade Area within ½ mile
1,388
Businesses Nearby
Well-served
Demand for This Use
Explore this area
Business Placement
Demographics for 71201, LA
21,565
Population
10,352
Households
2.1
Avg Household Size
39
Median Age
43%
College-Educated
92%
High-School Grad
14.9 sq mi
ZIP Area
1,447
Density / Sq Mi
$53,538
Median Household Income
$44,262
Median Earnings
$882
Median Rent
$247,100
Median Home Value
Check the figures for this property
Cap Rate, Value Estimation, Potential NOI and more
View Realmo Analytics
Market
Vacancy Rate% for Industrial in South region





Similar Off Market Nearby
- Chef Cory Bahr — 318 N 2nd St, Monroe, LA 71201
- Chef Cory Bahr — 130 Art Aly, Monroe, LA 71201
- World Classics Catering — 615 N 2nd St, Monroe, LA 71201
- Rambo's Catering (Rambo Thompson) Chef/ Owner — 1511 breard st, monroe, la 71201
- Bountiful Catering — Monroe, LA 71201
Frequently Asked Questions
What type of property is this?
Flex space - Corner-positioned commercial space combines warehouse capacity, offices, restrooms, and covered exterior work or storage space.
Where is this flex space located?
The property is located at 1401 Pine St Monroe, LA.
What is the asking price?
The asking price for this property is $225,000.
What are key features of this property?
This property features: 3,744± square foot flex property with warehouse and office components; Three 12‑foot roll‑up doors for loading and unloading; Approximately 364 square feet of office space plus two restrooms


