New Construction Duplex with Private
For Sale
$875,000
Pending
210 Holden Blvd, Staten Island, NY 10314
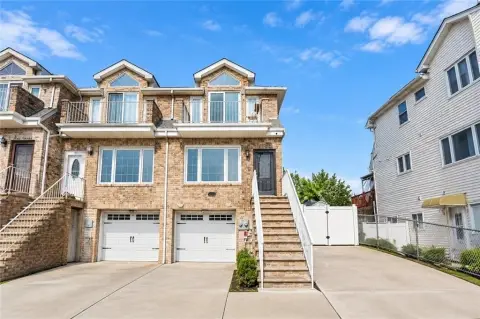
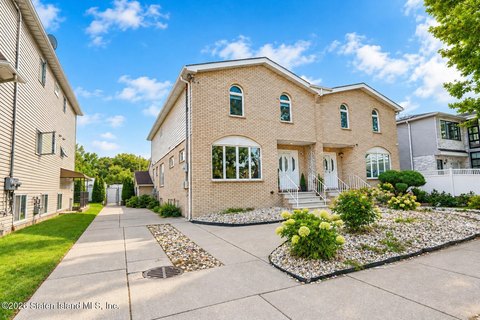
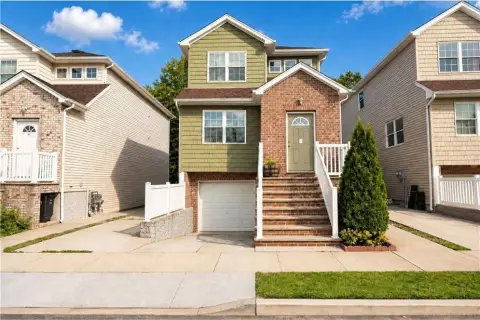
Three-level residences offer finished basements, private balconies, modern kitchens, and dedicated parking access.
Property Size1,920 SF
Days on Market111
Property Features for 210 Holden Blvd
General Information
Standard status
Pending
Size
1,920 SF
Property subtype
Multi-Family
Amenities
hardwood floors
Andersen windows
recessed lighting
porcelain tile bathrooms
high ceilings
custom moldings
balcony
Building Details
Year Built
2026
Stories
3
Abandoned
No
Listing Agency:
Robert DeFalco Realty, Inc.
Listed By:
Maria T Albanesi-Cortese · License #30AL0899365
(718) 987-7900
Source:
Statenislandhomelistings
Added: Jul 1
Changed: Oct 1
Last Checked: Oct 19 at 6:56AM
Displayed information is deemed reliable but is not guaranteed and should be independently verified. All listing content including descriptions, pricing, images are the copyrighted material of Robert DeFalco Realty, Inc.

Ask AI about this property
Review the available facts, identify missing information and prepare questions for the agent.
Investment Insights
Based on property information with market context.
This new-construction duplex property at 210 Holden Blvd in Staten Island includes residences measuring 1,920 square feet, with completion scheduled for 2026. Each home is arranged across three levels plus a fully finished walkout basement. The main floor combines living and dining areas with an eat-in kitchen equipped with stainless steel appliances, two sinks, and extensive cabinetry. A half bath is also provided on this level.
The upper floors include two bedrooms, a full bathroom, laundry equipment, and a private primary suite with a three-quarter bathroom and balcony. The finished basement adds an open living area and another three-quarter bathroom. Hardwood flooring, Andersen windows, recessed lighting, high ceilings, custom moldings, and porcelain-tiled bathrooms are incorporated throughout, along with a private driveway.
The upper floors include two bedrooms, a full bathroom, laundry equipment, and a private primary suite with a three-quarter bathroom and balcony. The finished basement adds an open living area and another three-quarter bathroom. Hardwood flooring, Andersen windows, recessed lighting, high ceilings, custom moldings, and porcelain-tiled bathrooms are incorporated throughout, along with a private driveway.
Key Highlights
- New‑construction duplex property completed in 2026
- Each residence measures 1,920 square feet
- Three‑level layout plus a fully finished walkout basement
Financial Insights
Estimated NOI and Cap Rate
NOI / Yr
$52,368
Cap Rate
5.98%
Suggested Prices Based on Cap Rates
Cap Rate 5%
$1,047,360
$1.0M
Cap Rate 7%
$748,114
$748.1K
Cap Rate 9%
$581,867
$581.9K
Market Conditions
NOI Build-Up for 1,920 SF
Gross rent
$78.3K $40.80/SF
− Vacancy
−$3.5K −$1.84/SF
EGI
$74.8K $38.96/SF
− OpEx
−$22.4K −$11.69/SF
NOI
$52.4K $27.27/SF
Area
ZIP 10314
Vacancy
4.50%
Lease Rate
$40.80 /SF/Yr
Expense Ratio
30.00%
Simulate Cap Rate and NOI
Suggested Prices Based on Cap Rates
Cap Rate 5%
$1,047,360
Cap Rate 7%
$748,114
Cap Rate 9%
$581,867
Alternative Uses
Best Use
Multifamily LT 5
$748.1K
$654.6K – $872.8K
NOI $52,368 @ 7.0% cap · market cap 5.98%
Second Best
Apartment 5plus
$693.7K
$607.0K – $809.3K
NOI $48,559 @ 7.0% cap · market cap 5.55%
Theoretical Best
Office A
$916.1K
$801.6K – $1.07M
NOI $64,128 @ 7.0% cap · market cap 7.33%
Zoning and permitted uses should be independently verified with authorities.
How Realmo checks its estimates
Property Analytics
Unlock full access to Insights
Subscribe to Realmo Intelligence
Open Analytics
Current Use
Location Intelligence
Trade Area within ½ mile
851
Businesses Nearby
Explore this area
Business Placement
Demographics for 10314, NY
92,157
Population
33,554
Households
2.7
Avg Household Size
41
Median Age
37%
College-Educated
89%
High-School Grad
13.0 sq mi
ZIP Area
7,089
Density / Sq Mi
$104,655
Median Household Income
$58,769
Median Earnings
$1,726
Median Rent
$665,500
Median Home Value
Check the figures for this property
Cap Rate, Value Estimation, Potential NOI and more
View Realmo Analytics
Market
Vacancy Rate% for Multifamily in Northeast region
Frequently Asked Questions
What type of property is this?
Duplex - Three-level residences offer finished basements, private balconies, modern kitchens, and dedicated parking access.
Where is this duplex located?
The property is located at 210 Holden Blvd Staten Island, NY.
What is the asking price?
The asking price for this property is $875,000.
What are key features of this property?
This property features: New‑construction duplex property completed in 2026; Each residence measures 1,920 square feet; Three‑level layout plus a fully finished walkout basement


