Mixed-Use Property with Retail and
For Sale
$1,975,000
208 S Elm Street, Three Oaks, MI 49128
Commercial Sale, Three Oaks, MI
Property Size16,474 SF
Lot Size1.54 Acres
Price / SF$119.89
Days on Market50
Property Features for 208 S Elm Street
General Information
Property type
Commercial Sale
Property subtype
Retail
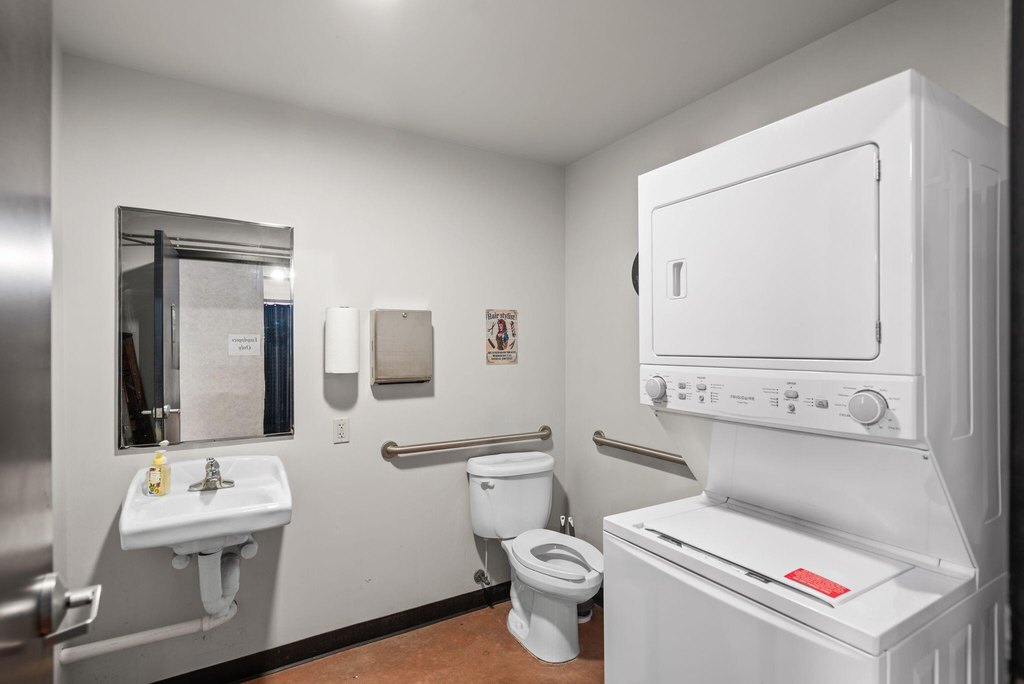
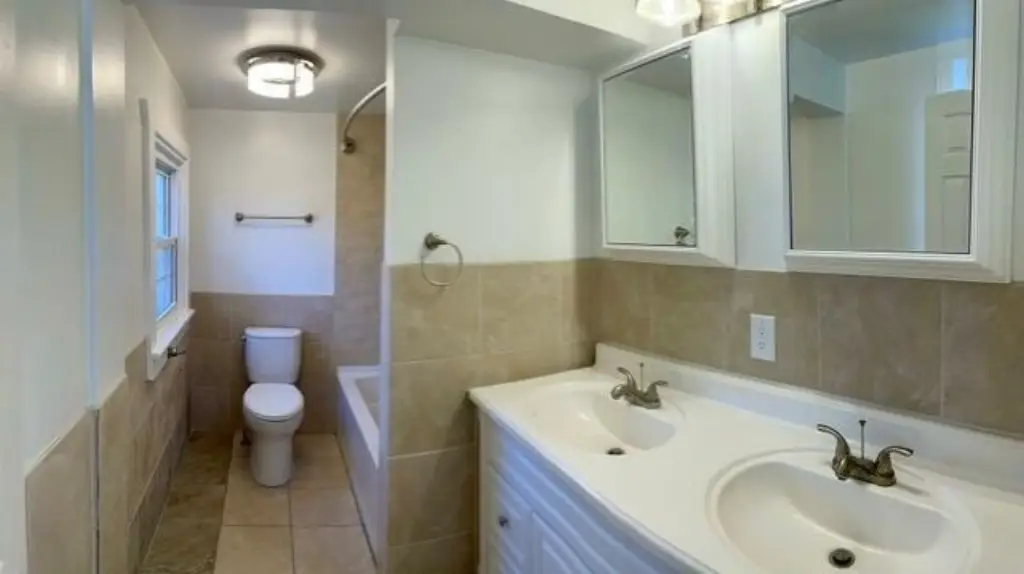
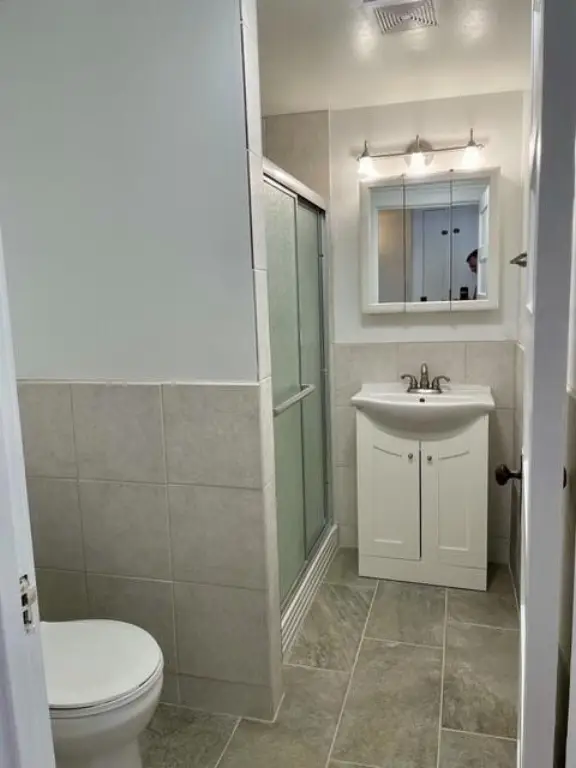
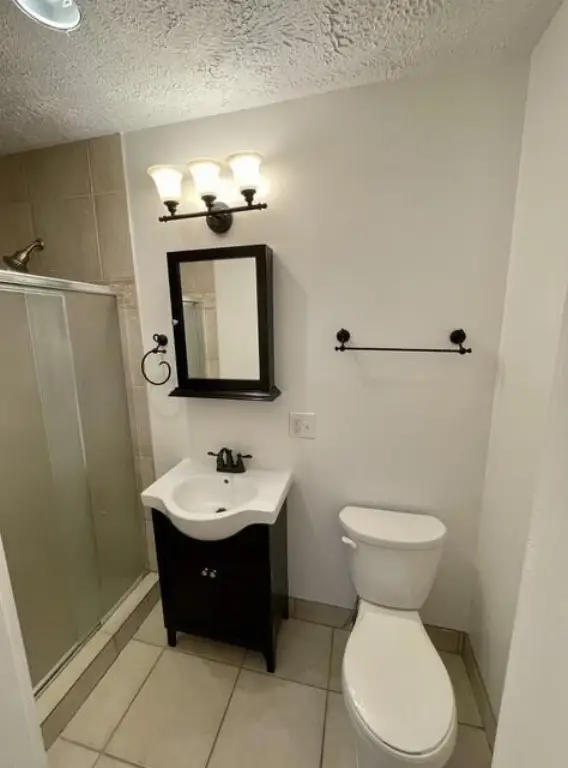
Bathrooms
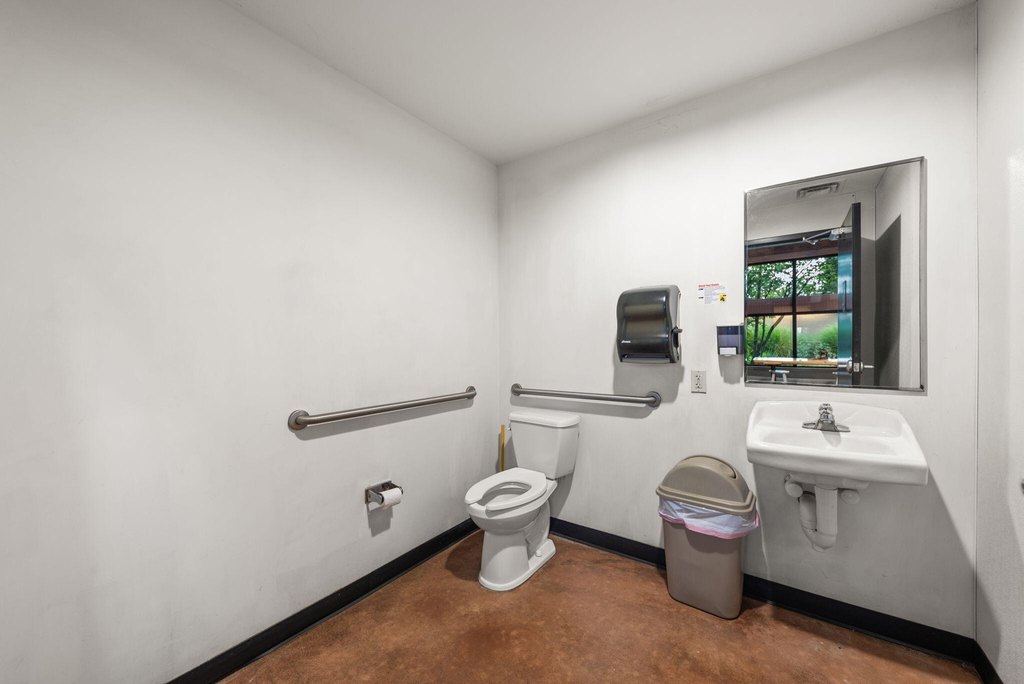
4
Full bathrooms
4
Rooms
Bathroom 2, Bathroom 1, Bathroom 4, Bathroom 3
Interior features
Broadband
Elementary school district
River Valley
Middle school district
River Valley
High school district
River Valley
Directions
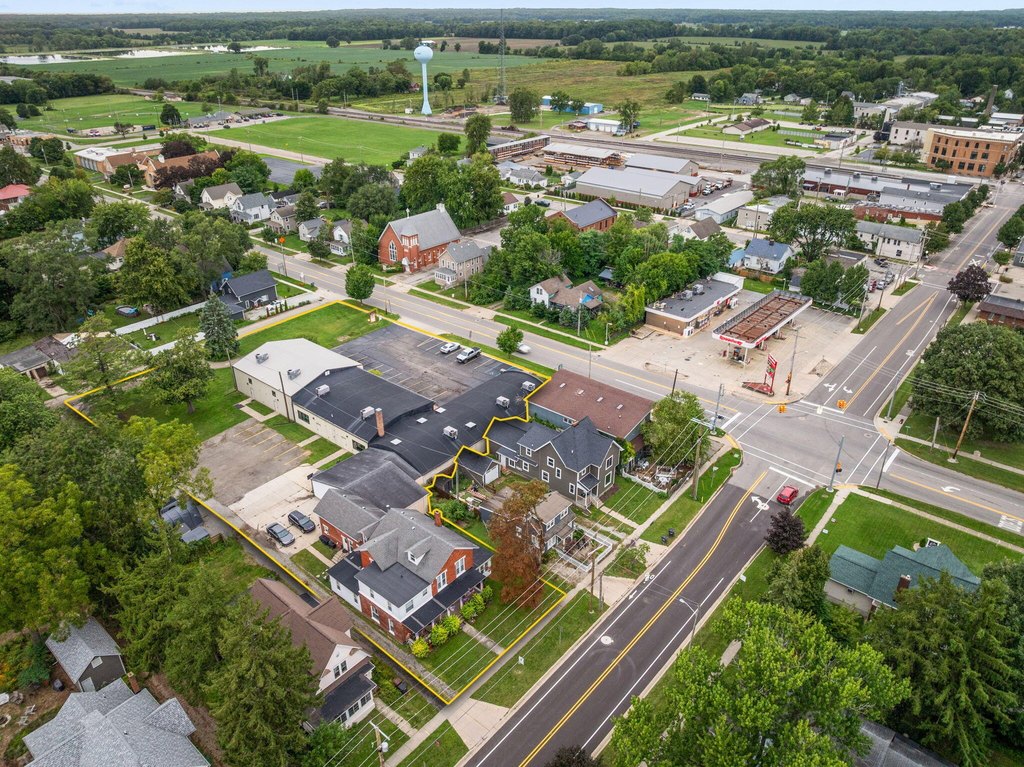
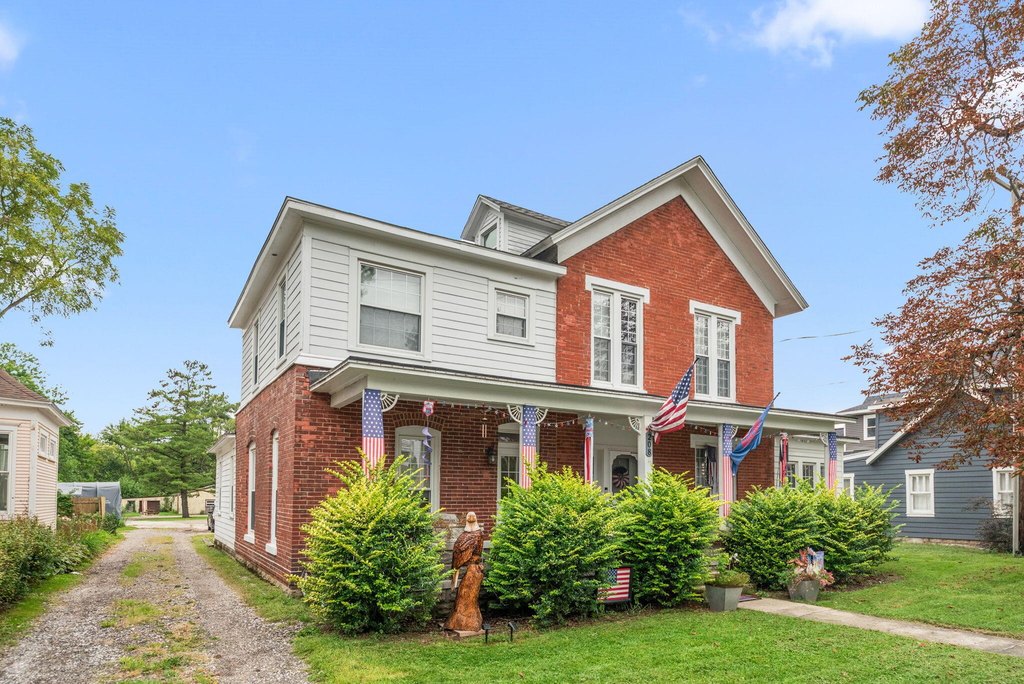
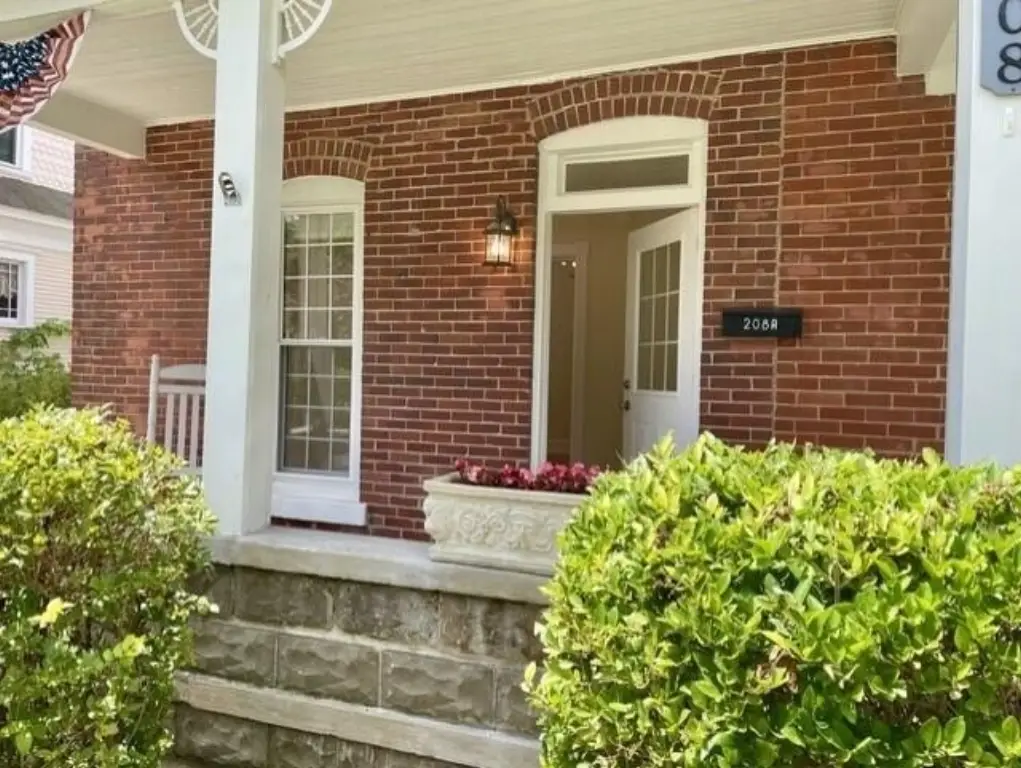
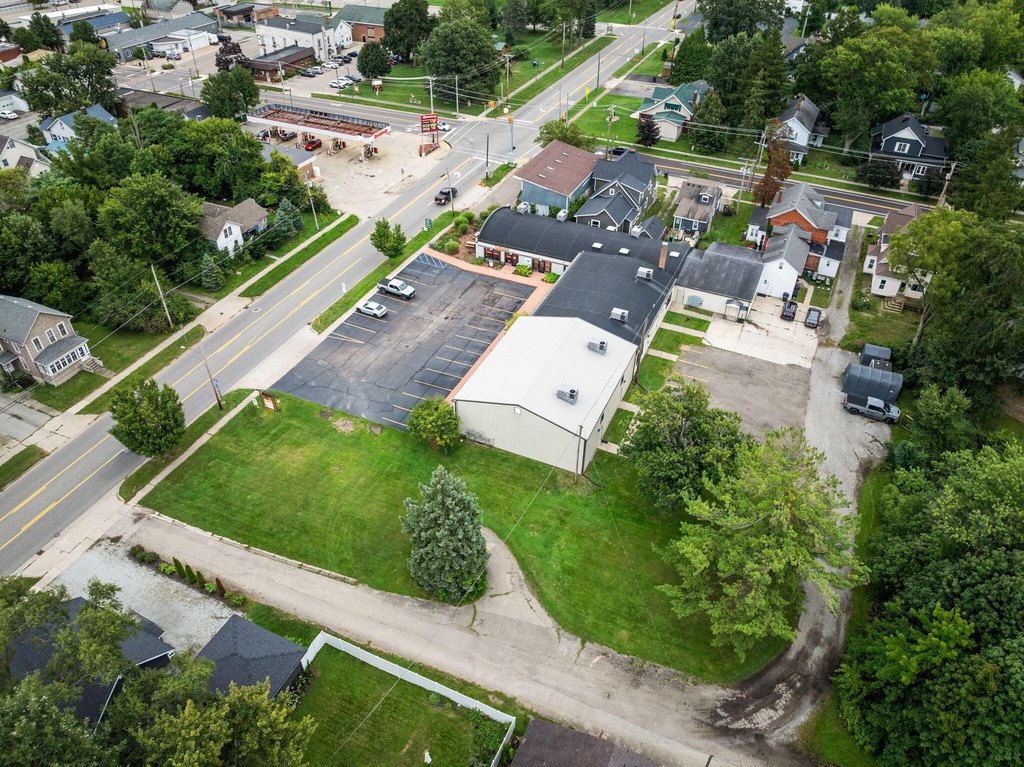
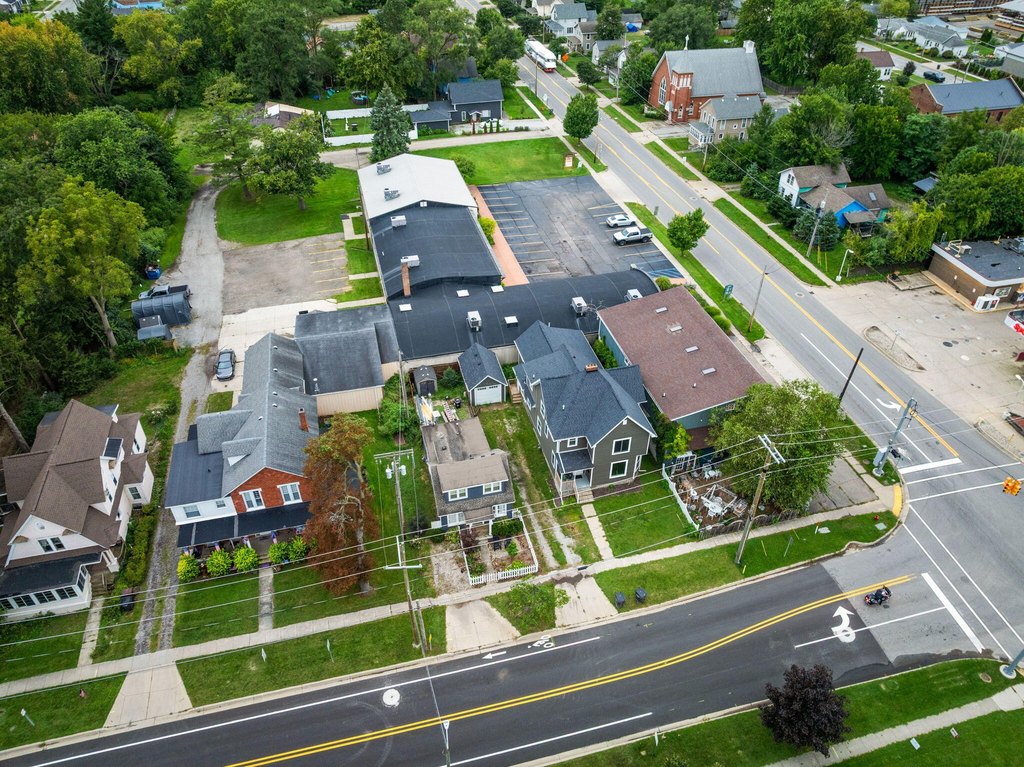
US 12 to entrance to commercial property. The residential building is around the corner facing onto Elm Street.
Standard status
Active
APN
11-47-7100-0001-03-8
Size
16,474 SF
Lot size
1.54 Acres
Taxes and HOA fees
Tax Year
2025
Tax Description
LOT 3 & THE W 41.4'OF LOTS 1 & 2 SHEDDS ADD TO VILLAGE OF THREE OAKS ALSO PT OF SEC 10 T8S R20W COM AT NW COR SD LOT 1 T
Tax Annual Amount
8499
Legal Description
LOT 3 & THE W 41.4'OF LOTS 1 & 2 SHEDDS ADD TO VILLAGE OF THREE OAKS ALSO PT OF SEC 10 T8S R20W COM AT NW COR SD LOT 1 T
Utilities
Utilities
Natural Gas Available
Heating system
Forced Air
Cooling system
Central Air
Building Details
Year built
1900
Number of units
9
Building materials
Wood Siding, Brick
Roof type
Rubber, Metal, Composition
Listing Agency:
Coldwell Banker Realty · Coldwell Banker Real Estate
(269) 469-3950
Listed By:
ChooseChad Team
(219) 241-9083
Added: Aug 18
Changed: Oct 2
Last Checked: Oct 6 at 8:06AM
MLS# 26043411
Copyright © 2026 Michigan Regional Information Center, LLC. All rights reserved. All information provided by the listing agent/broker is deemed reliable but is not guaranteed and should be independently verified.
Investment Insights
Based on property information with market context.
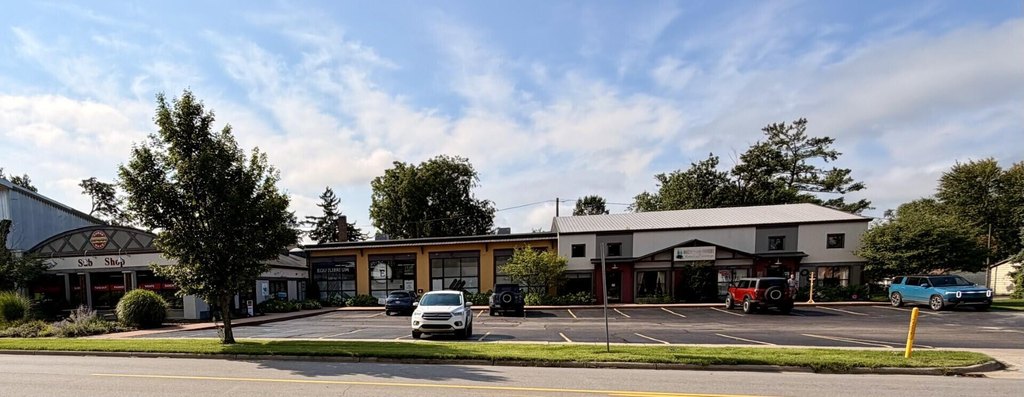
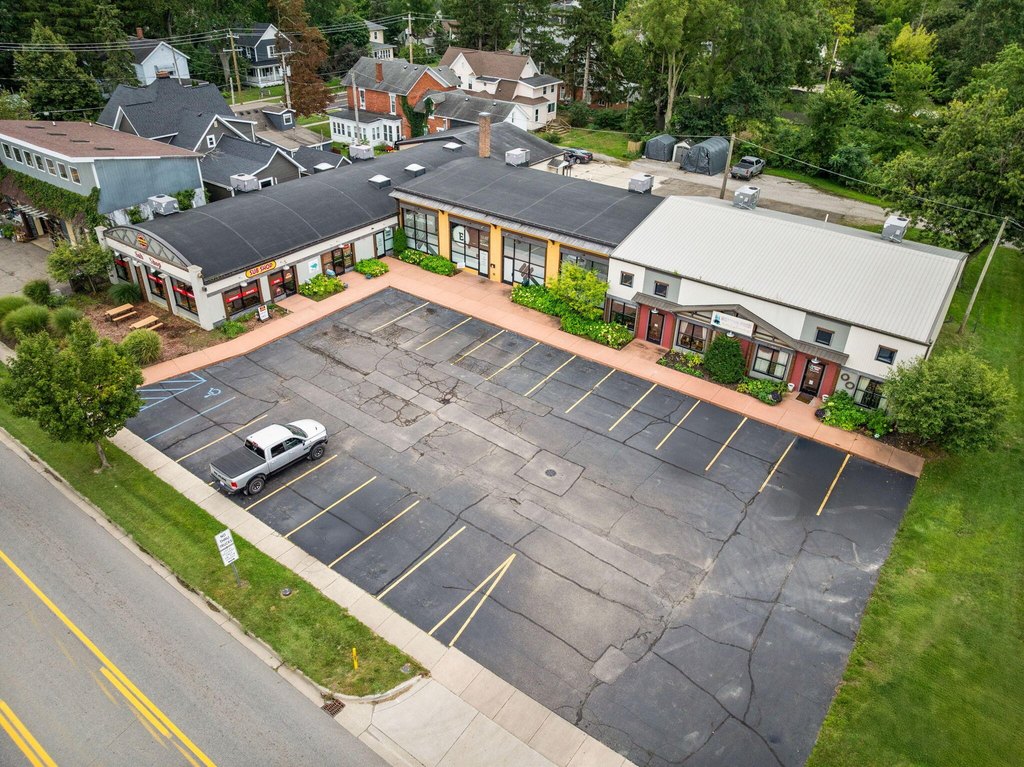
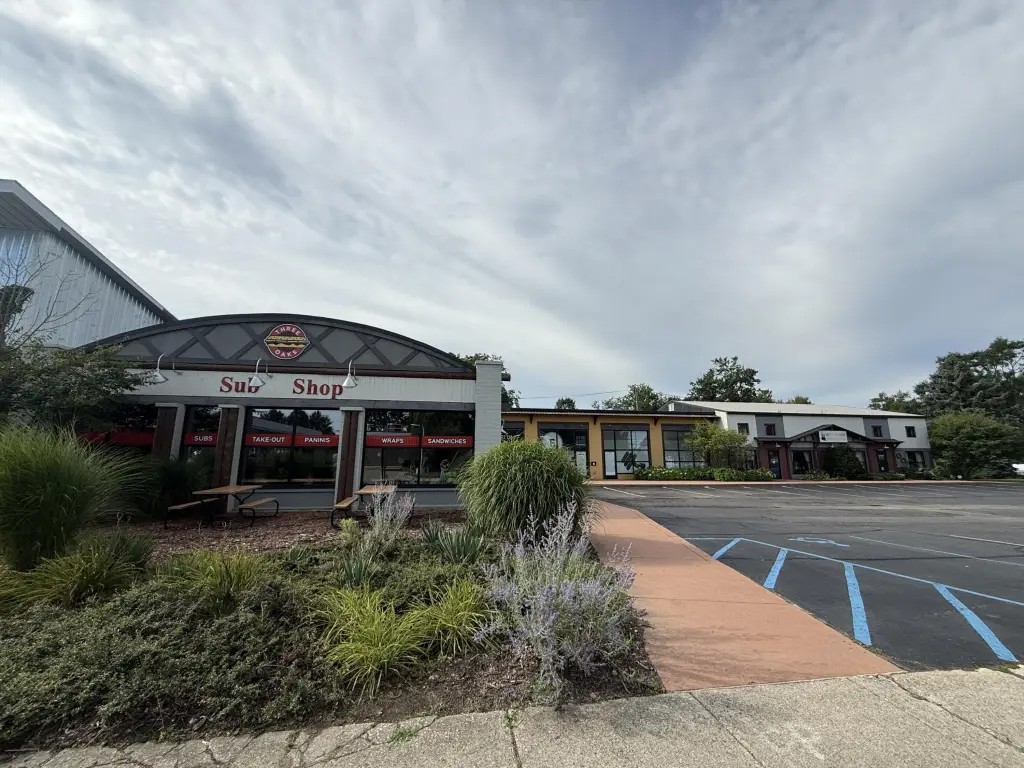
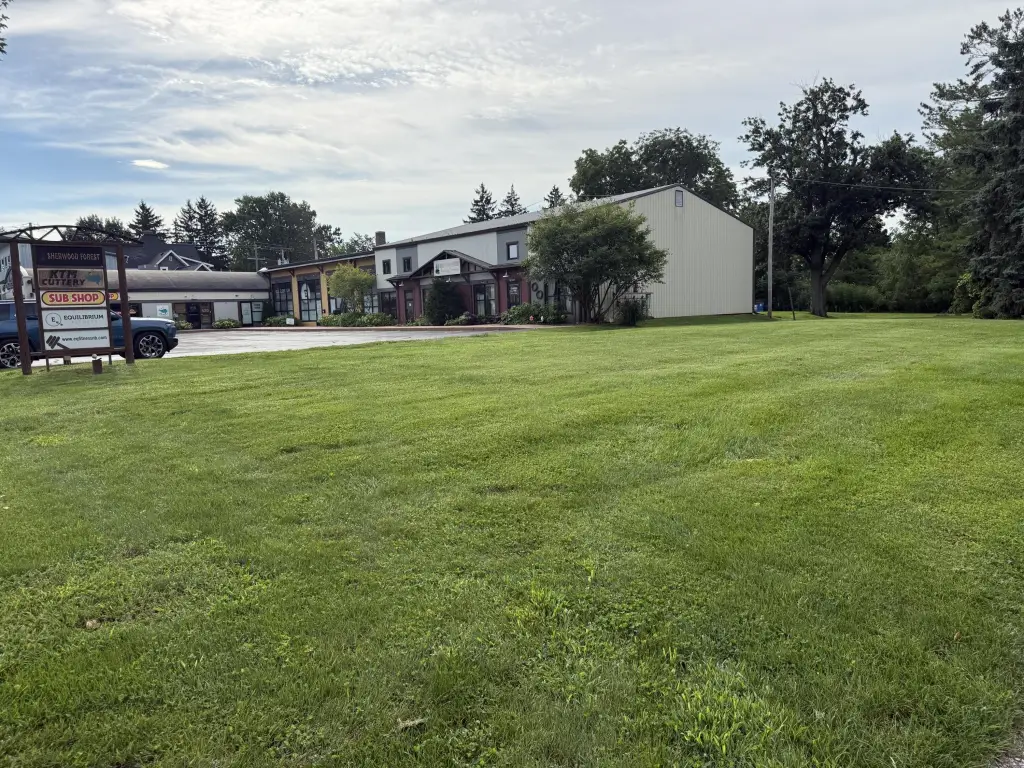
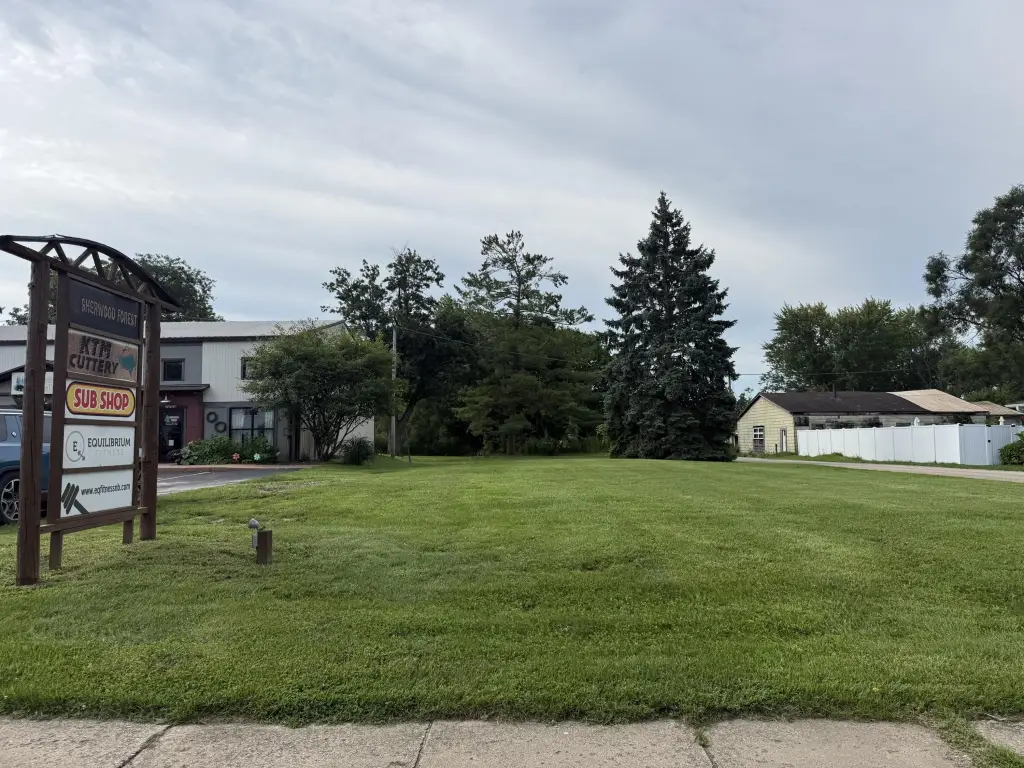
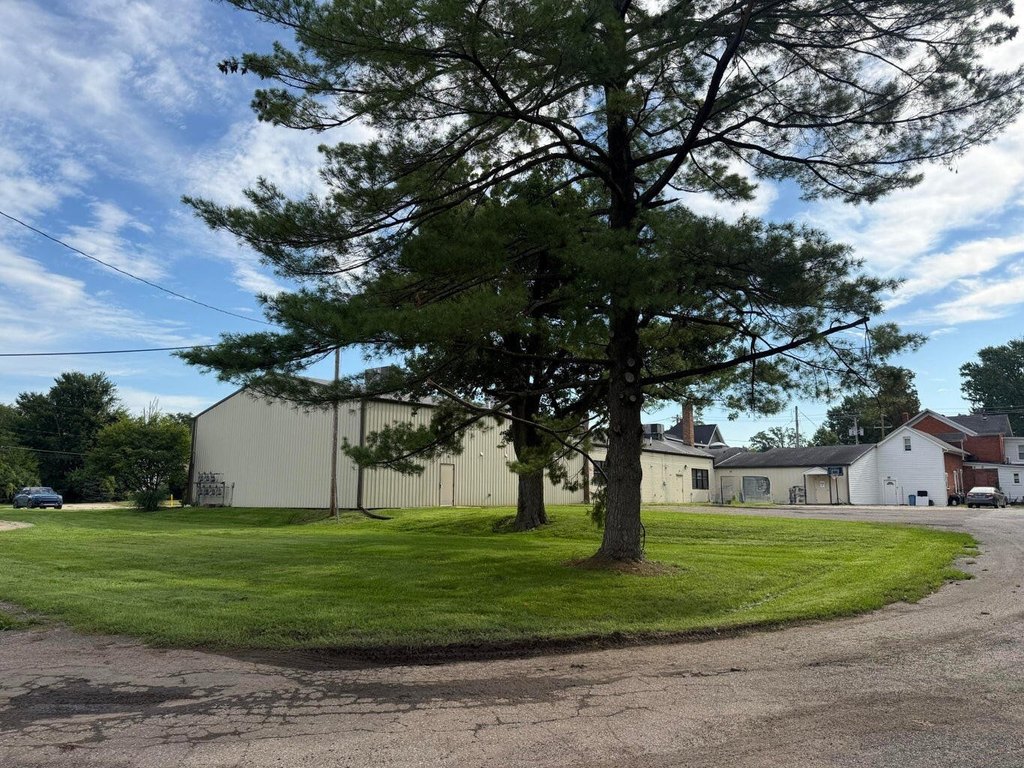
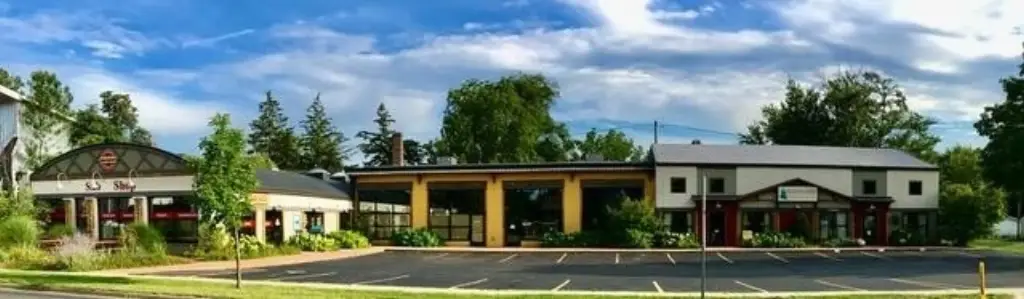
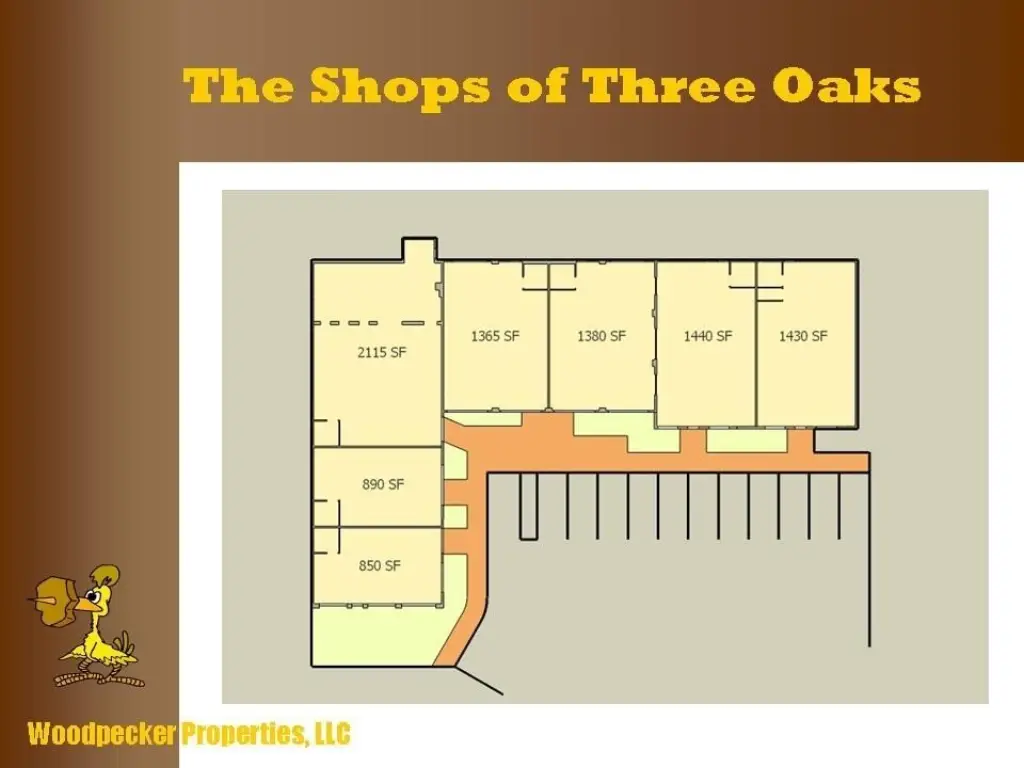
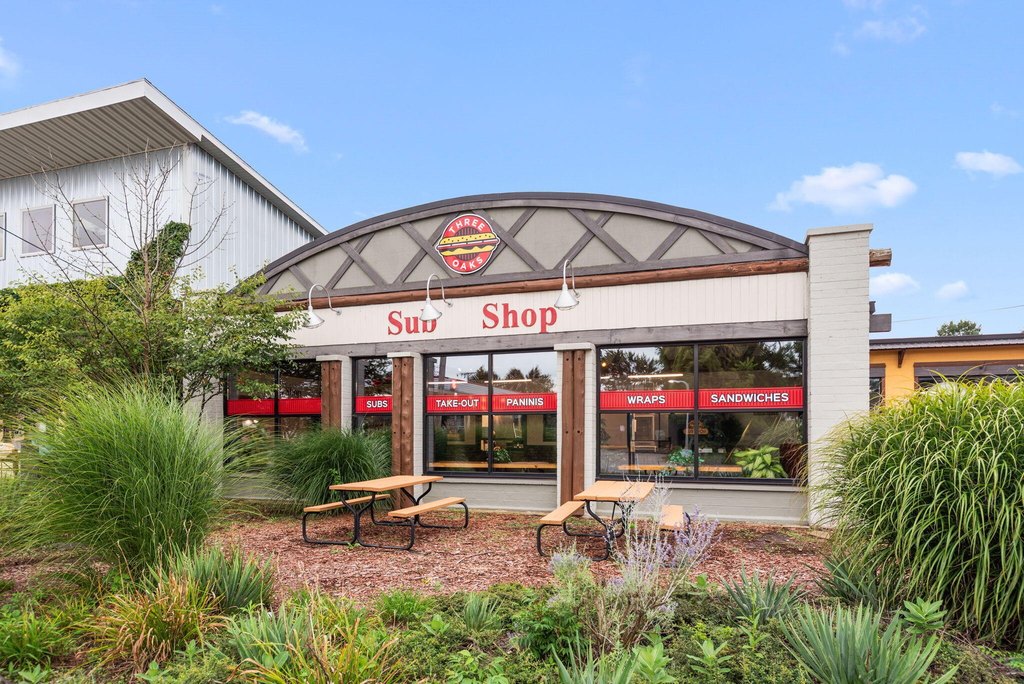
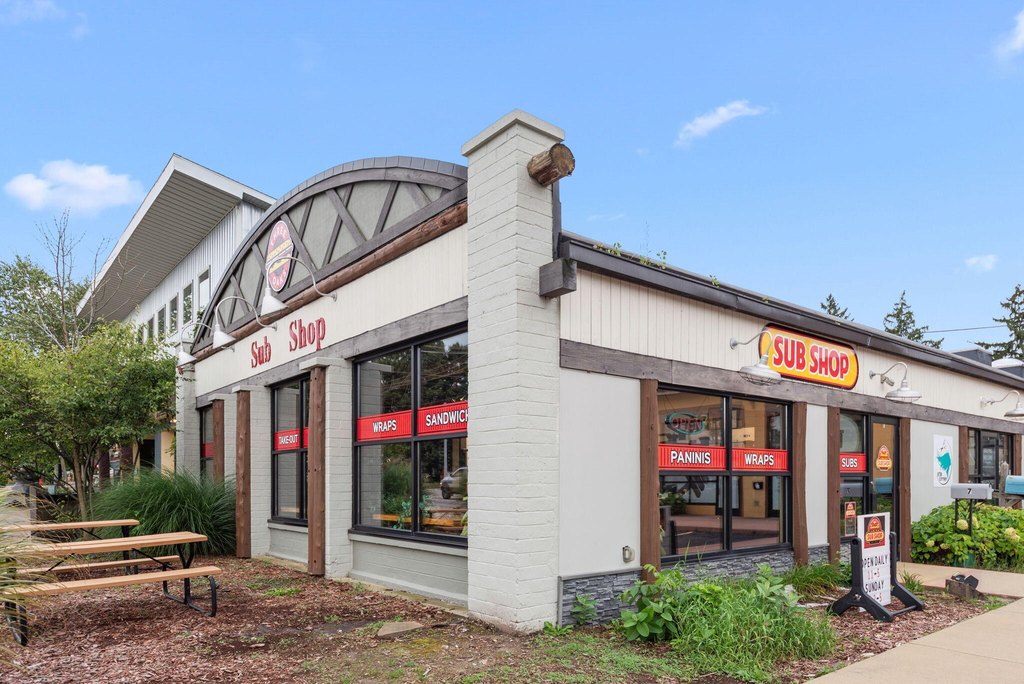
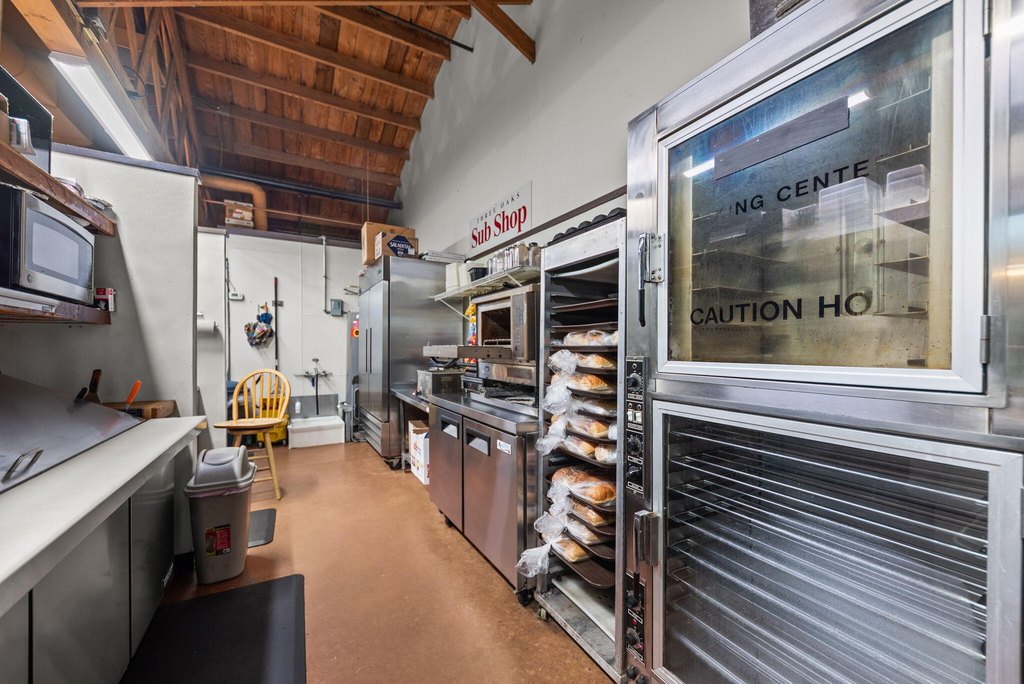
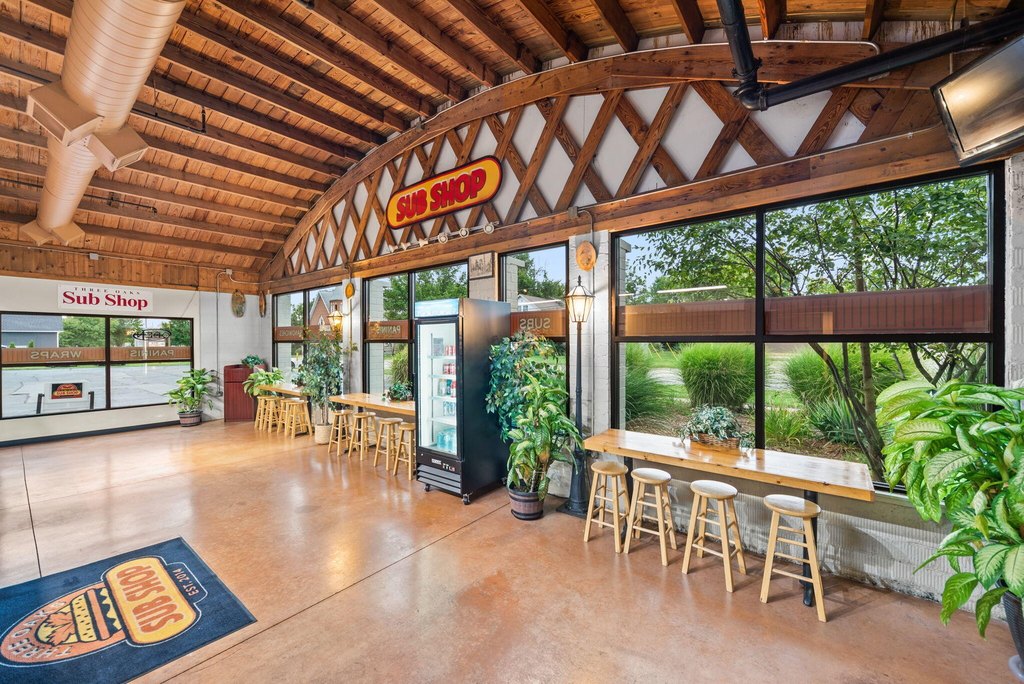
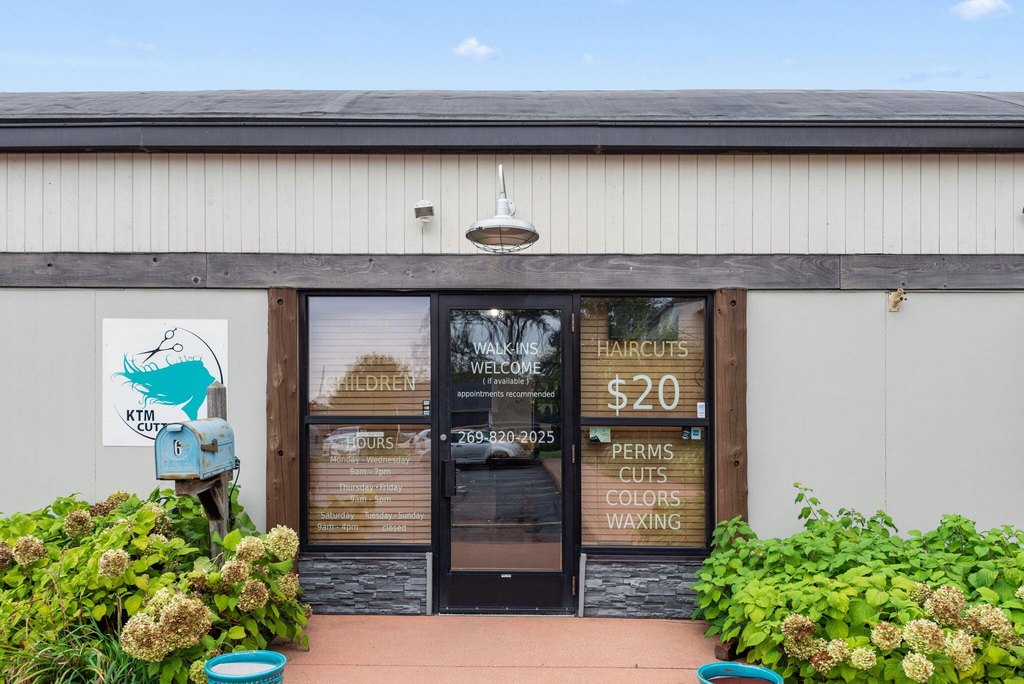
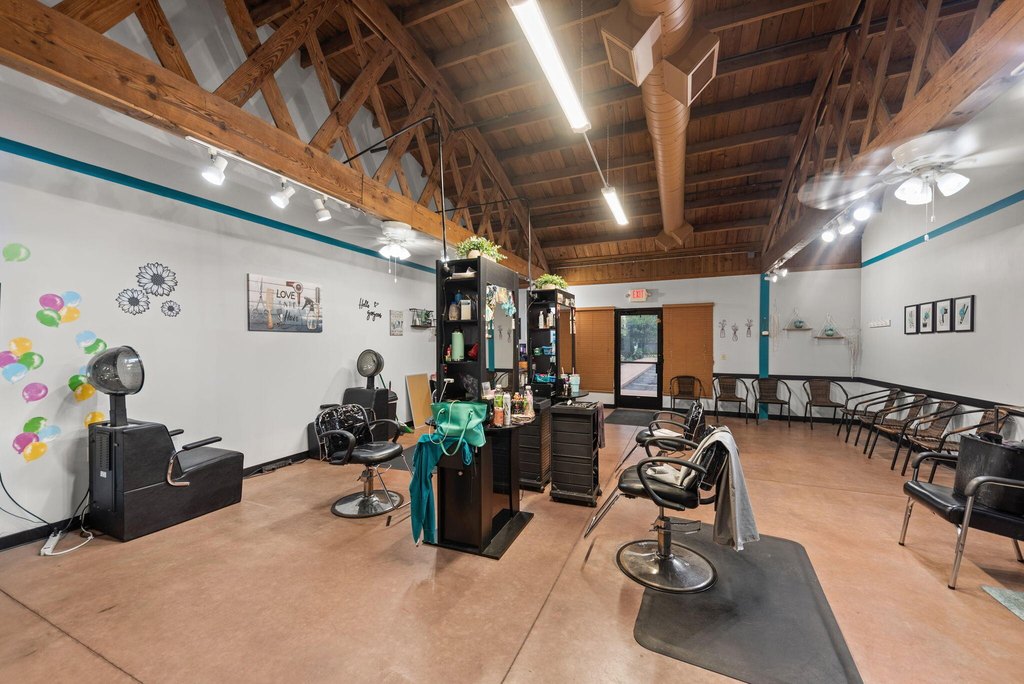
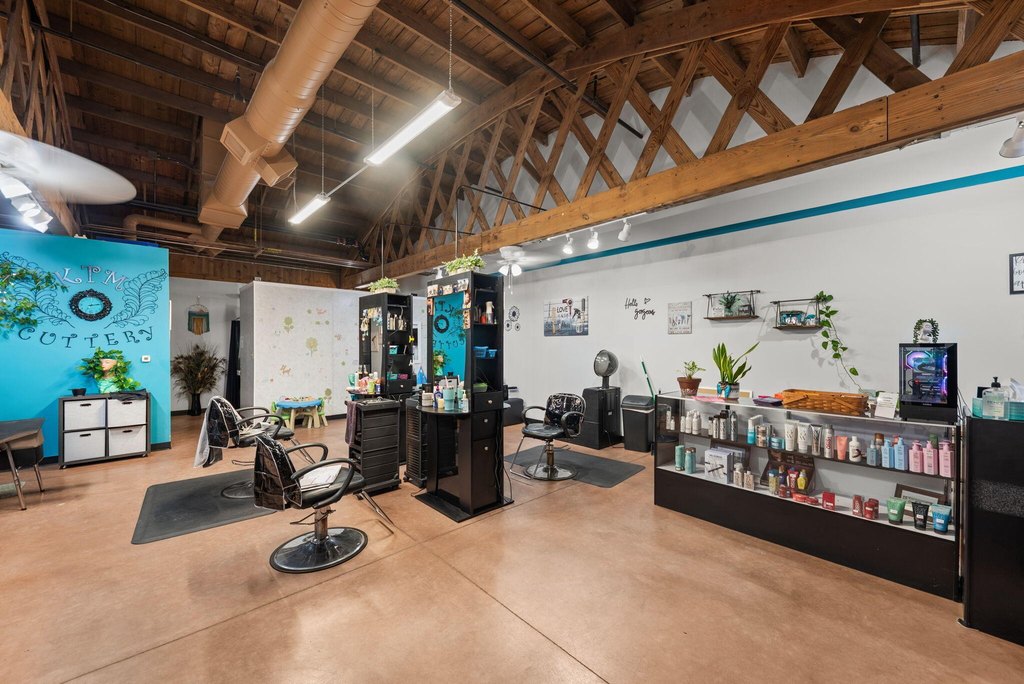
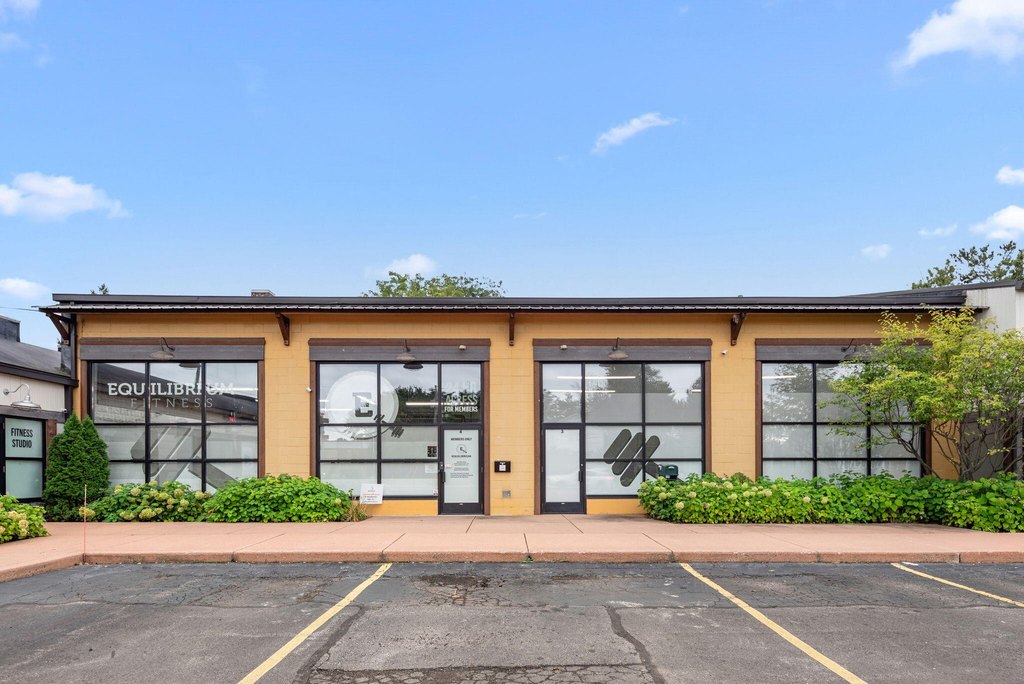
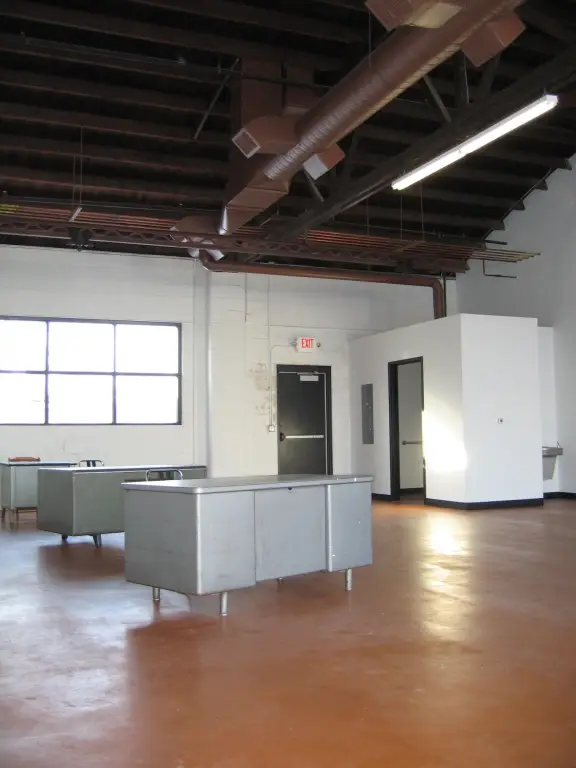
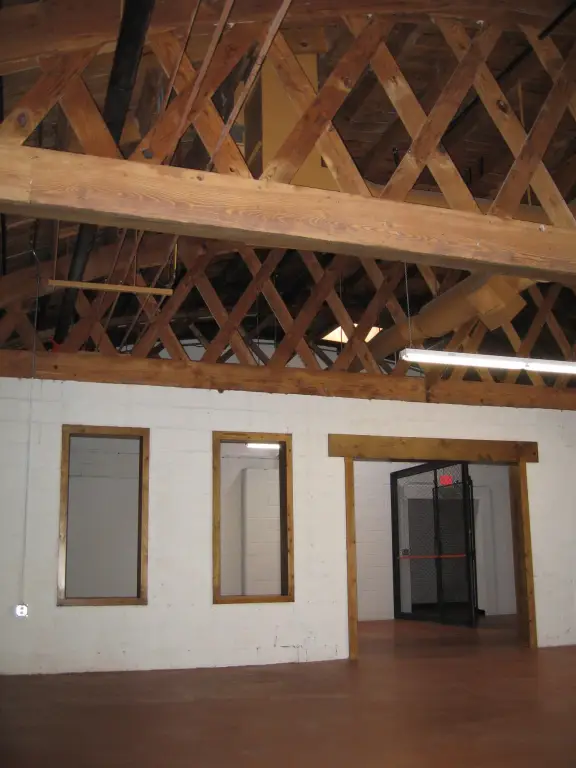
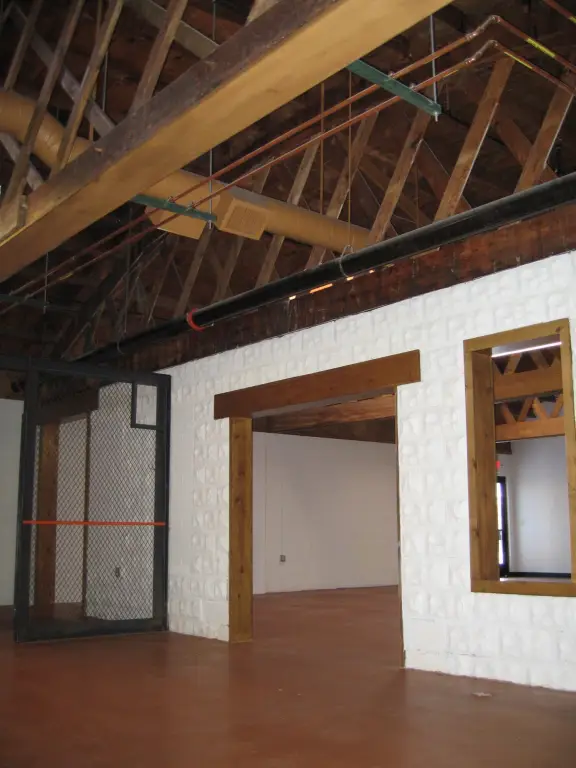
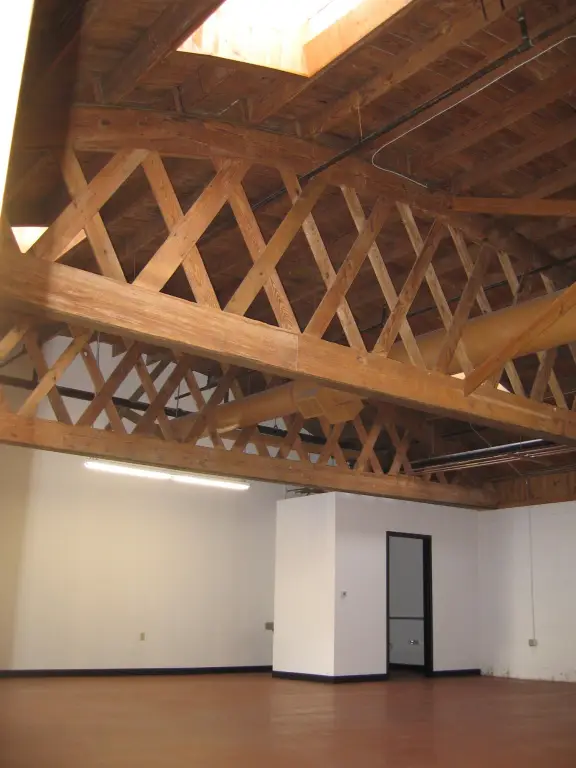
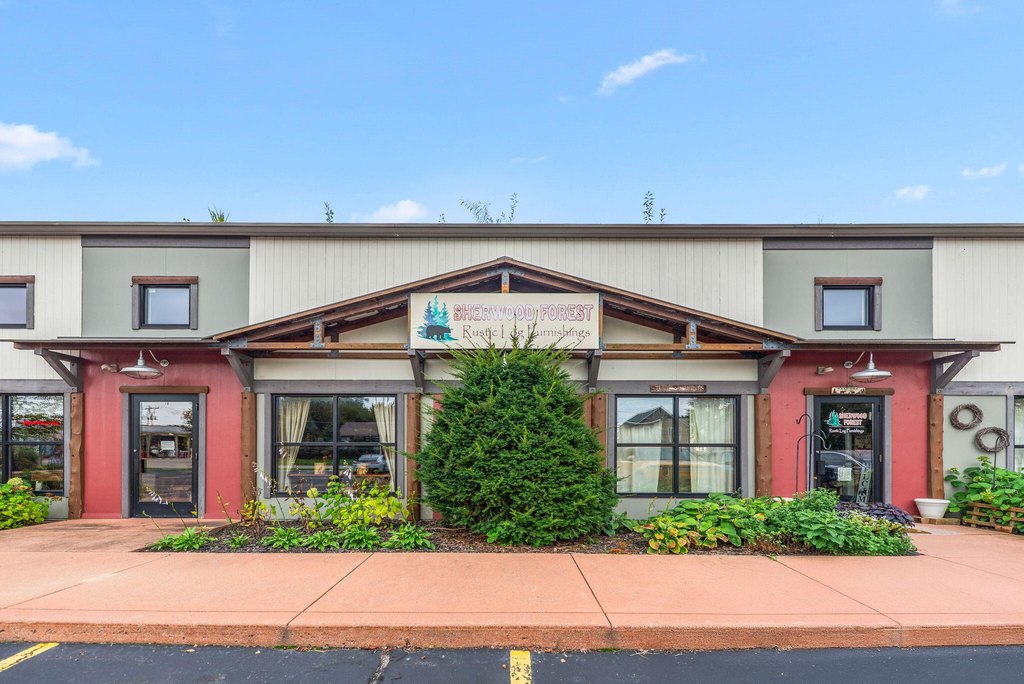
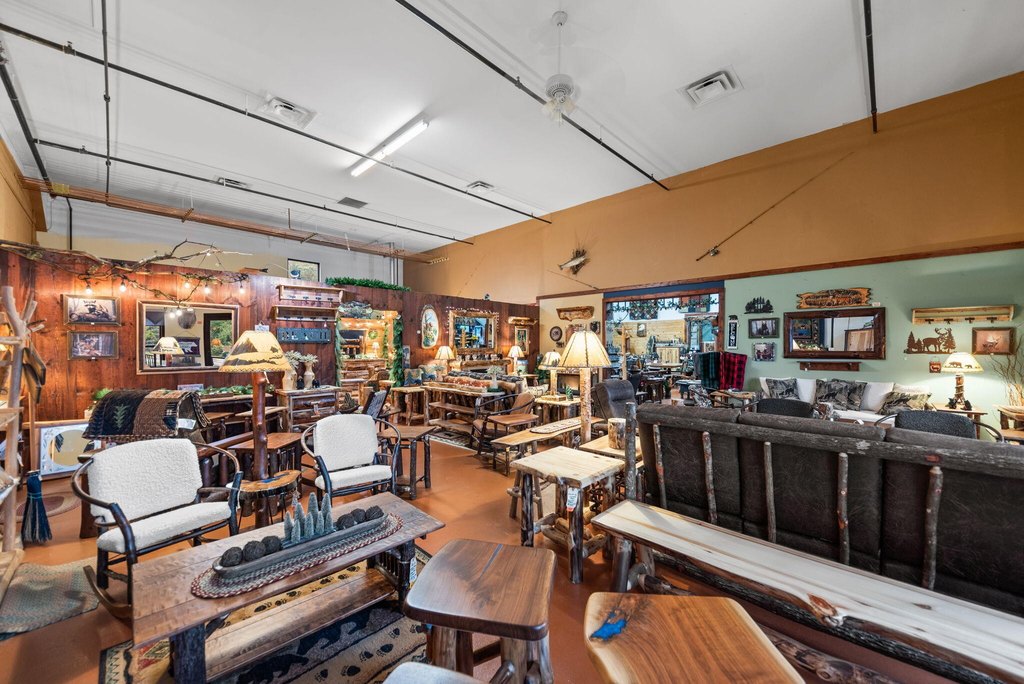
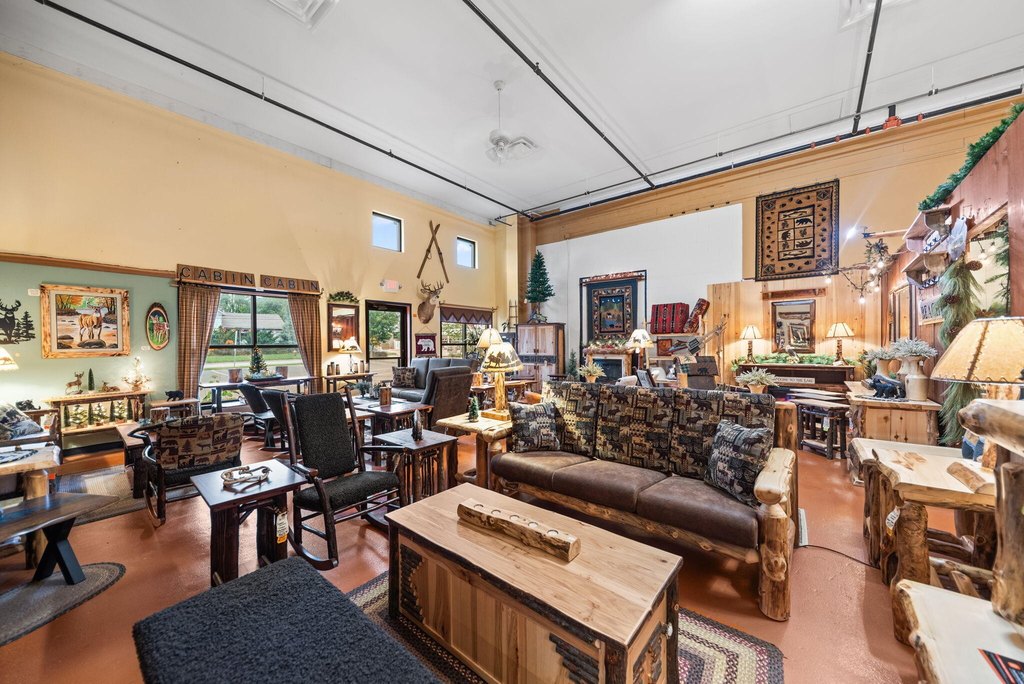
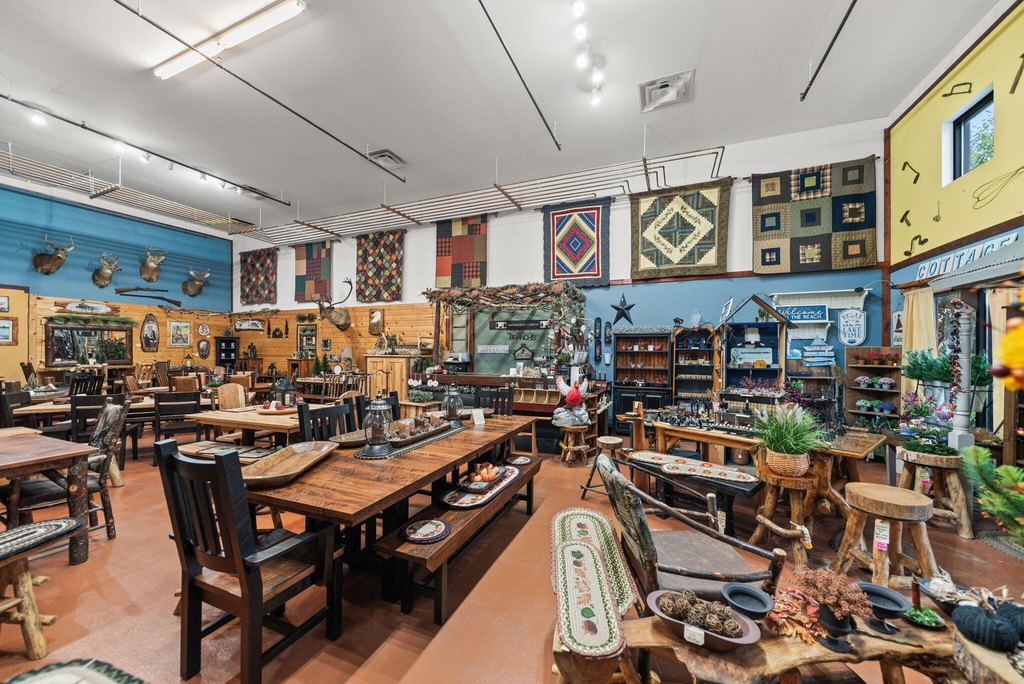
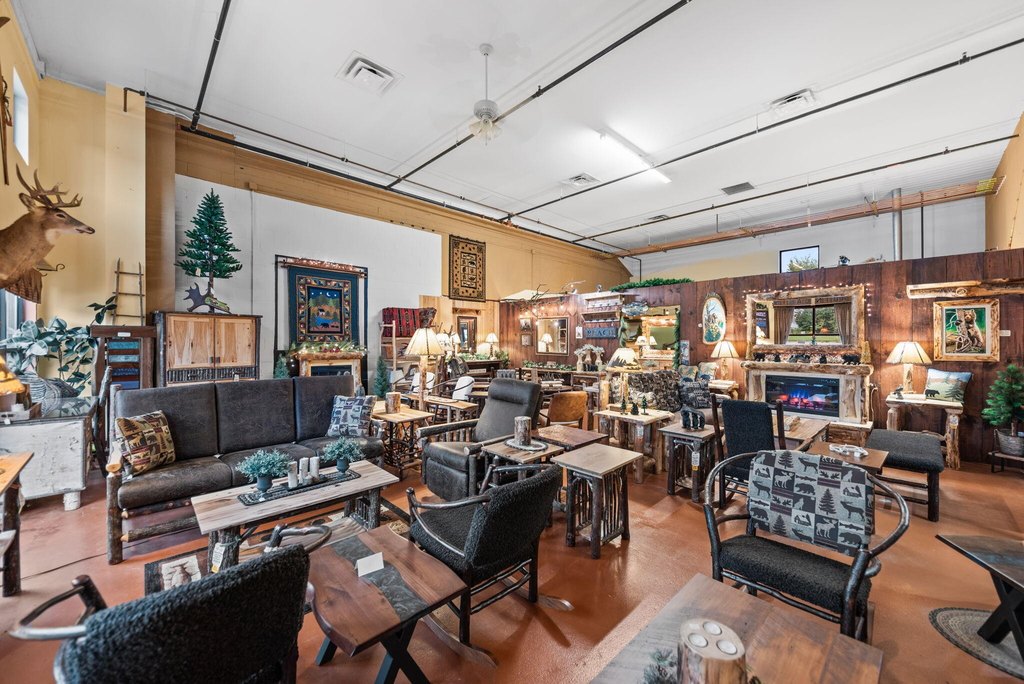
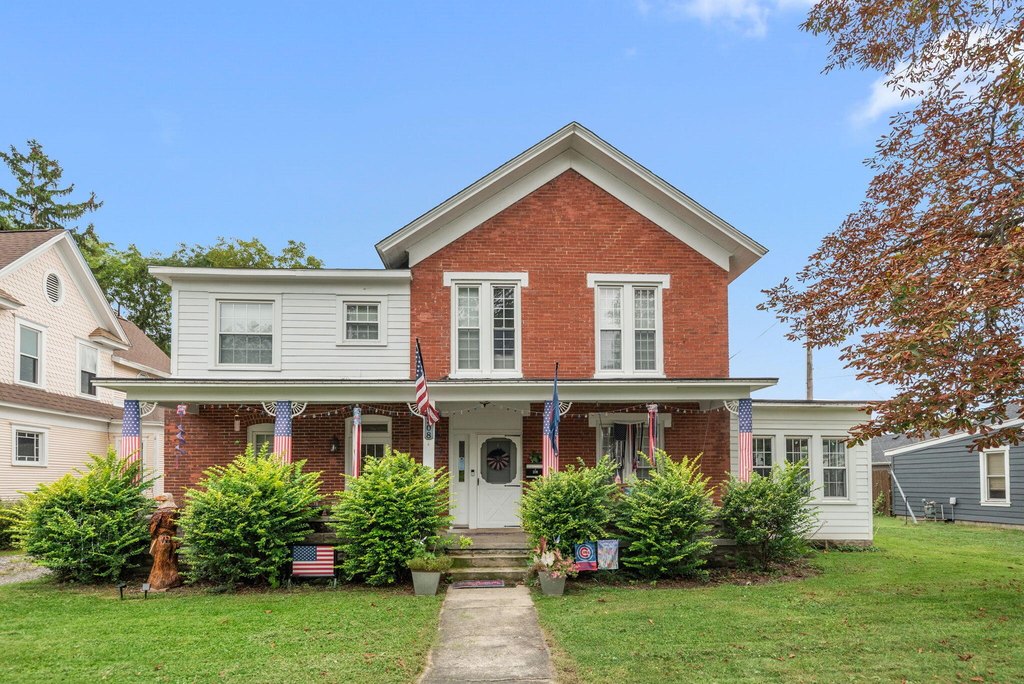
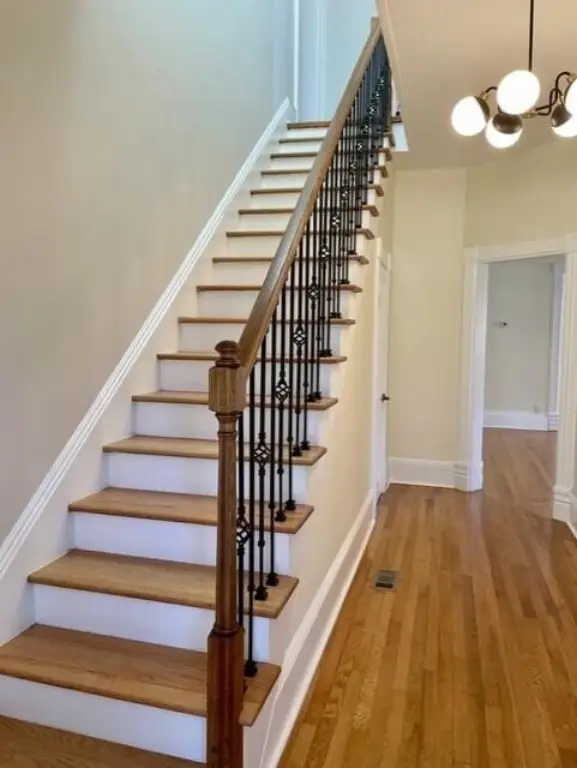
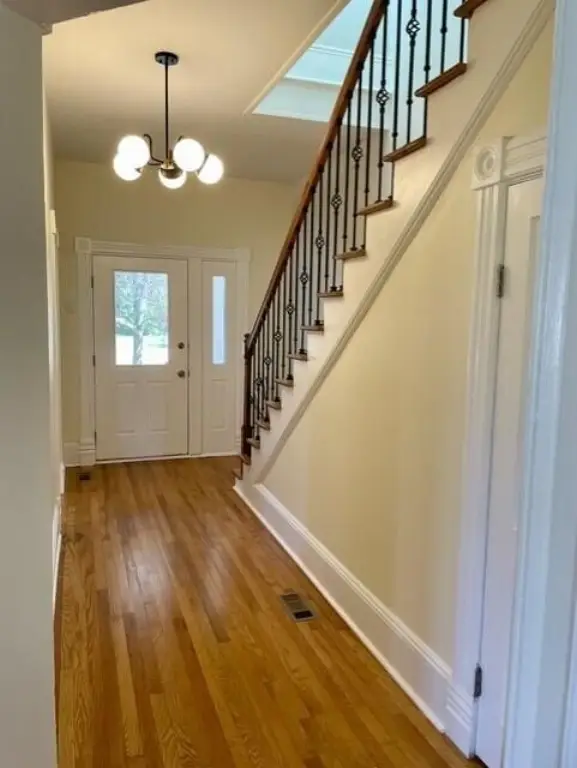
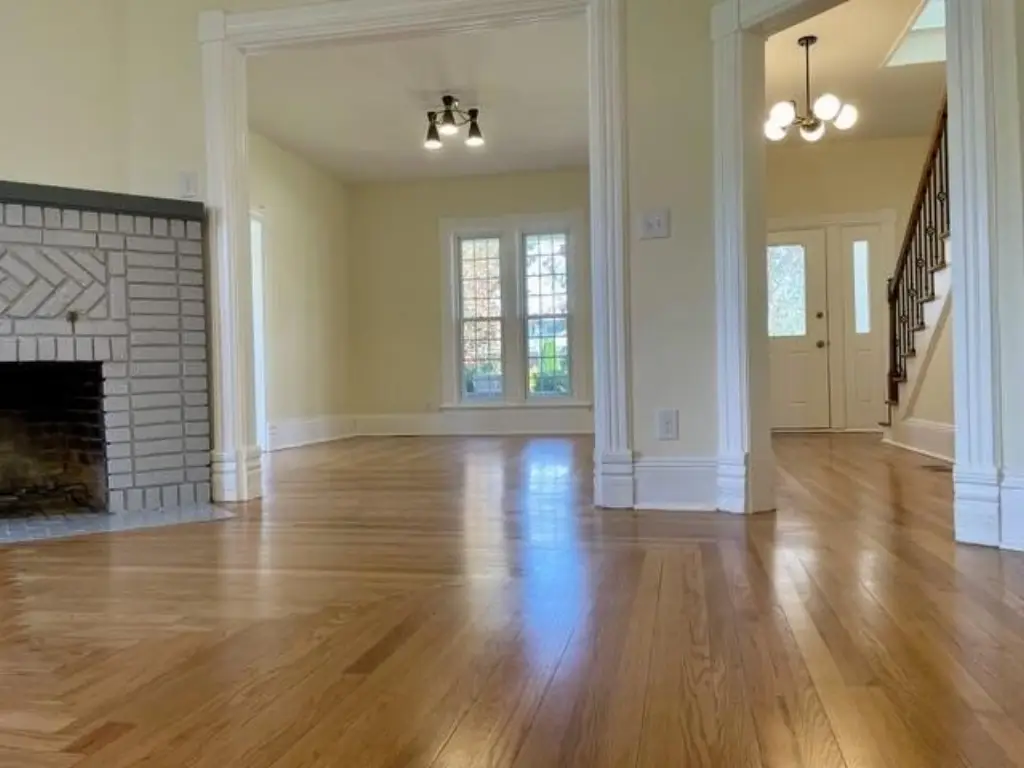
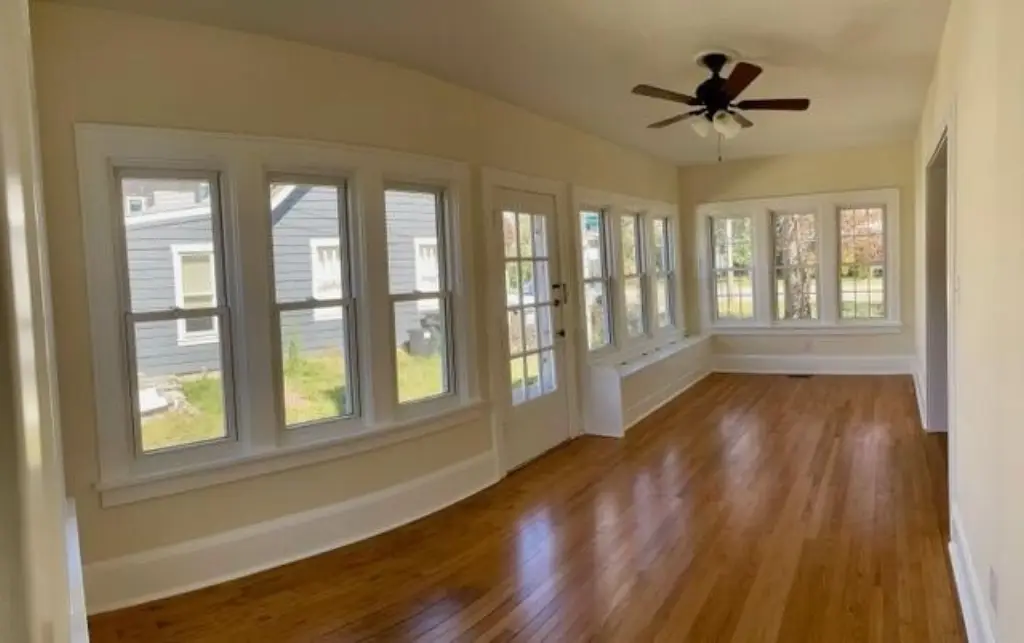
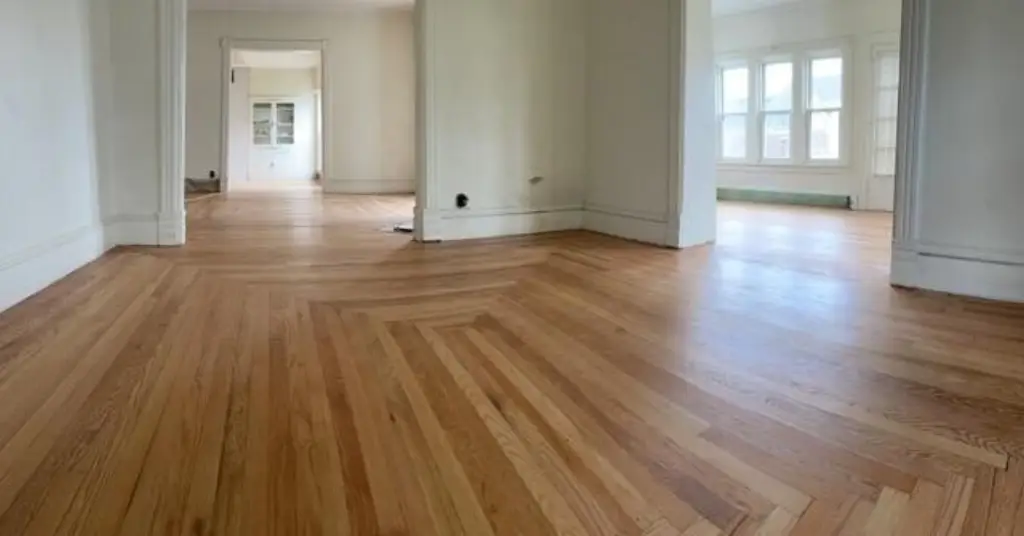
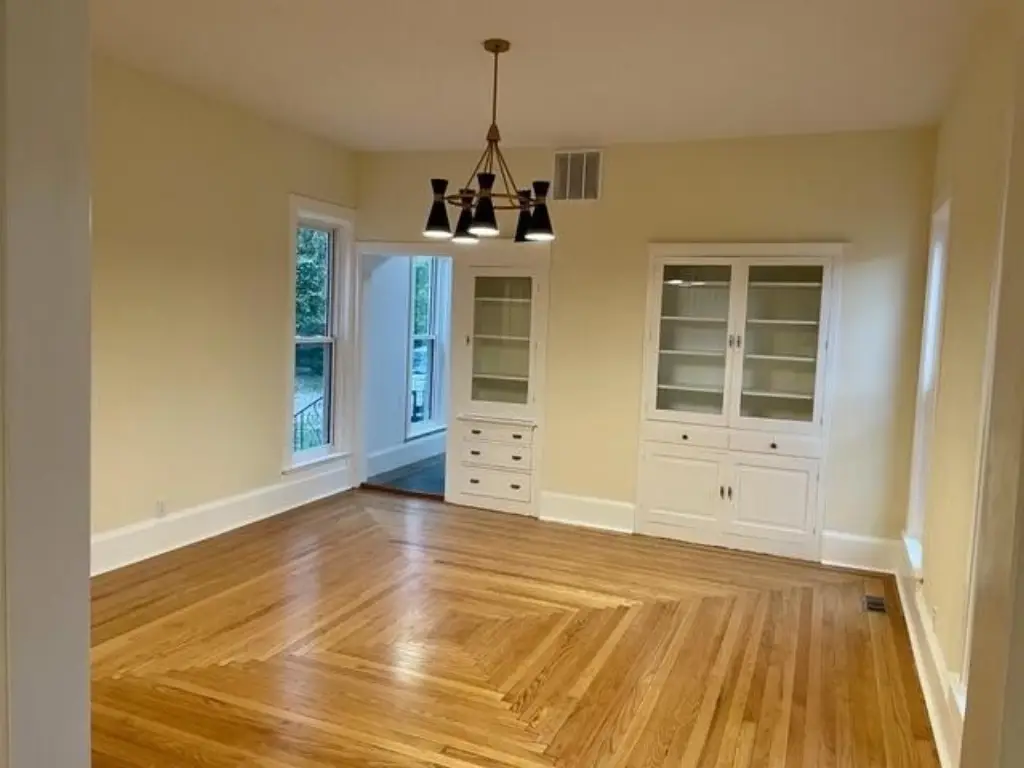
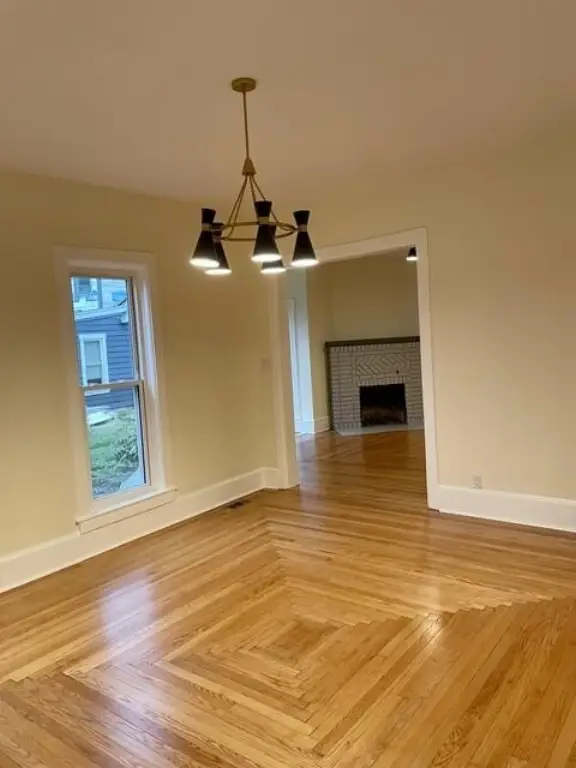
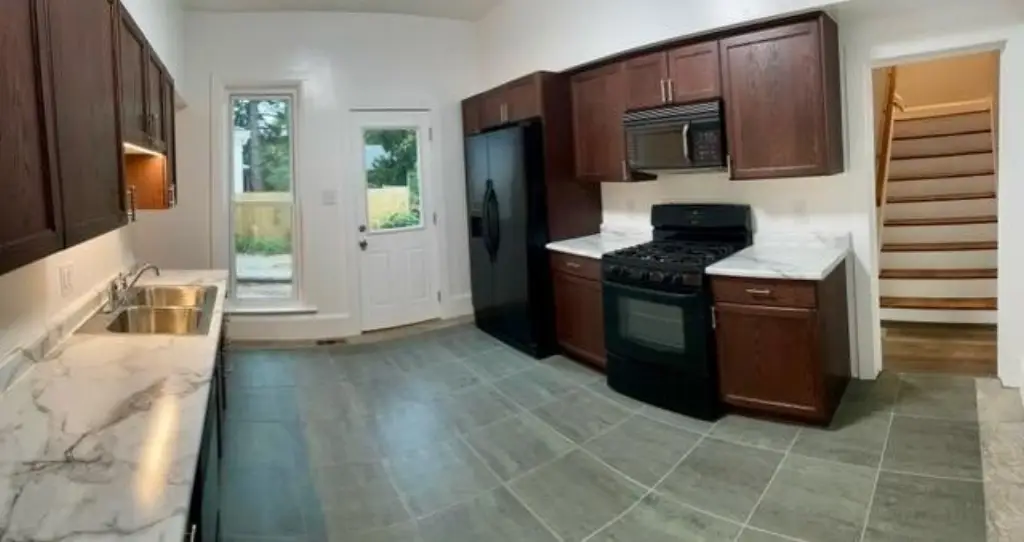
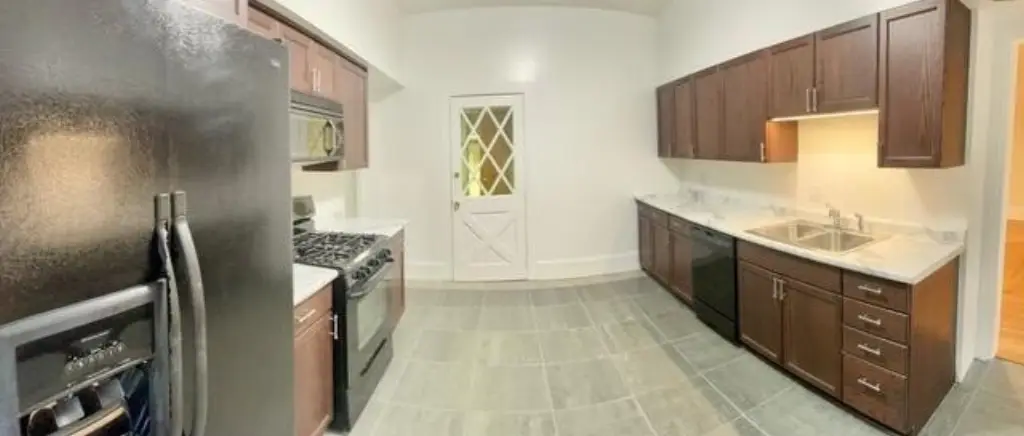
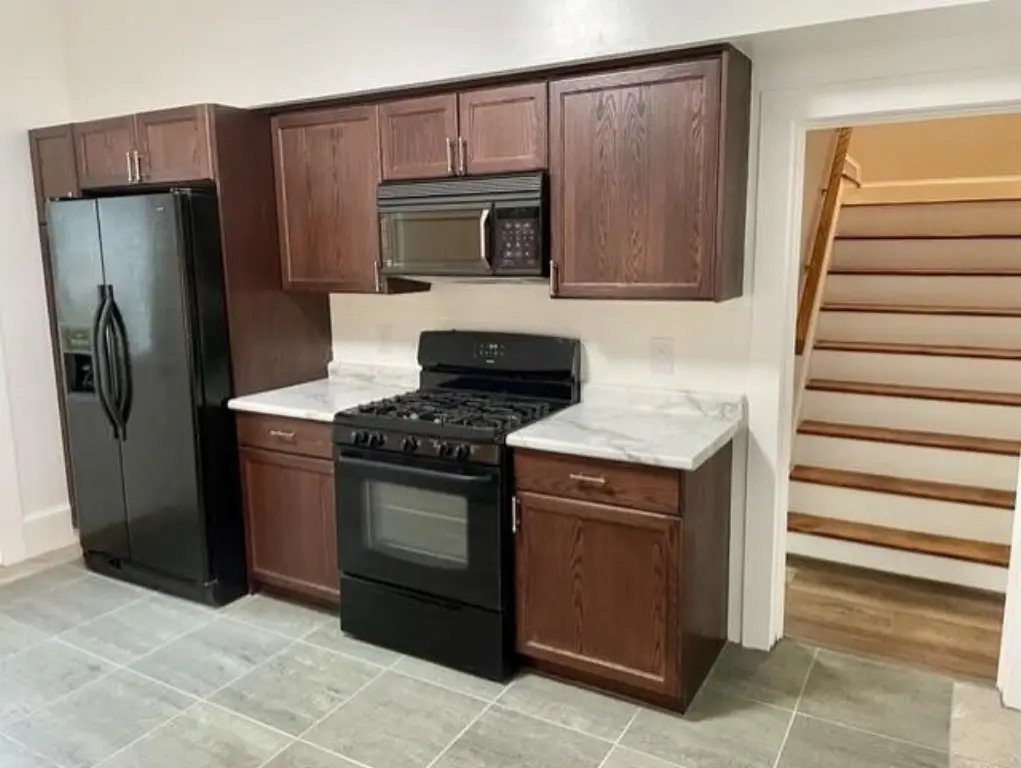
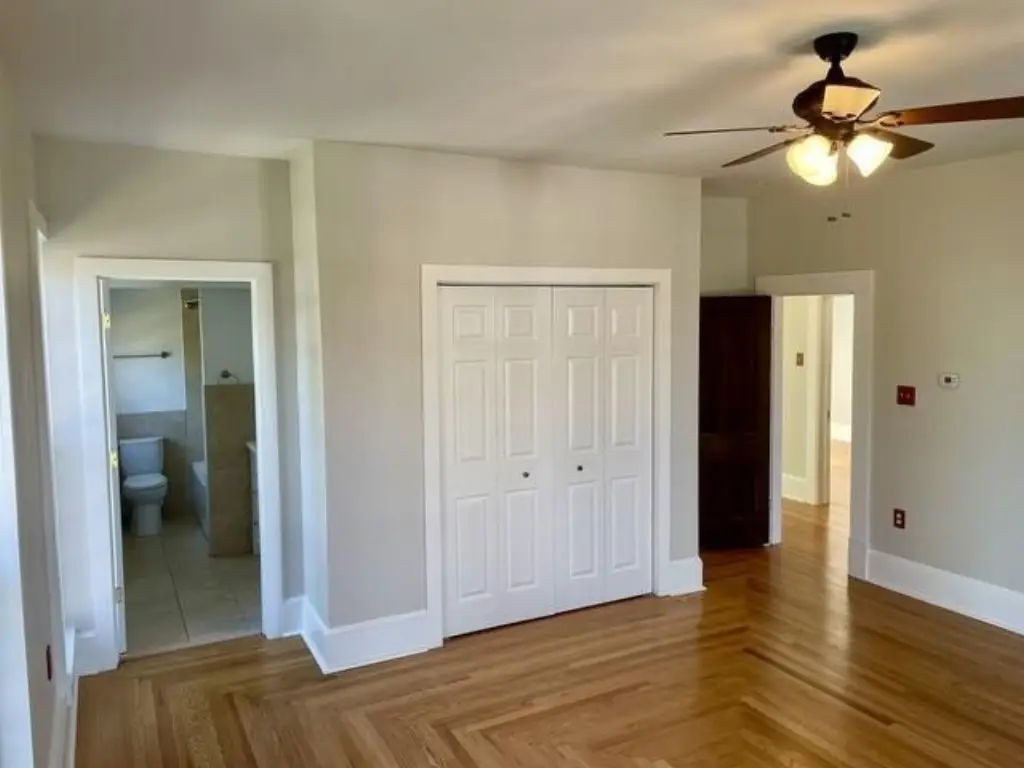
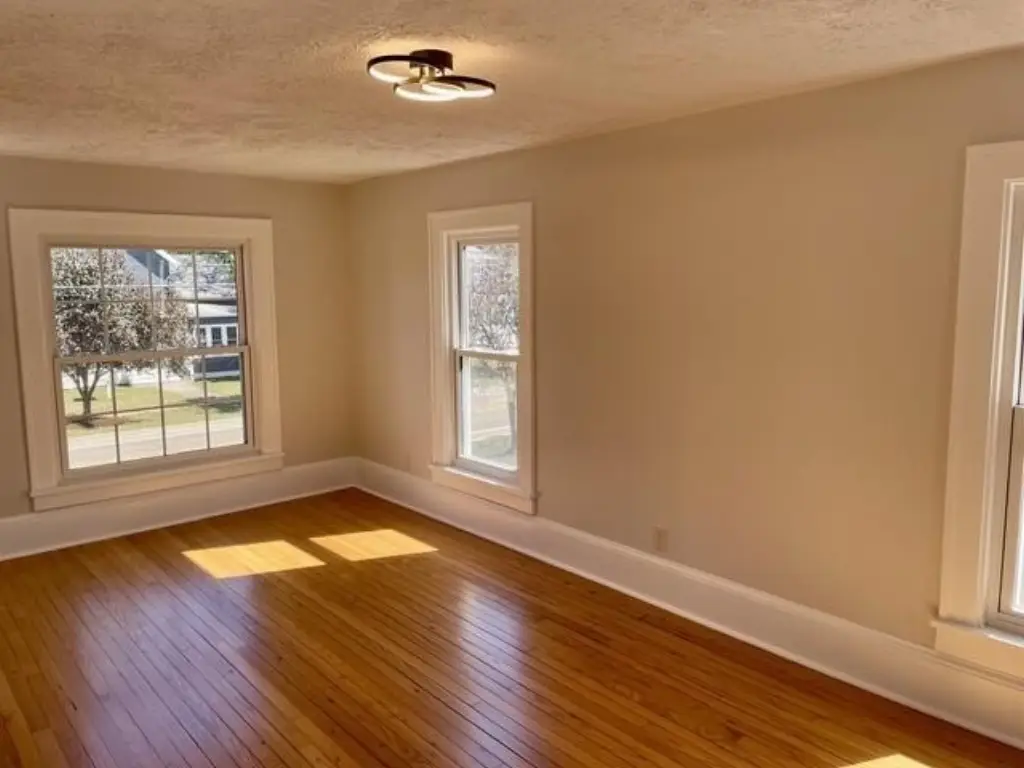
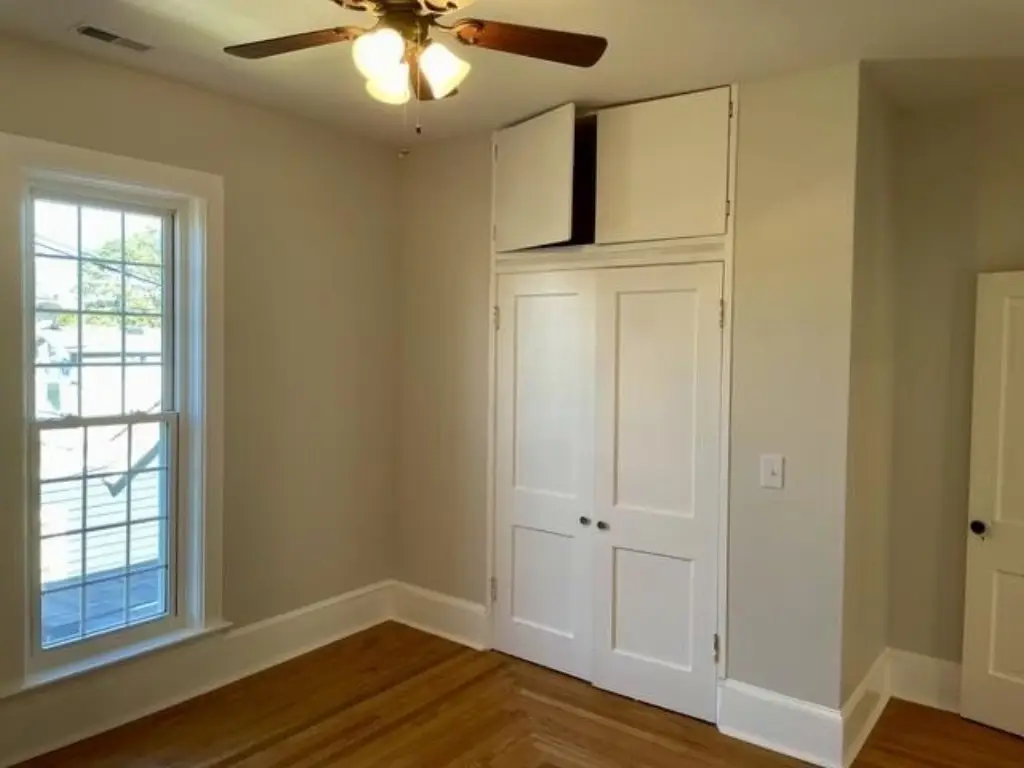
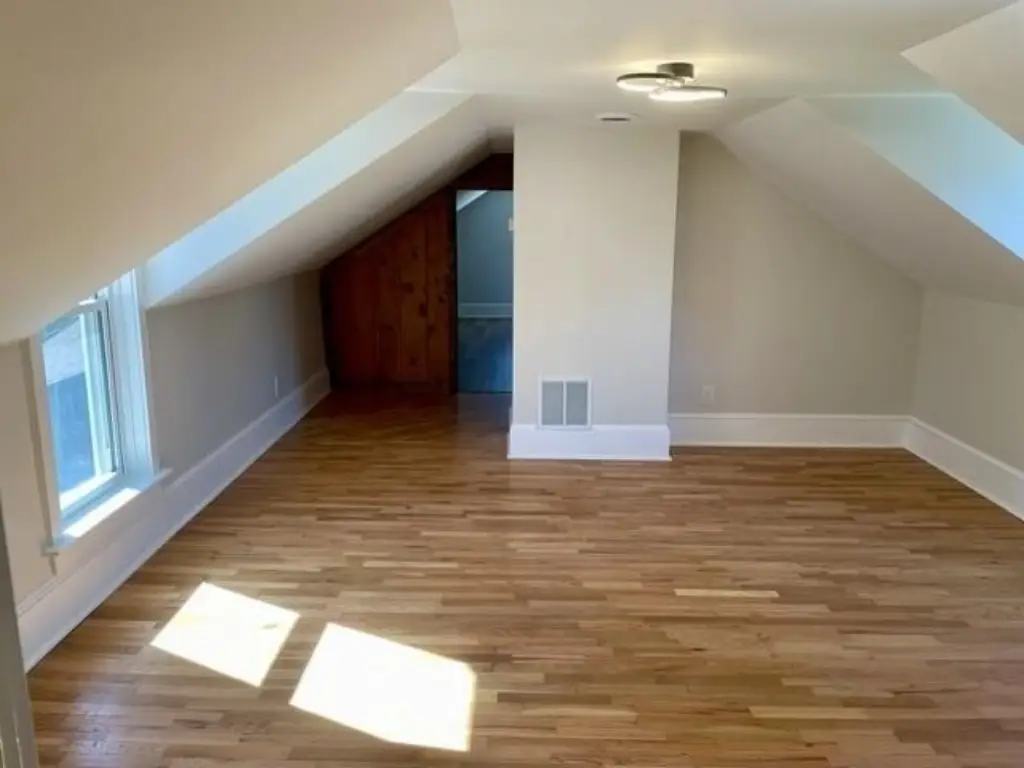
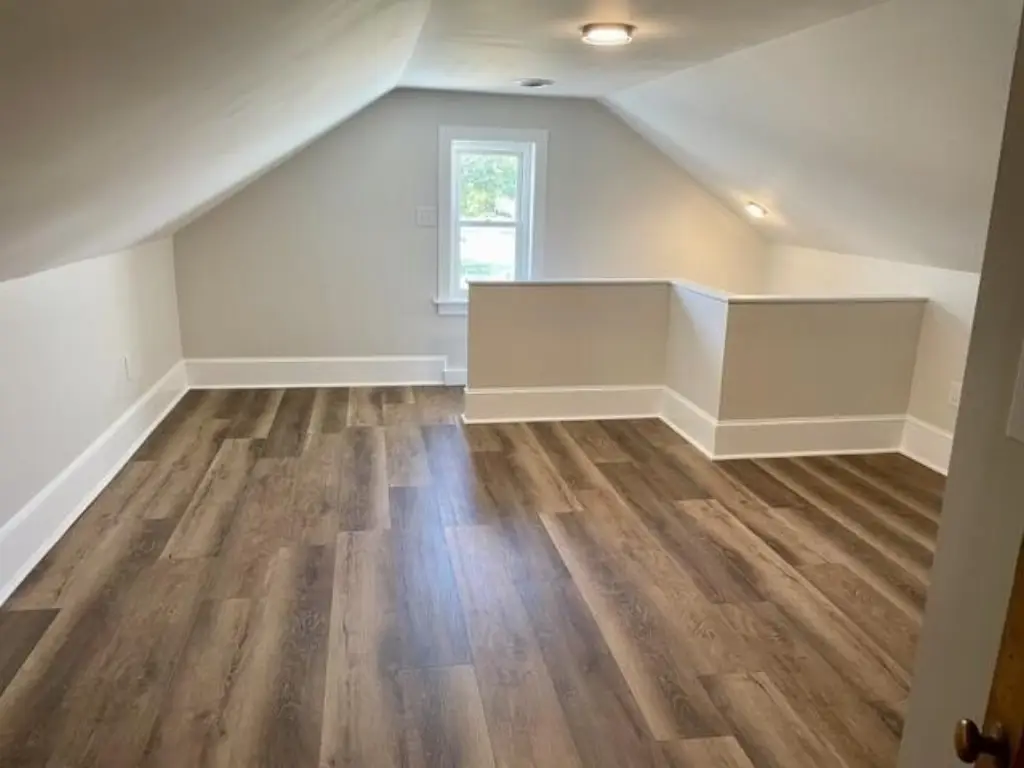
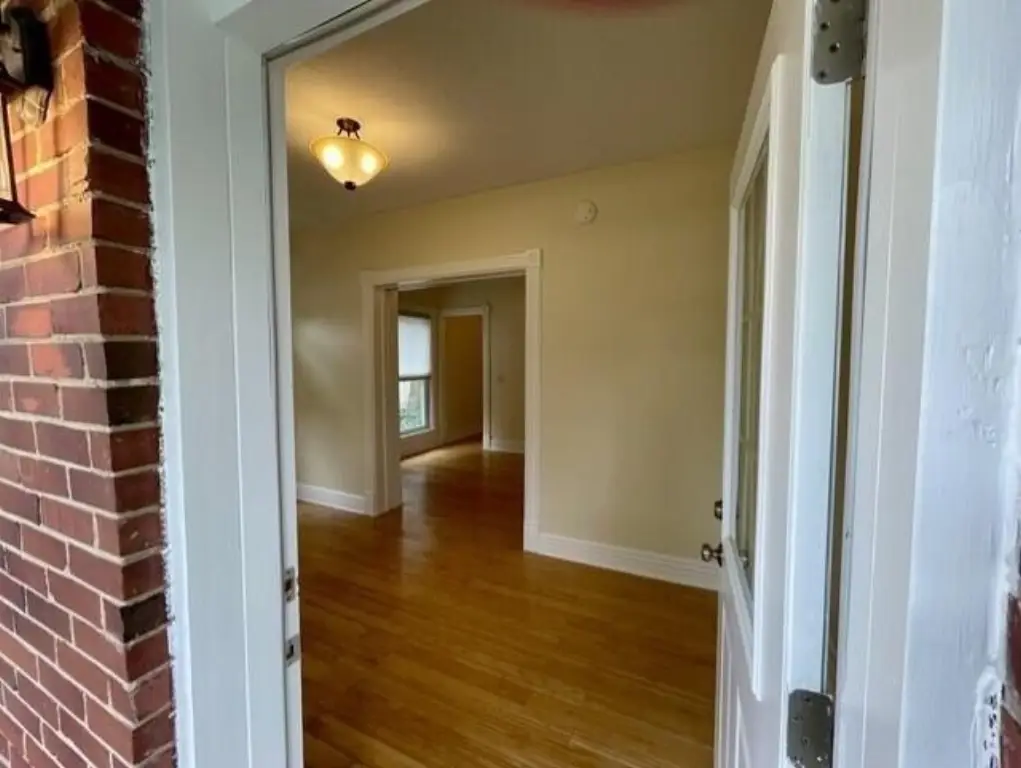
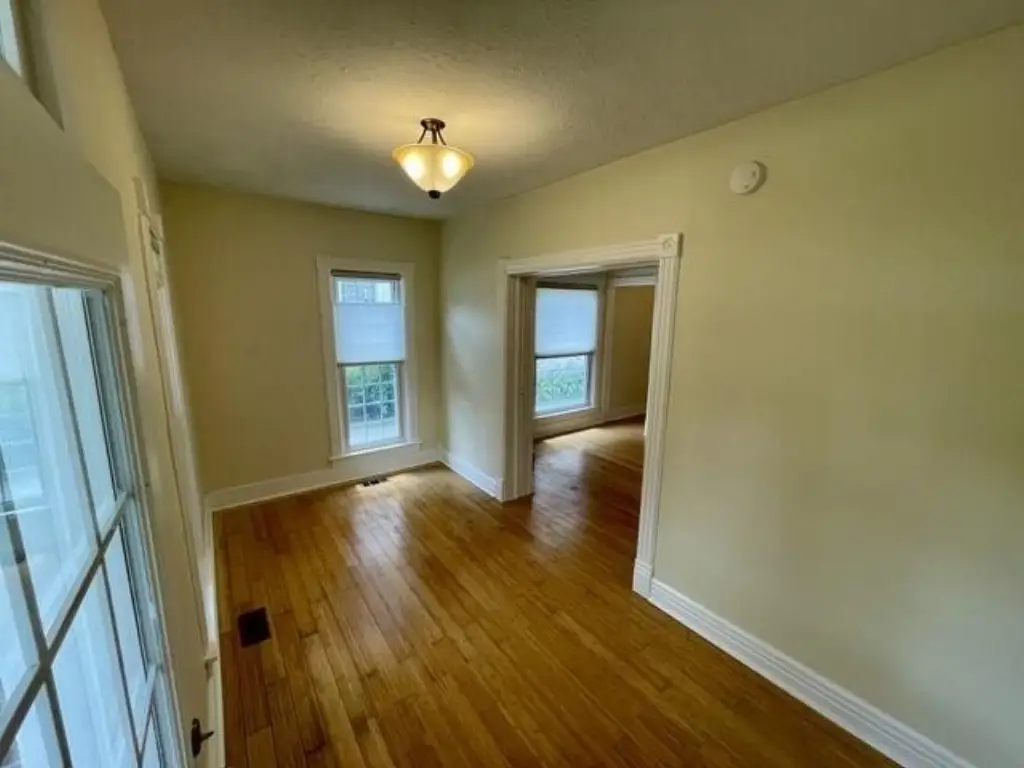
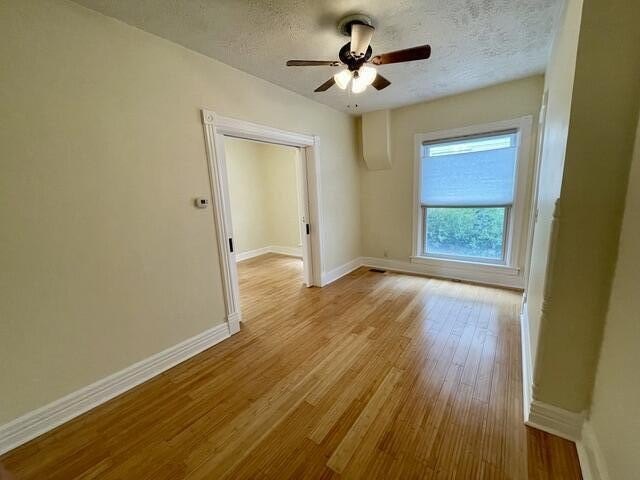
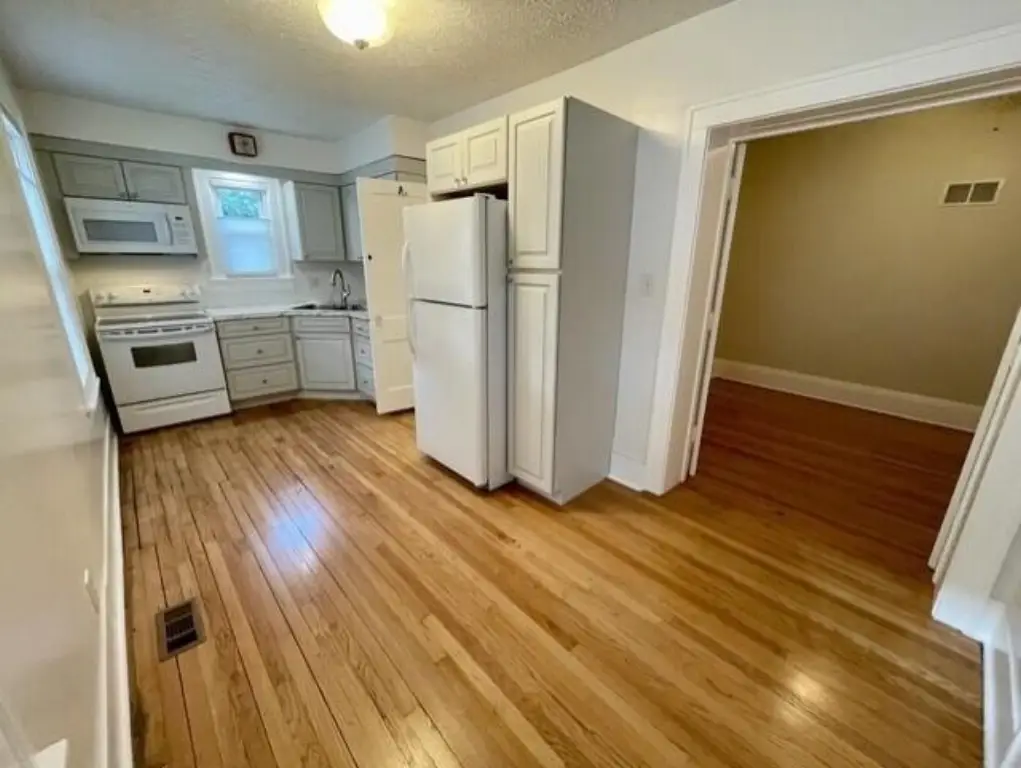
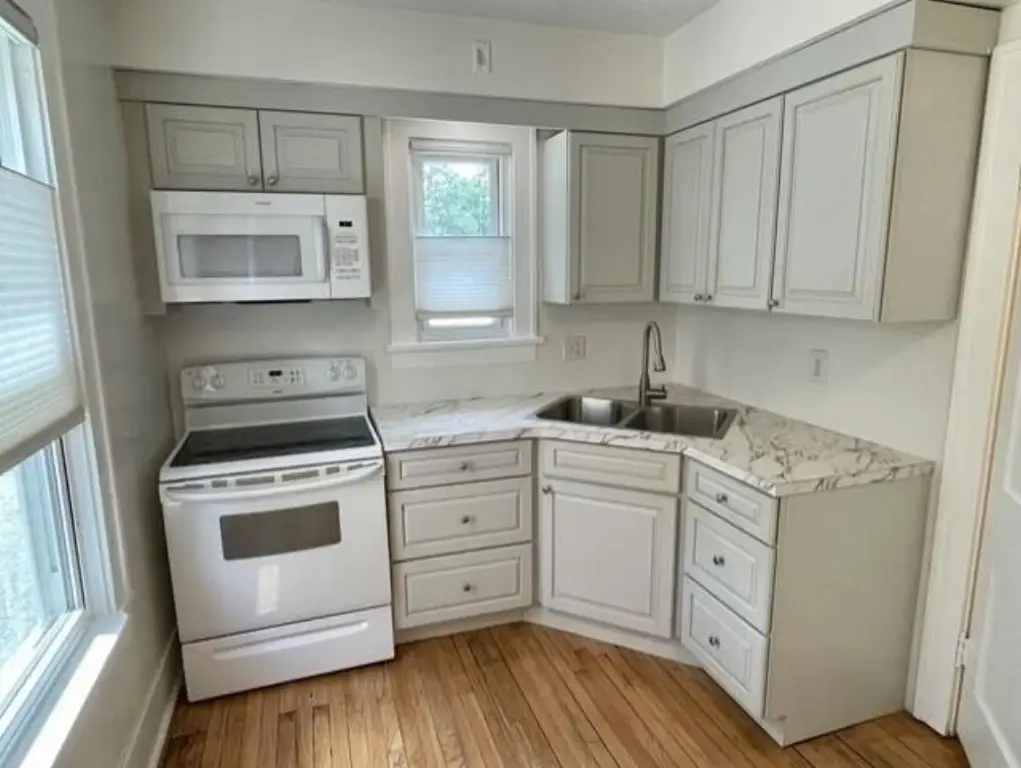
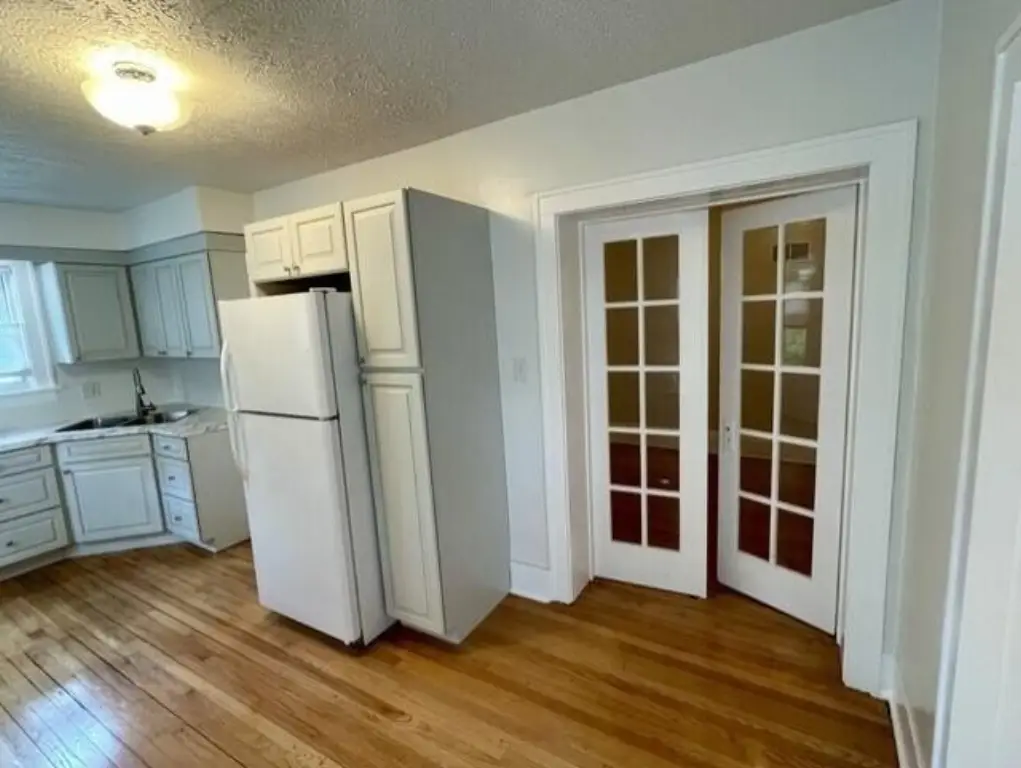
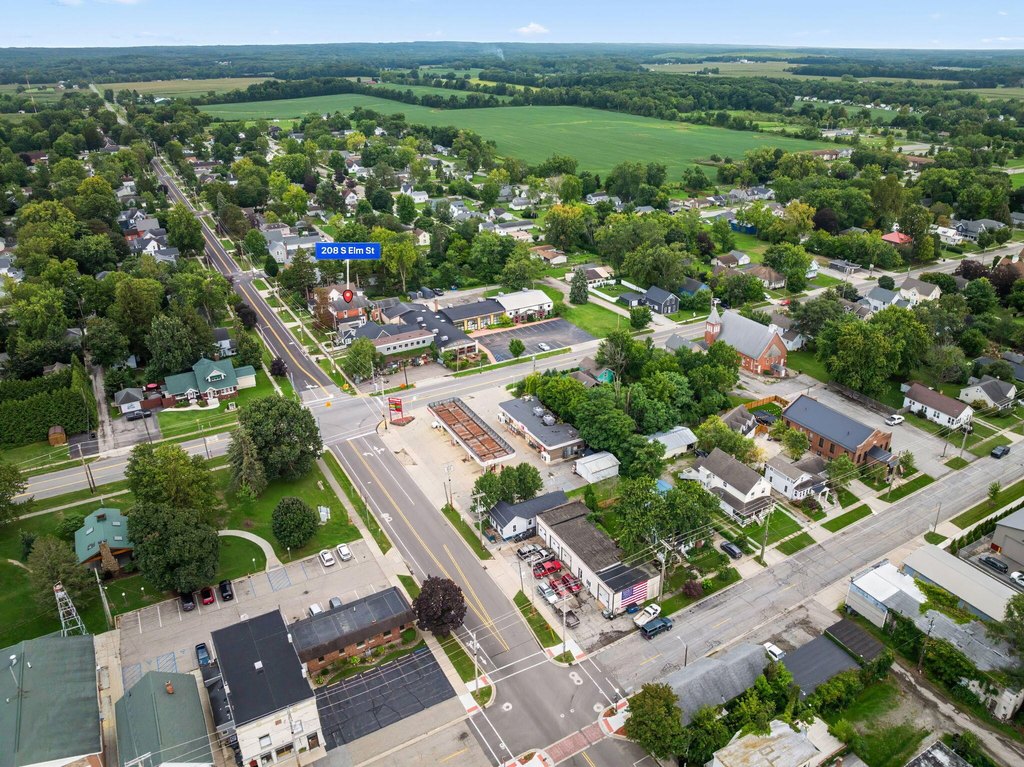
This mixed-use property combines occupied retail space, residential accommodations, and additional land within a single offering. The commercial building includes a restaurant, fitness center, and retail shop, with more than 9,000 square feet of retail area under one roof. A separate updated home facing South Elm Street includes an attached apartment suited to short- or long-term rental use or a live/work arrangement. The package also includes a 1,400-square-foot storage building.
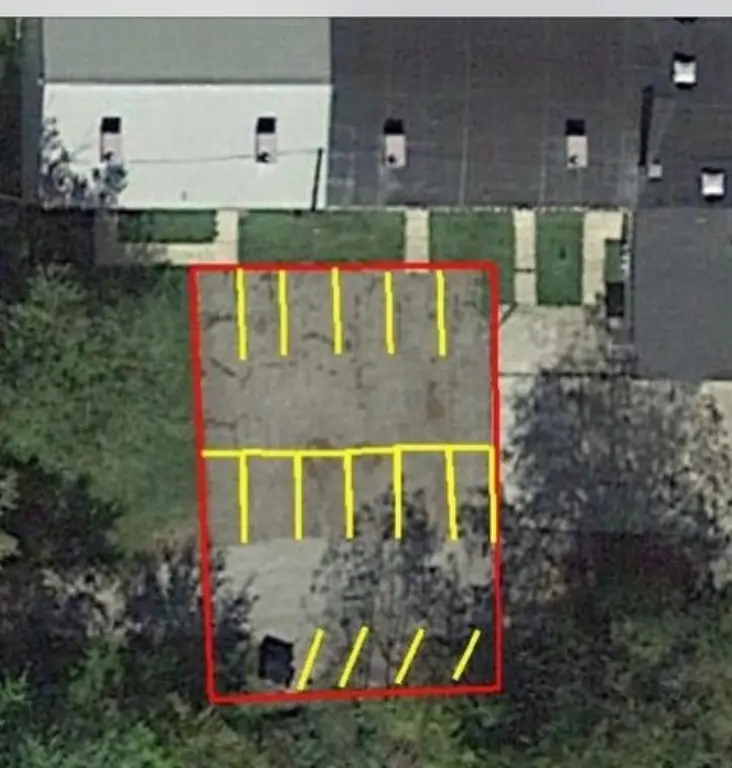
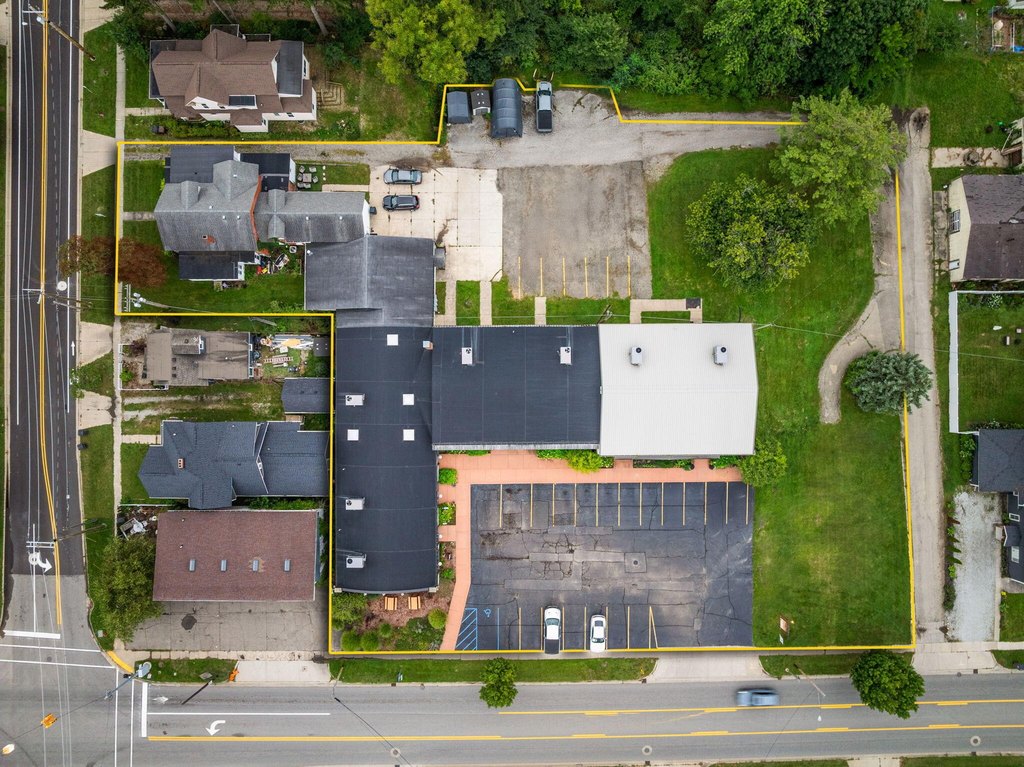
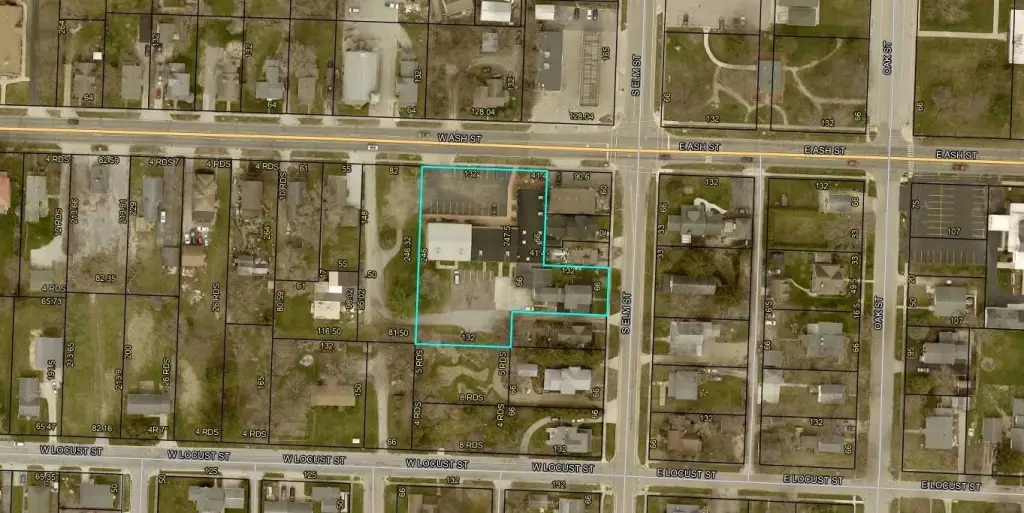
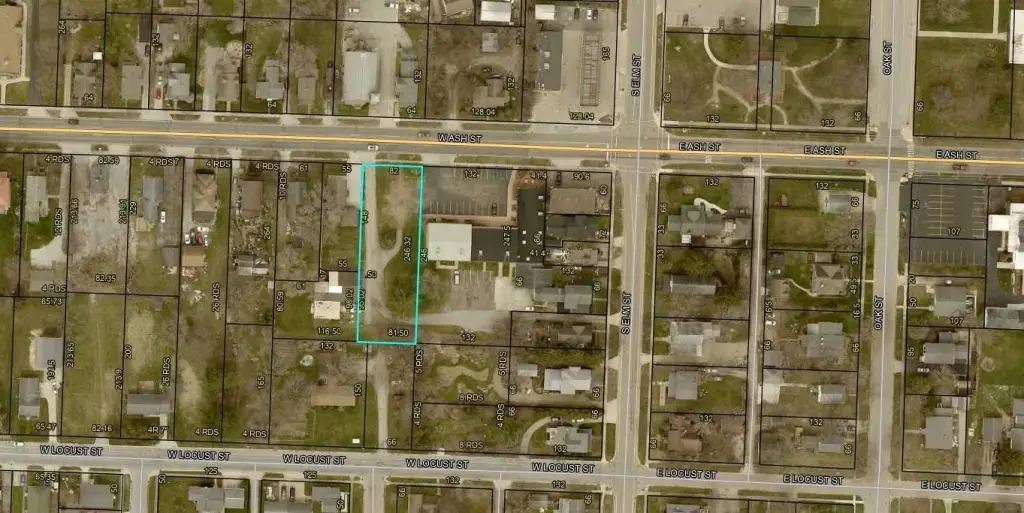
The property includes 132 feet of frontage on US-12, while the adjacent 1.54-acre parcel adds another 82 feet along the same route. The site is in Three Oaks, within Berrien County’s southwest Michigan tourism area, with Chicago approximately just over an hour away and South Bend/Notre Dame approximately 45 minutes away. Improvements feature wood siding and brick construction, forced-air heating, central air, broadband, and natural gas availability.
The property includes 132 feet of frontage on US-12, while the adjacent 1.54-acre parcel adds another 82 feet along the same route. The site is in Three Oaks, within Berrien County’s southwest Michigan tourism area, with Chicago approximately just over an hour away and South Bend/Notre Dame approximately 45 minutes away. Improvements feature wood siding and brick construction, forced-air heating, central air, broadband, and natural gas availability.
Key Highlights
- >9,000 square feet of occupied retail space under one roof
- Restaurant, fitness center, and retail shop included
- 132 feet of frontage on US‑12
Financial Insights
Estimated NOI and Cap Rate
NOI / Yr
$171,015
Cap Rate
8.66%
Suggested Prices Based on Cap Rates
Cap Rate 5%
$3,420,300
$3.4M
Cap Rate 7%
$2,443,071
$2.4M
Cap Rate 9%
$1,900,167
$1.9M
Market Conditions
NOI Build-Up for 16,474 SF
Gross rent
$255.0K $15.48/SF
− Vacancy
−$10.7K −$0.65/SF
EGI
$244.3K $14.83/SF
− OpEx
−$73.3K −$4.45/SF
NOI
$171.0K $10.38/SF
Area
Berrien County, MI
Vacancy
4.20%
Lease Rate
$15.48 /SF/Yr
Expense Ratio
30.00%
Simulate Cap Rate and NOI
Suggested Prices Based on Cap Rates
Cap Rate 5%
$3,420,300
Cap Rate 7%
$2,443,071
Cap Rate 9%
$1,900,167
Alternative Uses
Best Use
Retail
$2.44M
$2.14M – $2.85M
NOI $171,015 @ 7.0% cap · market cap 8.66%
Second Best
Mixed Use
$2.38M
$2.08M – $2.78M
NOI $166,799 @ 7.0% cap · market cap 8.45%
Theoretical Best
Office A
$3.47M
$3.03M – $4.04M
NOI $242,660 @ 7.0% cap · market cap 12.29%
Zoning and permitted uses should be independently verified with authorities.
Property Analytics
Unlock full access to Insights
Subscribe to Realmo Intelligence
Open Analytics
Current Use
Lease Details
Multi-tenant
Tenancy
Location Intelligence
Trade Area within ½ mile
212
Businesses Nearby
Explore this area
Business Placement
Demographics for 49128, MI
3,448
Population
1,929
Households
1.8
Avg Household Size
52
Median Age
24%
College-Educated
94%
High-School Grad
43.7 sq mi
ZIP Area
79
Density / Sq Mi
$73,023
Median Household Income
$41,460
Median Earnings
$984
Median Rent
$247,000
Median Home Value
Check the figures for this property
Cap Rate, Value Estimation, Potential NOI and more
View Realmo Analytics
Market
Vacancy Rate% for Multifamily in Midwest region

Questions? Ask Rey
Realmo’s AI knows this listing — price, zoning, demand, history. Ask anything.


Frequently Asked Questions
What type of property is this?
Mixed-use property - Combined retail, residential, and storage improvements with additional land along US-12 in Three Oaks.
Where is this mixed-use property located?
The property is located at 208 S Elm Street Three Oaks, MI.
What is the asking price?
The asking price for this property is $1,975,000.
What are key features of this property?
This property features: >9,000 square feet of occupied retail space under one roof; Restaurant, fitness center, and retail shop included; 132 feet of frontage on US‑12


