Triplex with Converted Garage
For Sale
$1,350,000
2030 Denton, San Gabriel, CA 91776
Three occupied units on one lot offer flexible living and rental arrangements for investors or owner-occupants.
Property Size3,182 SF
Days on Market123
Property Features for 2030 Denton
General Information
Standard status
Active
Size
3,182 SF
Property subtype
Duplex
Building Details
Building Size
3,182 SF
Year Built
1973
Listing Agency:
PINNACLE REAL ESTATE GROUP
Listed By:
Paul Siu · License #01221460
(626) 926-4880
Source:
Archetyperealty
Added: Jun 18
Changed: Oct 4
Last Checked: Oct 16 at 2:50PM
Displayed information is deemed reliable but is not guaranteed and should be independently verified. All listing content including descriptions, pricing, images are the copyrighted material of PINNACLE REAL ESTATE GROUP

Ask AI about this property
Review the available facts, identify missing information and prepare questions for the agent.
Investment Insights
Based on property information with market context.
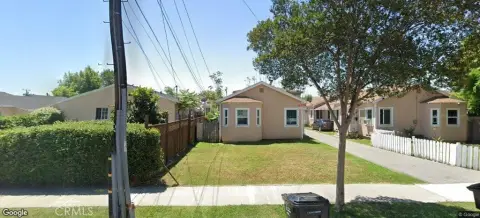
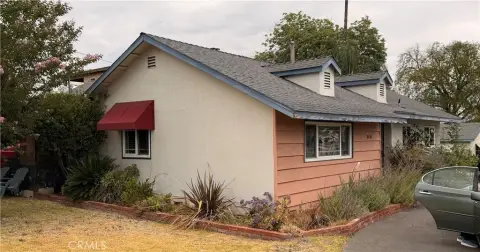
This triplex consists of two separate homes on one lot, plus a converted rear garage unit. The front home features 2 bedrooms and 2 bathrooms and includes an attached 2-car garage. The rear home, built in 1984, provides 4 bedrooms and 3 bathrooms. In addition, the rear garage has been converted into a 1-bedroom, 1-bathroom unit without permits. Buyers are advised to verify all permits, uses, and square footage with the appropriate authorities, including any potential for an accessory dwelling unit (ADU) subject to buyer verification and city approval.
The property is conveniently located between Del Mar Avenue and San Gabriel Boulevard, with easy access to the 10 Freeway. It is within walking distance to shopping, markets, and public transportation.
All three units are currently occupied by long-term tenants, supporting a stable rental setup for investors. The layout also suits owner-occupants or multi-generational households looking to live in one unit while utilizing additional on-site residences. Because the garage conversion is reported as unpermitted, due diligence on permitting and use is important for any buyer evaluating rentability and future options.
The property is conveniently located between Del Mar Avenue and San Gabriel Boulevard, with easy access to the 10 Freeway. It is within walking distance to shopping, markets, and public transportation.
All three units are currently occupied by long-term tenants, supporting a stable rental setup for investors. The layout also suits owner-occupants or multi-generational households looking to live in one unit while utilizing additional on-site residences. Because the garage conversion is reported as unpermitted, due diligence on permitting and use is important for any buyer evaluating rentability and future options.
Key Highlights
- Two separate homes on one lot: front 2BR/2BA with attached 2‑car garage and rear unit with 4BR/3BA
- Rear garage conversion includes a 1BR/1BA unit without permits—buyers should verify permits, uses, and square footage
- Built in 1984 for the rear unit
Financial Insights
Estimated NOI and Cap Rate
NOI / Yr
$55,569
Cap Rate
4.12%
Suggested Prices Based on Cap Rates
Cap Rate 5%
$1,111,380
$1.1M
Cap Rate 7%
$793,843
$793.8K
Cap Rate 9%
$617,433
$617.4K
Market Conditions
NOI Build-Up for 3,182 SF
Gross rent
$85.9K $27.00/SF
− Vacancy
−$6.5K −$2.05/SF
EGI
$79.4K $24.95/SF
− OpEx
−$23.8K −$7.48/SF
NOI
$55.6K $17.46/SF
Area
Los Angeles County, CA
Vacancy
7.60%
Lease Rate
$27.00 /SF/Yr
Expense Ratio
30.00%
Simulate Cap Rate and NOI
Suggested Prices Based on Cap Rates
Cap Rate 5%
$1,111,380
Cap Rate 7%
$793,843
Cap Rate 9%
$617,433
Alternative Uses
Best Use
Multifamily LT 5
$793.8K
$694.6K – $926.2K
NOI $55,569 @ 7.0% cap · market cap 4.12%
Second Best
Apartment 5plus
$731.4K
$640.0K – $853.4K
NOI $51,201 @ 7.0% cap · market cap 3.79%
Theoretical Best
Office A
$1.70M
$1.49M – $1.99M
NOI $119,254 @ 7.0% cap · market cap 8.83%
Zoning and permitted uses should be independently verified with authorities.
How Realmo checks its estimates
Property Analytics
Unlock full access to Insights
Subscribe to Realmo Intelligence
Open Analytics
Current Use
Location Intelligence
Trade Area within ½ mile
1,750
Businesses Nearby
Explore this area
Business Placement
Demographics for 91776, CA
38,031
Population
12,806
Households
3
Avg Household Size
42
Median Age
29%
College-Educated
76%
High-School Grad
3.3 sq mi
ZIP Area
11,525
Density / Sq Mi
$79,926
Median Household Income
$37,548
Median Earnings
$1,825
Median Rent
$816,400
Median Home Value
Check the figures for this property
Cap Rate, Value Estimation, Potential NOI and more
View Realmo Analytics
Market
Vacancy Rate% for Multifamily in West region




Frequently Asked Questions
What type of property is this?
Triplex - Three occupied units on one lot offer flexible living and rental arrangements for investors or owner-occupants.
Where is this triplex located?
The property is located at 2030 Denton San Gabriel, CA.
What is the asking price?
The asking price for this property is $1,350,000.
What are key features of this property?
This property features: Two separate homes on one lot: front 2BR/2BA with attached 2‑car garage and rear unit with 4BR/3BA; Rear garage conversion includes a 1BR/1BA unit without permits—buyers should verify permits, uses, and square footage; Built in 1984 for the rear unit


