Luxury Mixed-Use Asset in
For Sale
$2,599,000
2028 W Cary St, Richmond, VA 23220
Rare, renovated mixed-use property in Richmond's sought-after Fan District.
Property Size9,100 SF
Price / SF$285.60
Days on Market186
Property Features for 2028 W Cary St
General Information
Standard status
Active
Size
9,100 SF
Site & Location
Neighborhood
Bydp
Building Details
Year Built
2015
Listing Agency:
One South Commercial LLC
Listed By:
Thomas Rosman · License #0225268571
(804) 539-3017
Source:
Ruckartre
Added: Apr 24
Changed: Oct 26
Last Checked: Oct 7 at 1:08PM
Displayed information is deemed reliable but is not guaranteed and should be independently verified. All listing content including descriptions, pricing, images are the copyrighted material of One South Commercial LLC

Ask AI about this property
Review the available facts, identify missing information and prepare questions for the agent.
Investment Insights
Based on property information with market context.
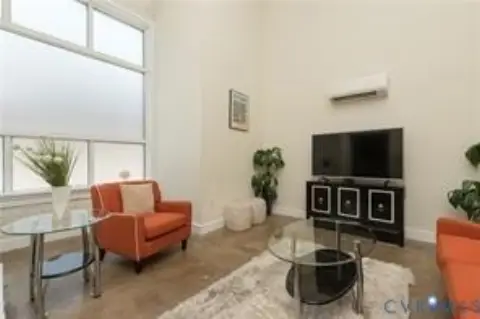
Located in Richmond's Fan District, 2028 W Cary Street presents a rare opportunity to own a renovated mixed-use asset. This award-winning project, designed by David Johannas of Johannas Design Group, blends historic and modern design. The property is situated in a central location with access to amenities, walkable to Carytown and the Cary Street Station mixed-use community. It offers a luxury investment with potential for rent and value appreciation. The apartments feature one- to three-bedroom floor plans with condo-grade finishes, multi-level layouts, preserved historic elements, commercial-grade windows and doors, and private balcony or patio space. The property may be suitable for condo conversion in the future. This low-maintenance asset is suitable for an owner-occupant or multifamily investor, offering a turn-key investment with a diversified revenue stream. The location has a bike score of 65, making it bikeable, a walk score of 71, indicating it is very walkable, and a transit score of 40, suggesting some transit options are available.
Key Highlights
- Luxury renovated/new construction mixed‑use asset in the Fan District.
- Award‑winning "historic meets modern" design by David Johannas.
- Excellent central location walkable to Carytown and Cary Street Station.
Financial Insights
Estimated NOI and Cap Rate
NOI / Yr
$113,636
Cap Rate
4.37%
Suggested Prices Based on Cap Rates
Cap Rate 5%
$2,272,720
$2.3M
Cap Rate 7%
$1,623,371
$1.6M
Cap Rate 9%
$1,262,622
$1.3M
Market Conditions
NOI Build-Up for 9,100 SF
Gross rent
$202.0K $22.20/SF
− Vacancy
−$20.2K −$2.22/SF
EGI
$181.8K $19.98/SF
− OpEx
−$68.2K −$7.49/SF
NOI
$113.6K $12.49/SF
Area
Richmond, VA
Vacancy
10.00%
Lease Rate
$22.20 /SF/Yr
Expense Ratio
37.50%
Simulate Cap Rate and NOI
Suggested Prices Based on Cap Rates
Cap Rate 5%
$2,272,720
Cap Rate 7%
$1,623,371
Cap Rate 9%
$1,262,622
Alternative Uses
Best Use
Mixed Use
$1.62M
$1.42M – $1.89M
NOI $113,636 @ 7.0% cap · market cap 4.37%
Second Best
Apartment 5plus
$1.61M
$1.41M – $1.88M
NOI $112,735 @ 7.0% cap · market cap 4.34%
Theoretical Best
Office A
$2.10M
$1.84M – $2.45M
NOI $147,168 @ 7.0% cap · market cap 5.66%
Zoning and permitted uses should be independently verified with authorities.
How Realmo checks its estimates
Property Analytics
Unlock full access to Insights
Subscribe to Realmo Intelligence
Open Analytics
Current Use
Location Intelligence
Trade Area within ½ mile
1,656
Businesses Nearby
Explore this area
Business Placement
Demographics for 23220, VA
36,942
Population
16,561
Households
2.2
Avg Household Size
27
Median Age
59%
College-Educated
94%
High-School Grad
4.8 sq mi
ZIP Area
7,696
Density / Sq Mi
$56,681
Median Household Income
$33,249
Median Earnings
$1,354
Median Rent
$468,900
Median Home Value
Check the figures for this property
Cap Rate, Value Estimation, Potential NOI and more
View Realmo Analytics
Market
Vacancy Rate% for Multifamily in South region




Frequently Asked Questions
What type of property is this?
Mixed-use property - Rare, renovated mixed-use property in Richmond's sought-after Fan District.
Where is this mixed-use property located?
The property is located at 2028 W Cary St Richmond, VA.
What is the asking price?
The asking price for this property is $2,599,000.
What are key features of this property?
This property features: Luxury renovated/new construction mixed‑use asset in the Fan District.; Award‑winning "historic meets modern" design by David Johannas.; Excellent central location walkable to Carytown and Cary Street Station.


