Downtown Richmond Mixed-Use
For Sale
$2,050,000
214-216 E Main St, Richmond, VA 23219
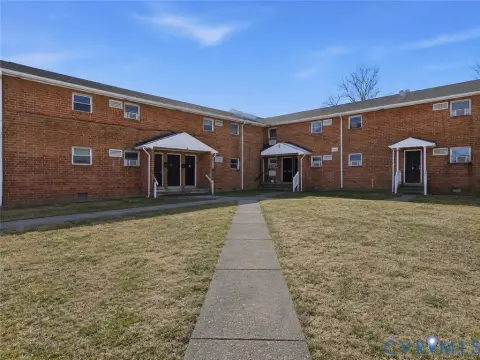
Renovated mixed-use property with retail and residential units.
Property Size6,504 SF
Days on Market186
Property Features for 214-216 E Main St
General Information
Standard status
Active
Size
6,504 SF
Property subtype
Commercial
Site & Location
Neighborhood
Mnwd
Building Details
Building Size
6,504 SF
Year Built
1920
Stories
2
Listing Agency:
Century 21 All American
Listed By:
Dorothy Branch · License #0225143152
(804) 874-7822
Source:
Elliman
Added: Apr 24
Changed: Oct 15
Last Checked: Oct 24 at 6:27PM
Displayed information is deemed reliable but is not guaranteed and should be independently verified. All listing content including descriptions, pricing, images are the copyrighted material of Century 21 All American

Ask AI about this property
Review the available facts, identify missing information and prepare questions for the agent.
Investment Insights
Based on property information with market context.
This mixed-use property in Downtown Richmond presents an investment or owner-occupant opportunity. The fully renovated property features two commercial storefronts and two residential apartments. The commercial spaces offer high-visibility storefronts with front and rear entrances. The second-floor apartments each include 3 bedrooms, 2 bathrooms, a full kitchen, and a family room with an open layout. Loft-style layouts combine historic charm with modern industrial finishes, including hardwood and ceramic tile flooring, stainless steel appliances, and in-unit washer/dryers. Each apartment has abundant natural light, an open-air design, and a private balcony with city views. The property is located in Richmond’s Historic Banking District, near VCU MCV Dominion and various dining and entertainment options. It is within walking distance of Virginia Commonwealth University, MCV Campus, the convention center, museums, Main Street Station, Browns Island, the State Capitol, the River Front Plaza canal, the Allianz Amphitheater, the James River canal, the Jefferson Hotel, premier dining and shopping, and the Carpenter Center. Interstate 95 and 64 are within minutes. The property includes 4 off-street parking spaces, separate front and rear entrances for all units, and 4 separate electric meters. The location has a bike score of 89, walk score of 83, and transit score of 63.
Key Highlights
- Rare dual‑income opportunity: Features 2 commercial storefronts and 2 spacious residential apartments.
- Prime Downtown Richmond location in the Historic Banking District, walking distance to VCU, MCV, entertainment, and major employers.
- Fully renovated with over $350,000 in renovations, offering a turnkey investment.
Financial Insights
Estimated NOI and Cap Rate
NOI / Yr
$81,219
Cap Rate
3.96%
Suggested Prices Based on Cap Rates
Cap Rate 5%
$1,624,380
$1.6M
Cap Rate 7%
$1,160,271
$1.2M
Cap Rate 9%
$902,433
$902.4K
Market Conditions
NOI Build-Up for 6,504 SF
Gross rent
$144.4K $22.20/SF
− Vacancy
−$14.4K −$2.22/SF
EGI
$129.9K $19.98/SF
− OpEx
−$48.7K −$7.49/SF
NOI
$81.2K $12.49/SF
Area
Richmond, VA
Vacancy
10.00%
Lease Rate
$22.20 /SF/Yr
Expense Ratio
37.50%
Simulate Cap Rate and NOI
Suggested Prices Based on Cap Rates
Cap Rate 5%
$1,624,380
Cap Rate 7%
$1,160,271
Cap Rate 9%
$902,433
Alternative Uses
Best Use
Mixed Use
$1.16M
$1.02M – $1.35M
NOI $81,219 @ 7.0% cap · market cap 3.96%
Second Best
Apartment 5plus
$1.15M
$1.01M – $1.34M
NOI $80,575 @ 7.0% cap · market cap 3.93%
Theoretical Best
Office A
$1.50M
$1.31M – $1.75M
NOI $105,185 @ 7.0% cap · market cap 5.13%
Zoning and permitted uses should be independently verified with authorities.
How Realmo checks its estimates
Property Analytics
Unlock full access to Insights
Subscribe to Realmo Intelligence
Open Analytics
Current Use
Location Intelligence
Trade Area within ½ mile
3,716
Businesses Nearby
Explore this area
Business Placement
Demographics for 23219, VA
5,307
Population
3,488
Households
1.5
Avg Household Size
29
Median Age
62%
College-Educated
91%
High-School Grad
1.3 sq mi
ZIP Area
4,082
Density / Sq Mi
$62,533
Median Household Income
$46,509
Median Earnings
$1,439
Median Rent
$287,500
Median Home Value
Check the figures for this property
Cap Rate, Value Estimation, Potential NOI and more
View Realmo Analytics
Market
Vacancy Rate% for Multifamily in South region



Frequently Asked Questions
What type of property is this?
Mixed-use property - Renovated mixed-use property with retail and residential units.
Where is this mixed-use property located?
The property is located at 214-216 E Main St Richmond, VA.
What is the asking price?
The asking price for this property is $2,050,000.
What are key features of this property?
This property features: Rare dual‑income opportunity: Features 2 commercial storefronts and 2 spacious residential apartments.; Prime Downtown Richmond location in the Historic Banking District, walking distance to VCU, MCV, entertainment, and major employers.; Fully renovated with over $350,000 in renovations, offering a turnkey investment.


