Two-Story Office
For Sale
$849,999
Pending
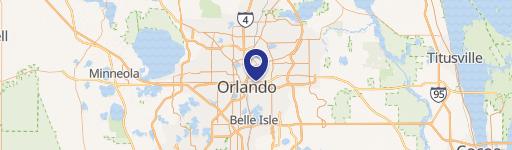
200 N THORNTON, Orlando, FL 32801
Flexible office layout with private rooms, collaborative areas, conference space, and an executive suite with a full bathroom.
Property Size2,613 SF
Days on Market52
Property Features for 200 N THORNTON
General Information
Standard status
Pending
Size
2,613 SF
Total Parking Spaces
10
Property subtype
Commercial
Additional Details
Public Transit
Yes
Taxes and HOA fees
Annual Taxes
$10,834
Building Details
Building Size
2,613 SF
Year Built
1986
Buildings
1
Stories
2
Construction
poured concrete
Listing Agency:
ALLIANCE REAL ESTATE GROUP
Listed By:
Peter Dang · License #3062116
(407) 375-8680
Source:
Elliman
Added: Aug 25
Changed: Oct 1
Last Checked: Oct 15 at 1:01AM
Displayed information is deemed reliable but is not guaranteed and should be independently verified. All listing content including descriptions, pricing, images are the copyrighted material of ALLIANCE REAL ESTATE GROUP
Investment Insights
Based on property information with market context.
Built in 1986, this well-maintained two-story office building provides a mix of private offices, open work areas, conference rooms, and an executive suite with a dedicated full bathroom. The poured-concrete construction includes a reserved elevator shaft for a potential future installation. Four separate electrical systems—one serving the first floor and three serving the second—support division into multiple occupancy configurations or continued single-user operation.
The property includes 10 dedicated on-site parking spaces and four HVAC systems, including an upstairs unit replaced recently. The roof is approximately 8 years old. Located at 200 N Thornton Avenue in Orlando’s Thornton Park neighborhood, the building offers access to Downtown Orlando, major roadways, SunRail, and Orlando International Airport. The surrounding area records a BikeScore of 88, a WalkScore of 69, and a TransitScore of 29.
The property includes 10 dedicated on-site parking spaces and four HVAC systems, including an upstairs unit replaced recently. The roof is approximately 8 years old. Located at 200 N Thornton Avenue in Orlando’s Thornton Park neighborhood, the building offers access to Downtown Orlando, major roadways, SunRail, and Orlando International Airport. The surrounding area records a BikeScore of 88, a WalkScore of 69, and a TransitScore of 29.
Key Highlights
- Two‑story office building constructed in 1986 with poured‑concrete walls
- Four separate electrical systems: one for the first floor and three for the second
- 10 dedicated on‑site parking spaces
Financial Insights
Estimated NOI and Cap Rate
NOI / Yr
$48,798
Cap Rate
5.74%
Suggested Prices Based on Cap Rates
Cap Rate 5%
$975,960
$976.0K
Cap Rate 7%
$697,114
$697.1K
Cap Rate 9%
$542,200
$542.2K
Market Conditions
NOI Build-Up for 2,613 SF
Gross rent
$78.4K $30.00/SF
− Vacancy
−$13.3K −$5.10/SF
EGI
$65.1K $24.90/SF
− OpEx
−$16.3K −$6.23/SF
NOI
$48.8K $18.67/SF
Area
Orlando, FL
Vacancy
17.00%
Lease Rate
$30.00 /SF/Yr
Expense Ratio
25.00%
Simulate Cap Rate and NOI
Suggested Prices Based on Cap Rates
Cap Rate 5%
$975,960
Cap Rate 7%
$697,114
Cap Rate 9%
$542,200
Alternative Uses
Best Use
Office B
$697.1K
$610.0K – $813.3K
NOI $48,798 @ 7.0% cap · market cap 5.74%
Second Best
—
—
no second resolved use
Theoretical Best
Office A
$841.7K
$736.5K – $982.0K
NOI $58,922 @ 7.0% cap · market cap 6.93%
Zoning and permitted uses should be independently verified with authorities.
How Realmo checks its estimates
Property Analytics
Current Use
Location Intelligence
Trade Area within ½ mile
9,201
Businesses Nearby
Explore this area
Business Placement
Demographics for 32801, FL
17,728
Population
12,133
Households
1.5
Avg Household Size
36
Median Age
63%
College-Educated
95%
High-School Grad
2.2 sq mi
ZIP Area
8,058
Density / Sq Mi
$77,626
Median Household Income
$63,090
Median Earnings
$1,773
Median Rent
$397,600
Median Home Value
Market
Vacancy Rate% for Office in Orlando, FL

Questions? Ask Rey
Realmo’s AI knows this listing — price, zoning, demand, history. Ask anything.






Frequently Asked Questions
What type of property is this?
Office building - Flexible office layout with private rooms, collaborative areas, conference space, and an executive suite with a full bathroom.
Where is this office building located?
The property is located at 200 N THORNTON Orlando, FL.
What is the asking price?
The asking price for this property is $849,999.
What are key features of this property?
This property features: Two‑story office building constructed in 1986 with poured‑concrete walls; Four separate electrical systems: one for the first floor and three for the second; 10 dedicated on‑site parking spaces