Industrial Building with Office
For Sale
Contact for pricing
Pending
188 Van Buren Street, Staten Island, NY 10301
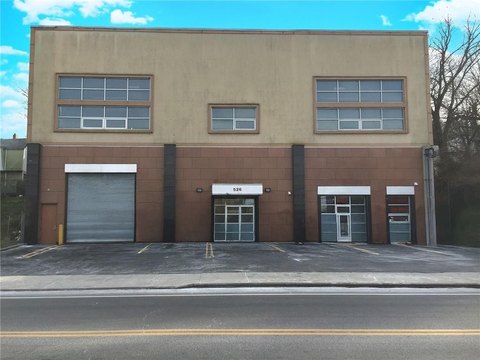
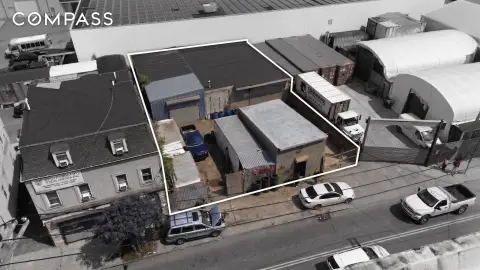
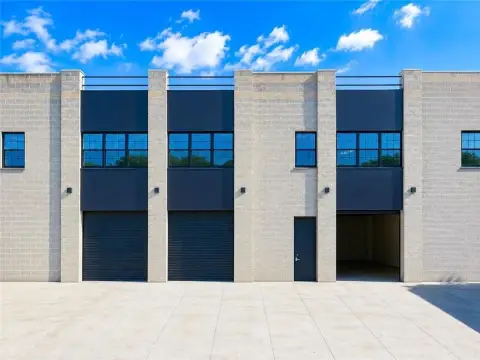
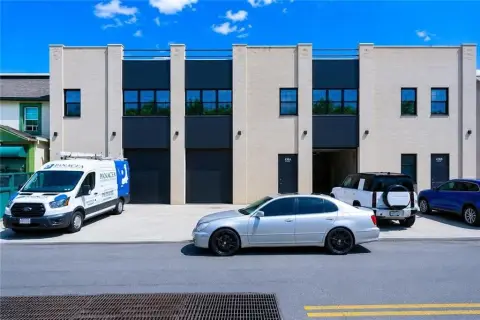
Full masonry-and-steel facility includes three drive-in bays and an elevator-served second-floor office with multiple private offices.
Property Size7,132 SF
Days on Market299
Property Features for 188 Van Buren Street
General Information
Standard status
Pending
Size
7,132 SF
Class
A
Total Parking Spaces
5
Property subtype
Office, Industrial, Business for Sale
Zoning
M2-1
Building Details
Year Built
2007
Buildings
1
Listing Agency:
PreReal Prendamano Real Estate
Listed By:
Robert Nixon · License #10401253010
(718) 816-7799
Source:
Crexi
Added: Dec 12, 2025
Changed: Sep 29
Last Checked: Oct 5 at 5:27PM
Displayed information is deemed reliable but is not guaranteed and should be independently verified. All listing content including descriptions, pricing, images are the copyrighted material of PreReal Prendamano Real Estate
Investment Insights
Based on property information with market context.
188 Van Buren Street is a full masonry-and-steel commercial facility built in 2007 and maintained as a single, cohesive owner-user property. The ground-floor warehouse includes three drive-in bays with drive-thru capability and 20-foot clear ceilings, along with additional rear storage. The front foyer provides a separate, refined entry to the office portion of the building.
An elevator serves the second floor, which features multiple private offices, collaborative areas, two restrooms (including one with a shower), a reception/waiting area, generous natural light, and high-quality finishes. The structure uses wide-span steel construction to support warehouse workflow and maneuverability.
The building is listed as a flexible industrial and office combination under M2 zoning, which allows a broader range of industrial and commercial activities than typical light-manufacturing districts. The property totals 7,132 square feet and is configured to support headquarters-level operations that require both warehouse capability and professional office space under one roof.
An elevator serves the second floor, which features multiple private offices, collaborative areas, two restrooms (including one with a shower), a reception/waiting area, generous natural light, and high-quality finishes. The structure uses wide-span steel construction to support warehouse workflow and maneuverability.
The building is listed as a flexible industrial and office combination under M2 zoning, which allows a broader range of industrial and commercial activities than typical light-manufacturing districts. The property totals 7,132 square feet and is configured to support headquarters-level operations that require both warehouse capability and professional office space under one roof.
Key Highlights
- Full masonry‑and‑steel commercial facility built in 2007 with 7,132 SF of total space.
- Ground‑floor warehouse includes three drive‑in bays with drive‑thru capability and 20‑foot clear ceilings.
- Wide‑span steel warehouse construction plus additional rear storage for overflow inventory or equipment.
Financial Insights
Estimated NOI and Cap Rate
NOI / Yr
$151,240
Cap Rate
8.64%
Suggested Prices Based on Cap Rates
Cap Rate 5%
$3,024,800
$3.0M
Cap Rate 7%
$2,160,571
$2.2M
Cap Rate 9%
$1,680,444
$1.7M
Market Conditions
NOI Build-Up for 7,132 SF
Gross rent
$188.3K $26.40/SF
− Vacancy
−$10.4K −$1.45/SF
EGI
$177.9K $24.95/SF
− OpEx
−$26.7K −$3.74/SF
NOI
$151.2K $21.21/SF
Area
Staten Island, NY
Vacancy
5.50%
Lease Rate
$26.40 /SF/Yr
Expense Ratio
15.00%
Simulate Cap Rate and NOI
Suggested Prices Based on Cap Rates
Cap Rate 5%
$3,024,800
Cap Rate 7%
$2,160,571
Cap Rate 9%
$1,680,444
Alternative Uses
Best Use
Office B
$2.33M
$2.04M – $2.72M
NOI $163,294 @ 7.0% cap · market cap 9.33%
Second Best
Warehouse
$2.16M
$1.89M – $2.52M
NOI $151,240 @ 7.0% cap · market cap 8.64%
Theoretical Best
Office A
$3.40M
$2.98M – $3.97M
NOI $238,210 @ 7.0% cap · market cap 13.61%
Zoning and permitted uses should be independently verified with authorities.
Property Analytics
Unlock full access to Insights
Subscribe to Realmo Intelligence
Open Analytics
Current Use
Location Intelligence
Trade Area within ½ mile
542
Businesses Nearby
Under-served
Demand for This Use
Explore this area
Business Placement
Demographics for 10301, NY
41,474
Population
16,631
Households
2.5
Avg Household Size
40
Median Age
38%
College-Educated
88%
High-School Grad
3.8 sq mi
ZIP Area
10,914
Density / Sq Mi
$84,937
Median Household Income
$50,140
Median Earnings
$1,697
Median Rent
$657,000
Median Home Value
Check the figures for this property
Cap Rate, Value Estimation, Potential NOI and more
View Realmo Analytics
Market
Vacancy Rate% for Office in Northeast region

Questions? Ask Rey
Realmo’s AI knows this listing — price, zoning, demand, history. Ask anything.





Frequently Asked Questions
What type of property is this?
Flex space - Full masonry-and-steel facility includes three drive-in bays and an elevator-served second-floor office with multiple private offices.
Where is this flex space located?
The property is located at 188 Van Buren Street Staten Island, NY.
What is the asking price?
The asking price for this property is $1,750,000.
What are key features of this property?
This property features: Full masonry‑and‑steel commercial facility built in 2007 with 7,132 SF of total space.; Ground‑floor warehouse includes three drive‑in bays with drive‑thru capability and 20‑foot clear ceilings.; Wide‑span steel warehouse construction plus additional rear storage for overflow inventory or equipment.



