Multi-Tenant Industrial
For Sale
Contact for pricing
1860 N Washington Blvd, Sarasota, FL 34234
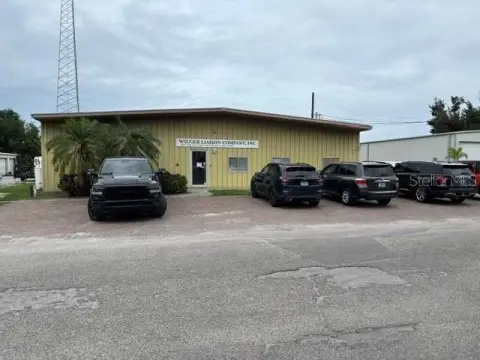
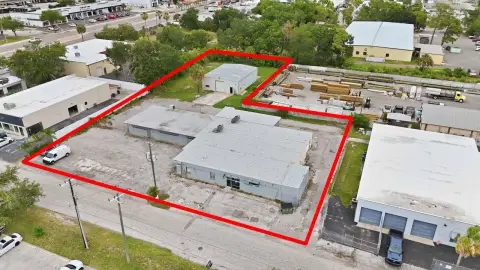
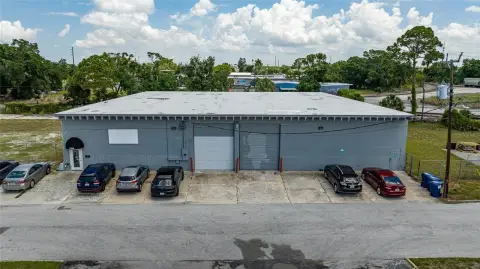
Two-property industrial portfolio on a highly trafficked corridor, offering multiple tenant spaces for diversified occupancy.
Property Size4,654 SF
Price / SF$343.79
Days on Market146
Property Features for 1860 N Washington Blvd
General Information
Standard status
Active
Size
4,654 SF
Property subtype
Retail
Zoning
Industrial General (IG)
Building Details
Units
2
Tenancy
Multi
Listing Agency:
Yoder Design & Development
Listed By:
Paul Yoder · License #FL
Source:
Crexi
Added: May 30
Changed: Oct 1
Last Checked: Oct 20 at 9:13PM
Displayed information is deemed reliable but is not guaranteed and should be independently verified. All listing content including descriptions, pricing, images are the copyrighted material of Yoder Design & Development

Ask AI about this property
Review the available facts, identify missing information and prepare questions for the agent.
Investment Insights
Based on property information with market context.
Yoder Design and Development presents a two-property, multi-tenant industrial portfolio in Sarasota, Florida. The offering is structured as an industrial income-producing package with diversified tenancy across the two properties.
The portfolio is located along the North Washington Boulevard corridor, identified in the remarks as highly trafficked, supporting straightforward access for day-to-day business activity. The address for the offering is 1860 N Washington Blvd, Sarasota, FL 34234.
This configuration can suit investors seeking an industrial portfolio format rather than a single-asset purchase, with multiple tenants represented within the broader industrial offering. It may also be of interest to buyers who prefer a portfolio approach to managing tenancy across two buildings, while maintaining an income-producing structure at the time of acquisition.
The portfolio is located along the North Washington Boulevard corridor, identified in the remarks as highly trafficked, supporting straightforward access for day-to-day business activity. The address for the offering is 1860 N Washington Blvd, Sarasota, FL 34234.
This configuration can suit investors seeking an industrial portfolio format rather than a single-asset purchase, with multiple tenants represented within the broader industrial offering. It may also be of interest to buyers who prefer a portfolio approach to managing tenancy across two buildings, while maintaining an income-producing structure at the time of acquisition.
Key Highlights
- Two‑property, multi‑tenant industrial portfolio in Sarasota, FL
- Located along the North Washington Boulevard corridor
- Portfolio features multiple tenant spaces for diversified occupancy
Financial Insights
Estimated NOI and Cap Rate
NOI / Yr
$65,168
Cap Rate
4.07%
Suggested Prices Based on Cap Rates
Cap Rate 5%
$1,303,360
$1.3M
Cap Rate 7%
$930,971
$931.0K
Cap Rate 9%
$724,089
$724.1K
Market Conditions
NOI Build-Up for 4,654 SF
Gross rent
$79.9K $17.16/SF
− Vacancy
−$3.2K −$0.69/SF
EGI
$76.7K $16.47/SF
− OpEx
−$11.5K −$2.47/SF
NOI
$65.2K $14.00/SF
Area
Sarasota County, FL
Vacancy
4.00%
Lease Rate
$17.16 /SF/Yr
Expense Ratio
15.00%
Simulate Cap Rate and NOI
Suggested Prices Based on Cap Rates
Cap Rate 5%
$1,303,360
Cap Rate 7%
$930,971
Cap Rate 9%
$724,089
Alternative Uses
Best Use
Warehouse
$931.0K
$814.6K – $1.09M
NOI $65,168 @ 7.0% cap · market cap 4.07%
Second Best
Industrial
$766.7K
$670.9K – $894.5K
NOI $53,668 @ 7.0% cap · market cap 3.35%
Theoretical Best
Office A
$1.32M
$1.16M – $1.54M
NOI $92,589 @ 7.0% cap · market cap 5.79%
Zoning and permitted uses should be independently verified with authorities.
How Realmo checks its estimates
Property Analytics
Who owns this building?
See the owner, sales and loan history
Open Analytics
Current Use
Location Intelligence
Trade Area within ½ mile
1,277
Businesses Nearby
Well-served
Demand for This Use
Explore this area
Business Placement
Demographics for 34234, FL
20,858
Population
10,257
Households
2
Avg Household Size
42
Median Age
28%
College-Educated
86%
High-School Grad
6.5 sq mi
ZIP Area
3,209
Density / Sq Mi
$56,607
Median Household Income
$33,536
Median Earnings
$1,352
Median Rent
$222,900
Median Home Value
Check the figures for this property
Cap Rate, Value Estimation, Potential NOI and more
View Realmo Analytics
Market
Vacancy Rate% for Industrial in South region






Similar Off Market Nearby
- We store BOATS — 1331 10th St, Sarasota, FL 34236
- The Lock Up Self Storage — 1003 N Orange Ave #4102, Sarasota, FL 34236
- Lucky's Boat Storage — 1684 11th St, Sarasota, FL 34236
- Central Sarasota Boat Storage — 1747 10th Way, Sarasota, FL 34236
- Brickyard Storage — 1746 10th Way, Sarasota, FL 34236
Frequently Asked Questions
What type of property is this?
Warehouse - Two-property industrial portfolio on a highly trafficked corridor, offering multiple tenant spaces for diversified occupancy.
Where is this warehouse located?
The property is located at 1860 N Washington Blvd Sarasota, FL.
What is the asking price?
The asking price for this property is $1,600,000.
What are key features of this property?
This property features: Two‑property, multi‑tenant industrial portfolio in Sarasota, FL; Located along the North Washington Boulevard corridor; Portfolio features multiple tenant spaces for diversified occupancy


