Renovated Duplex with Outdoor
For Sale
$1,450,000
1831 SPRUCE ST, Philadelphia, PA 19103
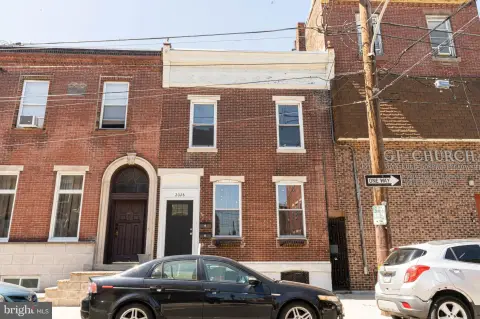
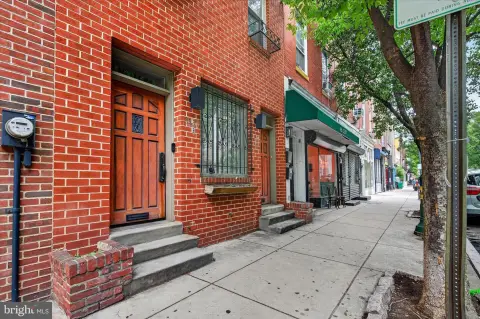
Four finished levels contain two flexible bi-level residences with outdoor areas and separate entrances.
Property Size2,448 SF
Price / SF$592.32
Days on Market101
Property Features for 1831 SPRUCE ST
General Information
Standard status
Active
Size
2,448 SF
Property subtype
Multi-family
Additional Details
Multifamily Units
2
Amenities
outdoor space
gas fireplace
custom built-ins
plantation shutters
washer/dryer
surround sound
custom closet systems
Building Details
Year Built
1912
Buildings
1
Stories
4
Listing Agency:
Kurfiss Sotheby's International Realty
(215) 794-3227
Listed By:
Cary Simons · License #RS295353
(484) 431-9019
Source:
Keygroupmd
Added: Jul 13
Changed: Oct 4
Last Checked: Oct 20 at 8:18PM
Displayed information is deemed reliable but is not guaranteed and should be independently verified. All listing content including descriptions, pricing, images are the copyrighted material of Kurfiss Sotheby's International Realty

Ask AI about this property
Review the available facts, identify missing information and prepare questions for the agent.
Investment Insights
Based on property information with market context.
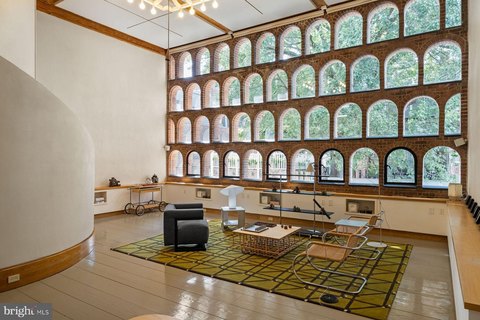
This four-level duplex offers two bi-level residences with distinct layouts and multiple outdoor areas. The property was originally built in 1912 and underwent a full renovation involving Gardner Fox Architects and McCroubrey Overholser. Interior details include Brazilian hardwood and bamboo flooring, exposed brick, custom built-ins, cherry cabinetry, fireplaces, wet bars, kitchens, laundry areas, and substantial storage. Both residences include two full bathrooms, while bedroom configurations range from one to four bedrooms. Separate entrances create flexibility for guests, household members, or independent occupancy within the overall layout.
Located at 1831 Spruce St in Philadelphia, the property is steps from Rittenhouse Square and a four-minute walk from the University of Penn Shuttle stop at 20th and Locust. Rittenhouse Square amenities identified nearby include restaurants, cafes, a farmers market, and seasonal events. Access is also available from Manning St, adding another entry point to the building.
Located at 1831 Spruce St in Philadelphia, the property is steps from Rittenhouse Square and a four-minute walk from the University of Penn Shuttle stop at 20th and Locust. Rittenhouse Square amenities identified nearby include restaurants, cafes, a farmers market, and seasonal events. Access is also available from Manning St, adding another entry point to the building.
Key Highlights
- Two bi‑level residences across 4 floors of finished living space
- Originally built in 1912 and fully renovated with architectural design by Gardner Fox Architects and McCroubrey Overholser
- Bedroom configurations range from 1‑2 bedrooms in Unit 1 to 3‑4 bedrooms in Unit 2
Financial Insights
Estimated NOI and Cap Rate
NOI / Yr
$41,775
Cap Rate
2.88%
Suggested Prices Based on Cap Rates
Cap Rate 5%
$835,500
$835.5K
Cap Rate 7%
$596,786
$596.8K
Cap Rate 9%
$464,167
$464.2K
Market Conditions
NOI Build-Up for 2,448 SF
Gross rent
$63.2K $25.80/SF
− Vacancy
−$3.5K −$1.42/SF
EGI
$59.7K $24.38/SF
− OpEx
−$17.9K −$7.31/SF
NOI
$41.8K $17.06/SF
Area
Philadelphia, PA
Vacancy
5.51%
Lease Rate
$25.80 /SF/Yr
Expense Ratio
30.00%
Simulate Cap Rate and NOI
Suggested Prices Based on Cap Rates
Cap Rate 5%
$835,500
Cap Rate 7%
$596,786
Cap Rate 9%
$464,167
Alternative Uses
Best Use
Multifamily LT 5
$596.8K
$522.2K – $696.3K
NOI $41,775 @ 7.0% cap · market cap 2.88%
Second Best
Apartment 5plus
$550.1K
$481.3K – $641.8K
NOI $38,506 @ 7.0% cap · market cap 2.66%
Theoretical Best
—
—
same as Best Use
Zoning and permitted uses should be independently verified with authorities.
How Realmo checks its estimates
Property Analytics
Contact the owner directly
Get the owner's phone numbers and email
Open Analytics
Lease Details
2
Residential units
Location Intelligence
Trade Area within ½ mile
18,587
Businesses Nearby
Explore this area
Business Placement
Demographics for 19103, PA
28,717
Population
20,064
Households
1.4
Avg Household Size
36
Median Age
81%
College-Educated
98%
High-School Grad
0.6 sq mi
ZIP Area
47,862
Density / Sq Mi
$97,940
Median Household Income
$76,680
Median Earnings
$1,955
Median Rent
$551,700
Median Home Value
Check the figures for this property
Cap Rate, Value Estimation, Potential NOI and more
View Realmo Analytics
Market
Vacancy Rate% for Multifamily in Northeast region







Frequently Asked Questions
What type of property is this?
Duplex - Four finished levels contain two flexible bi-level residences with outdoor areas and separate entrances.
Where is this duplex located?
The property is located at 1831 SPRUCE ST Philadelphia, PA.
What is the asking price?
The asking price for this property is $1,450,000.
What are key features of this property?
This property features: Two bi‑level residences across 4 floors of finished living space; Originally built in 1912 and fully renovated with architectural design by Gardner Fox Architects and McCroubrey Overholser; Bedroom configurations range from 1‑2 bedrooms in Unit 1 to 3‑4 bedrooms in Unit 2


