Mixed-Use Building with Ground
For Sale
$949,900
709 E Passyunk Avenue, Philadelphia, PA 19147
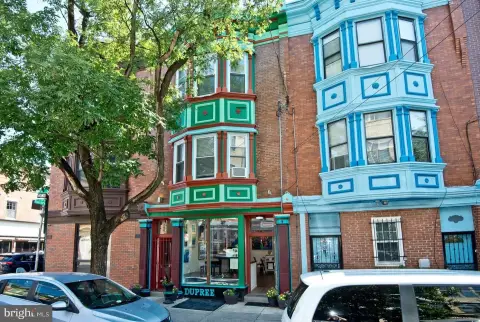
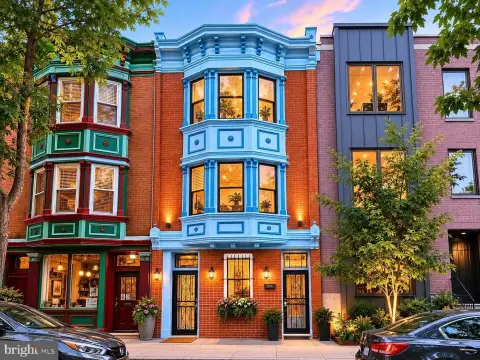
Three-unit mixed-use property offers a vacant first-floor storefront plus two 1-bedroom apartments above.
Property Size2,052 SF
Price / SF$462.91
Days on Market663
Property Features for 709 E Passyunk Avenue
General Information
Standard status
Active
Size
2,052 SF
Property subtype
Multi-family
Lease Term
[]
Additional Details
Multifamily Units
2
Building Details
Year Built
1960
Stories
3
Tenancy
Multi
Listing Agency:
Century 21 Forrester Real Estate
Listed By:
Michael A Giangiordano II · License #RS338459
(215) 334-3333
Source:
Deepcreeklake
Added: Dec 27, 2024
Changed: Oct 21
Last Checked: Oct 20 at 10:53PM
Displayed information is deemed reliable but is not guaranteed and should be independently verified. All listing content including descriptions, pricing, images are the copyrighted material of Century 21 Forrester Real Estate

Ask AI about this property
Review the available facts, identify missing information and prepare questions for the agent.
Investment Insights
Based on property information with market context.
This mixed-use property is configured as a three-unit building with a commercial storefront on the first floor and two 1-bedroom apartments on the second and third floors. The first-floor commercial space features a nice-sized open area with a powder room, with access to both the yard and the basement. The basement contains the building’s mechanical systems and is unfinished, with access from an interior staircase and exterior bilcox doors. The first floor includes central air and heating.
The second floor is a 1-bedroom apartment with radiator gas heating, laminate floors, and natural light. The third floor also features radiator gas heating and laminate floors, and is currently occupied on a month-to-month lease. Both apartments do not have air conditioning. All separate utilities are billed to the tenants, except water, which is paid by the landlord.
The second floor is a 1-bedroom apartment with radiator gas heating, laminate floors, and natural light. The third floor also features radiator gas heating and laminate floors, and is currently occupied on a month-to-month lease. Both apartments do not have air conditioning. All separate utilities are billed to the tenants, except water, which is paid by the landlord.
Key Highlights
- 3‑unit mixed‑use building (built in 1960) with a commercial store on the 1st floor and two 1‑bedroom apartments on the 2nd and 3rd floors
- 1st‑floor storefront is currently vacant with an open space plus a powder room, with access to the yard and the basement
- Basement has all mechanical systems and is unfinished; accessible from an interior staircase or exterior bilco‑style doors
Financial Insights
Estimated NOI and Cap Rate
NOI / Yr
$35,017
Cap Rate
3.69%
Suggested Prices Based on Cap Rates
Cap Rate 5%
$700,340
$700.3K
Cap Rate 7%
$500,243
$500.2K
Cap Rate 9%
$389,078
$389.1K
Market Conditions
NOI Build-Up for 2,052 SF
Gross rent
$52.9K $25.80/SF
− Vacancy
−$2.9K −$1.42/SF
EGI
$50.0K $24.38/SF
− OpEx
−$15.0K −$7.31/SF
NOI
$35.0K $17.06/SF
Area
Philadelphia, PA
Vacancy
5.51%
Lease Rate
$25.80 /SF/Yr
Expense Ratio
30.00%
Simulate Cap Rate and NOI
Suggested Prices Based on Cap Rates
Cap Rate 5%
$700,340
Cap Rate 7%
$500,243
Cap Rate 9%
$389,078
Alternative Uses
Best Use
Multifamily LT 5
$500.2K
$437.7K – $583.6K
NOI $35,017 @ 7.0% cap · market cap 3.69%
Second Best
Apartment 5plus
$461.1K
$403.5K – $538.0K
NOI $32,277 @ 7.0% cap · market cap 3.40%
Theoretical Best
—
—
same as Best Use
Zoning and permitted uses should be independently verified with authorities.
How Realmo checks its estimates
Property Analytics
Contact the owner directly
Get the owner's phone numbers and email
Open Analytics
Current Use
Lease Details
2
Residential units
Multi-tenant
Tenancy
Location Intelligence
Trade Area within ½ mile
9,041
Businesses Nearby
Explore this area
Business Placement
Demographics for 19147, PA
41,096
Population
20,735
Households
2
Avg Household Size
36
Median Age
69%
College-Educated
93%
High-School Grad
1.3 sq mi
ZIP Area
31,612
Density / Sq Mi
$104,190
Median Household Income
$71,905
Median Earnings
$1,679
Median Rent
$524,900
Median Home Value
Check the figures for this property
Cap Rate, Value Estimation, Potential NOI and more
View Realmo Analytics
Market
Vacancy Rate% for Multifamily in Northeast region




Frequently Asked Questions
What type of property is this?
Mixed-use property - Three-unit mixed-use property offers a vacant first-floor storefront plus two 1-bedroom apartments above.
Where is this mixed-use property located?
The property is located at 709 E Passyunk Avenue Philadelphia, PA.
What is the asking price?
The asking price for this property is $949,900.
What are key features of this property?
This property features: 3‑unit mixed‑use building (built in 1960) with a commercial store on the 1st floor and two 1‑bedroom apartments on the 2nd and 3rd floors; 1st‑floor storefront is currently vacant with an open space plus a powder room, with access to the yard and the basement; Basement has all mechanical systems and is unfinished; accessible from an interior staircase or exterior bilco‑style doors


