Renovated Duplex with Separate
For Sale
$679,000
1827 Southwest 21st Street, Fort Lauderdale, FL 33315
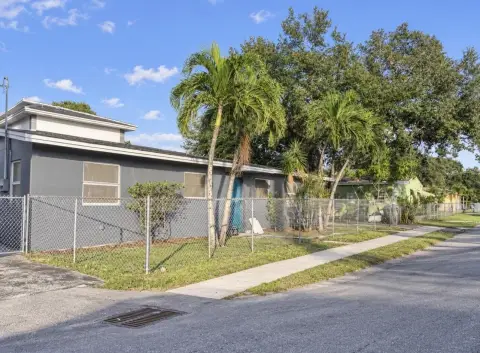
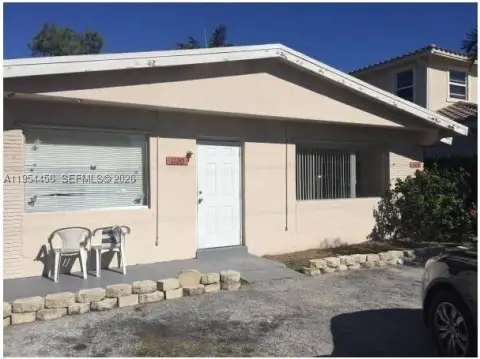
Two-unit property with one vacant residence and an active short-term rental license through December 2026.
Property Size1,570 SF
Price / SF$432.48
Days on Market177
Property Features for 1827 Southwest 21st Street
General Information
Standard status
Active
Size
1,570 SF
Property subtype
Residential Income / Duplex
Site & Location
Neighborhood
Roca
Highway Access
Yes
Utilities to Site
Yes
Units
Unit Mix
2 x 2BR/1BA
Multifamily Units
2
Taxes and HOA fees
Annual Taxes
$9,228
Building Details
Year Built
1959
Year Renovated
2025
Construction
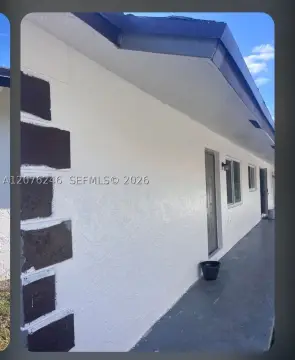
C.B. Stucco
Listing Agency:
Caba Real Estate
Listed By:
Antulio Montiel · License #3241567
(305) 776-8323
Source:
Compass
Added: Apr 30
Changed: Oct 16
Last Checked: Oct 20 at 11:13PM
Displayed information is deemed reliable but is not guaranteed and should be independently verified. All listing content including descriptions, pricing, images are the copyrighted material of Caba Real Estate

Ask AI about this property
Review the available facts, identify missing information and prepare questions for the agent.
Investment Insights
Based on property information with market context.
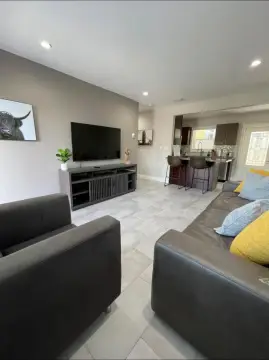
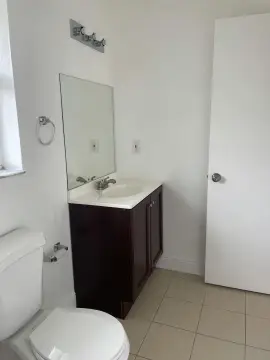
This 1,570-square-foot duplex contains two residences, each configured with two bedrooms and one bathroom. A comprehensive 2024–2025 renovation replaced the kitchens, bathrooms, plumbing, electrical systems, impact windows and doors, and roof. Original terrazzo flooring remains, complemented by C.B. Stucco construction. The property was built in 1959 and is zoned RD-15.
One unit is vacant and ready for occupancy, while the second is leased through September 2026. Separate electric and water meters serve each residence, and tenants pay their own utilities. An active short-term rental license extends through December 2026.
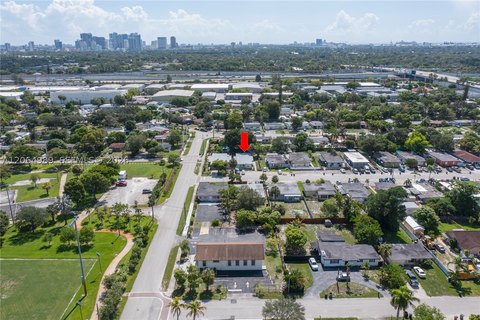
The property is in Fort Lauderdale’s River Oaks neighborhood, one block from Safe Harbour Lauderdale Marina, five blocks from I-95, 10 minutes from FLL Airport, and 15 minutes from the beach.
One unit is vacant and ready for occupancy, while the second is leased through September 2026. Separate electric and water meters serve each residence, and tenants pay their own utilities. An active short-term rental license extends through December 2026.
The property is in Fort Lauderdale’s River Oaks neighborhood, one block from Safe Harbour Lauderdale Marina, five blocks from I-95, 10 minutes from FLL Airport, and 15 minutes from the beach.
Key Highlights
- 1,570 SF duplex with two 2‑bedroom, 1‑bath units
- Comprehensive renovation completed during 2024–2025
- Separate electric and water meters for each unit
Financial Insights
Estimated NOI and Cap Rate
NOI / Yr
$26,172
Cap Rate
3.85%
Suggested Prices Based on Cap Rates
Cap Rate 5%
$523,440
$523.4K
Cap Rate 7%
$373,886
$373.9K
Cap Rate 9%
$290,800
$290.8K
Market Conditions
NOI Build-Up for 1,570 SF
Gross rent
$39.6K $25.20/SF
− Vacancy
−$2.2K −$1.39/SF
EGI
$37.4K $23.81/SF
− OpEx
−$11.2K −$7.14/SF
NOI
$26.2K $16.67/SF
Area
Fort Lauderdale, FL
Vacancy
5.50%
Lease Rate
$25.20 /SF/Yr
Expense Ratio
30.00%
Simulate Cap Rate and NOI
Suggested Prices Based on Cap Rates
Cap Rate 5%
$523,440
Cap Rate 7%
$373,886
Cap Rate 9%
$290,800
Alternative Uses
Best Use
Multifamily LT 5
$373.9K
$327.2K – $436.2K
NOI $26,172 @ 7.0% cap · market cap 3.85%
Second Best
Apartment 5plus
$336.8K
$294.7K – $392.9K
NOI $23,576 @ 7.0% cap · market cap 3.47%
Theoretical Best
Office A
$1.06M
$923.2K – $1.23M
NOI $73,853 @ 7.0% cap · market cap 10.88%
Zoning and permitted uses should be independently verified with authorities.
How Realmo checks its estimates
Property Analytics
Who owns this building?
See the owner, sales and loan history
Open Analytics
Lease Details
2
Residential units
Yes
Highway access
Yes
Utilities to site
Location Intelligence
Trade Area within ½ mile
872
Businesses Nearby
Explore this area
Business Placement
Demographics for 33315, FL
13,555
Population
6,991
Households
1.9
Avg Household Size
43
Median Age
35%
College-Educated
94%
High-School Grad
5.3 sq mi
ZIP Area
2,558
Density / Sq Mi
$90,760
Median Household Income
$43,815
Median Earnings
$1,789
Median Rent
$492,400
Median Home Value
Check the figures for this property
Cap Rate, Value Estimation, Potential NOI and more
View Realmo Analytics
Market
Vacancy Rate% for Multifamily in South region





Frequently Asked Questions
What type of property is this?
Duplex - Two-unit property with one vacant residence and an active short-term rental license through December 2026.
Where is this duplex located?
The property is located at 1827 Southwest 21st Street Fort Lauderdale, FL.
What is the asking price?
The asking price for this property is $679,000.
What are key features of this property?
This property features: 1,570 SF duplex with two 2‑bedroom, 1‑bath units; Comprehensive renovation completed during 2024–2025; Separate electric and water meters for each unit


