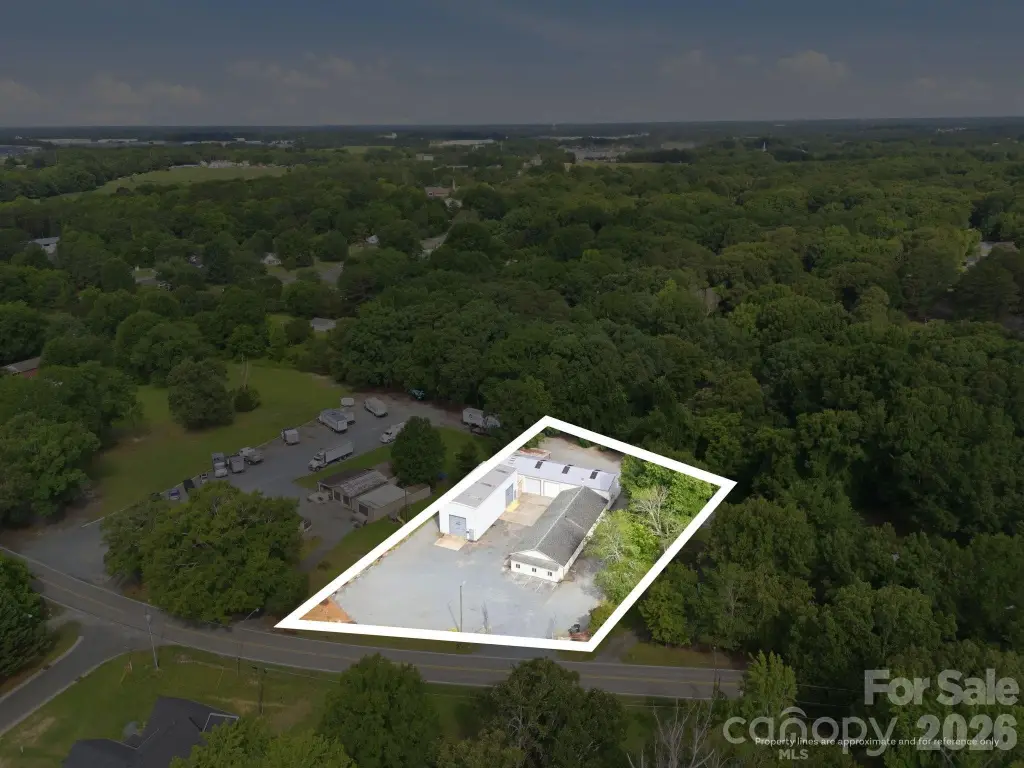
Occupied Three-Building Flex
For Sale
$1,200,000
1819 John Moore Road, Monroe, NC 28110
Commercial Sale, Monroe, NC
Property Size6,400 SF
Lot Size0.82 Acres
Price / SF$187.50
Days on Market140
Property Features for 1819 John Moore Road
General Information
Property type
Commercial Sale
Property subtype
Other
Zoning description
RLD
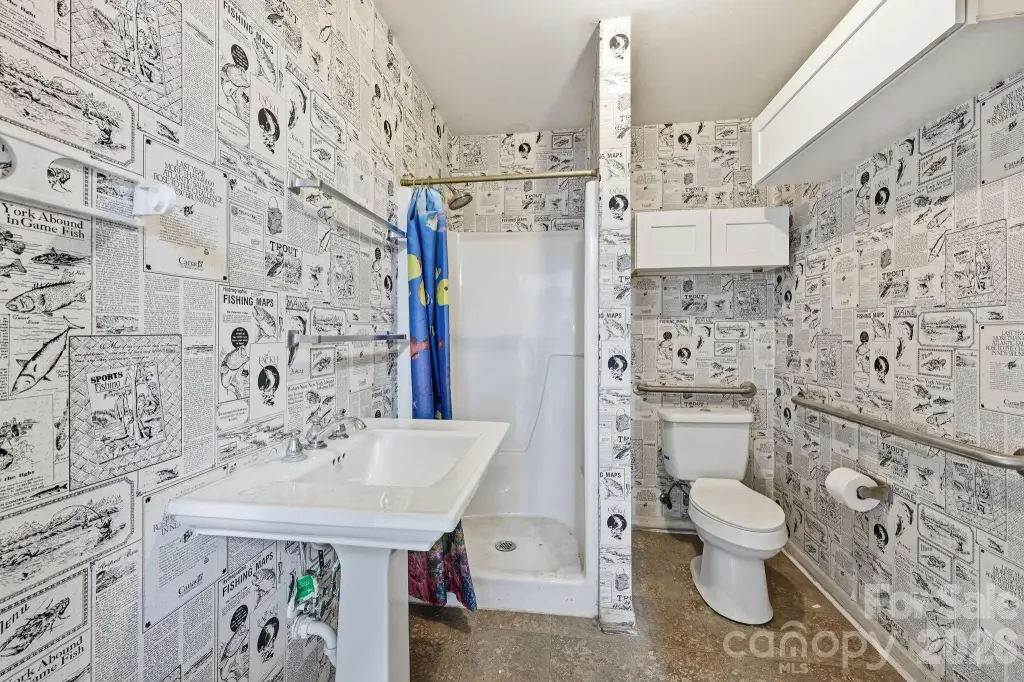
Bathrooms
3
Full bathrooms
3
Rooms
Bathroom 1, Bathroom 3, Bathroom 2
Standard status
Active
APN
09-298-008
Lot size
0.82 Acres
Taxes and HOA fees
Tax Description
7427-424
Legal Description
7427-424
Building Details
Year built
1965
Floors in Building
1
Listing Agency:
Lantern Realty & Development, LLC
(704) 298-0087
Listed By:
Chris Puckett
(704) 298-5872
Added: Jun 2
Changed: Oct 15
Last Checked: Oct 19 at 5:06AM
MLS# 4386805
Copyright © 2026 Canopy MLS. All rights reserved. All information provided by the listing agent/broker is deemed reliable but is not guaranteed and should be independently verified.

Ask AI about this property
Review the available facts, identify missing information and prepare questions for the agent.
Investment Insights
Based on property information with market context.
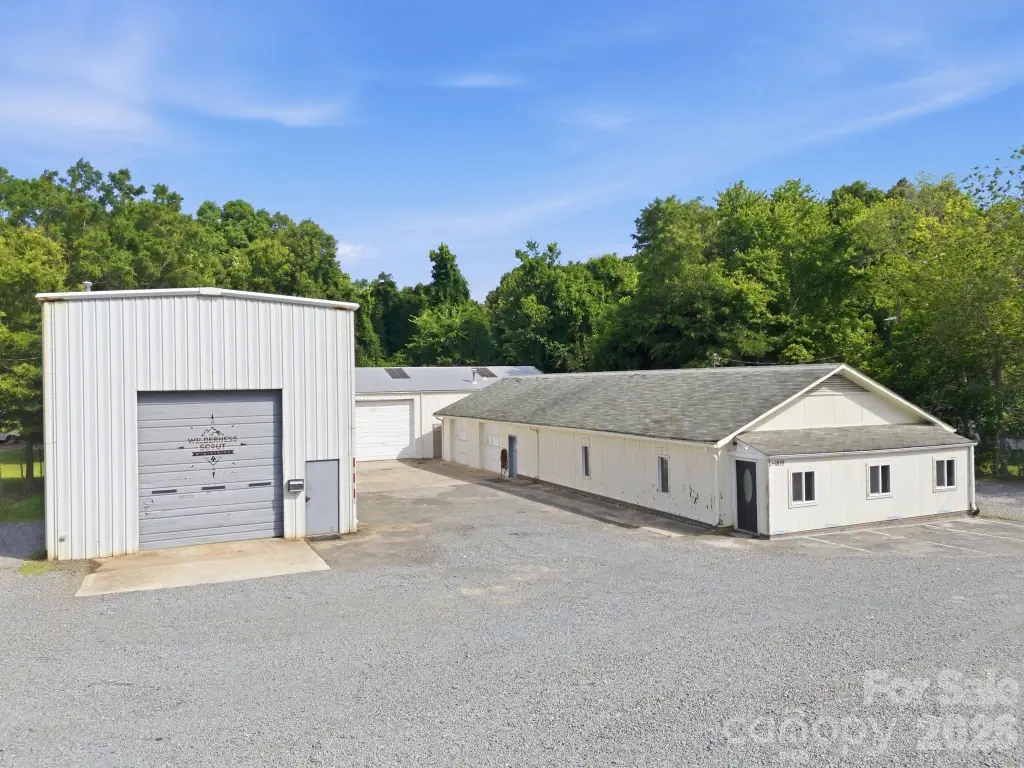
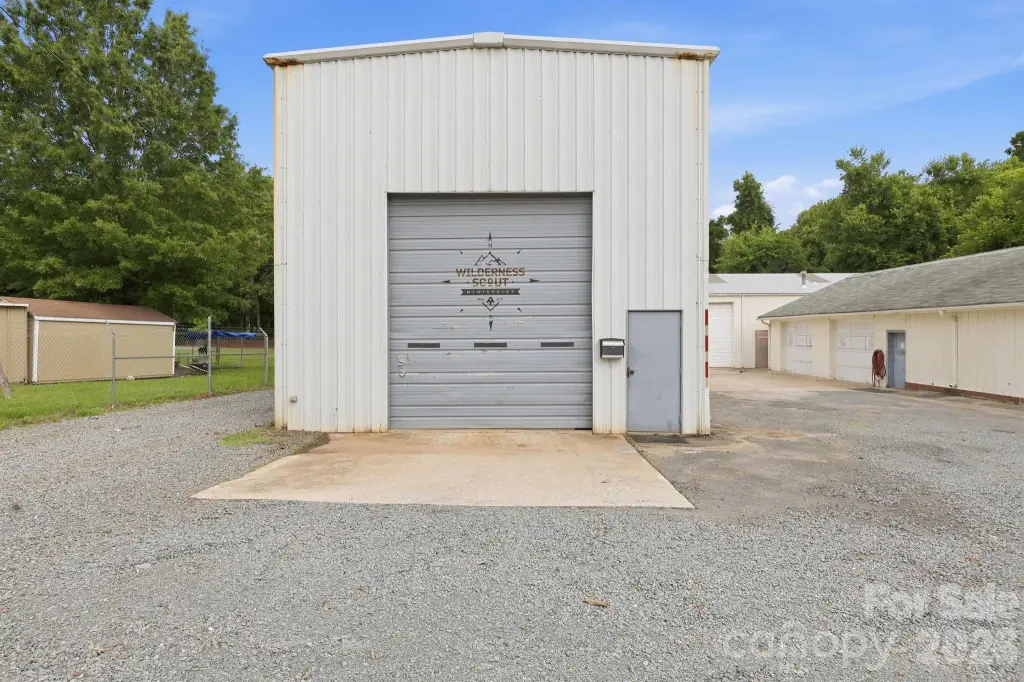
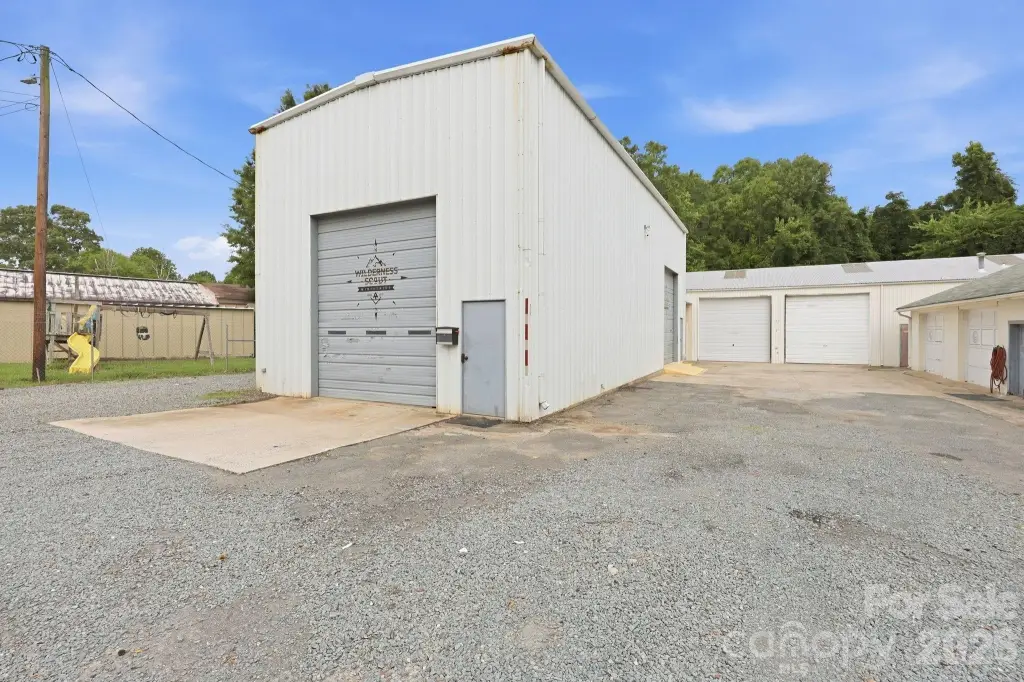
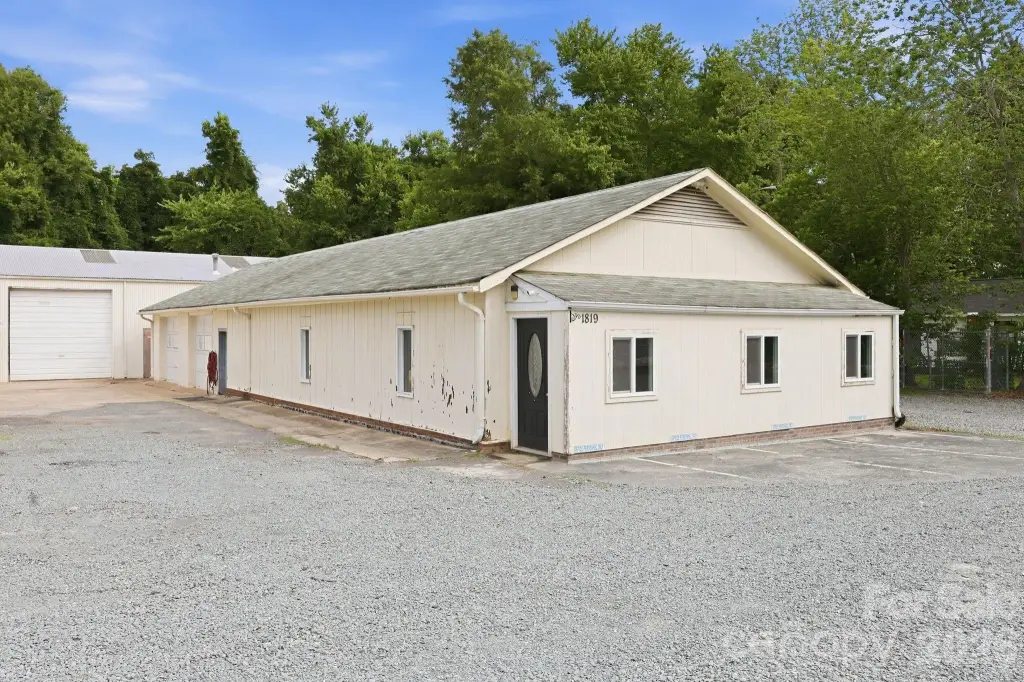
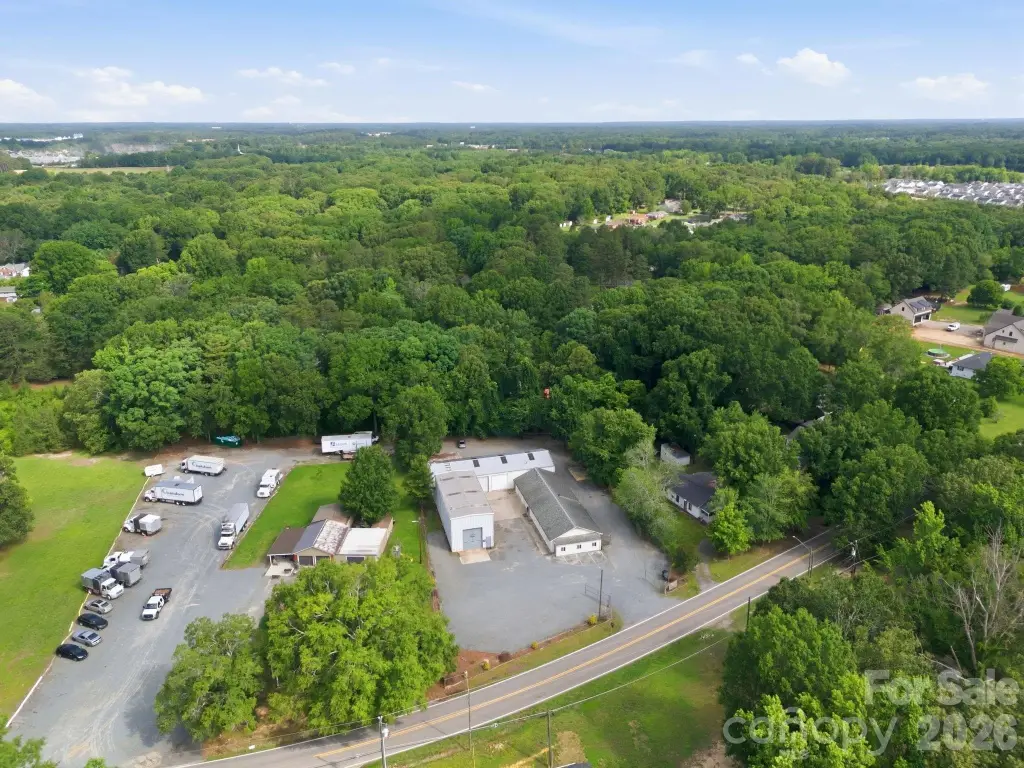
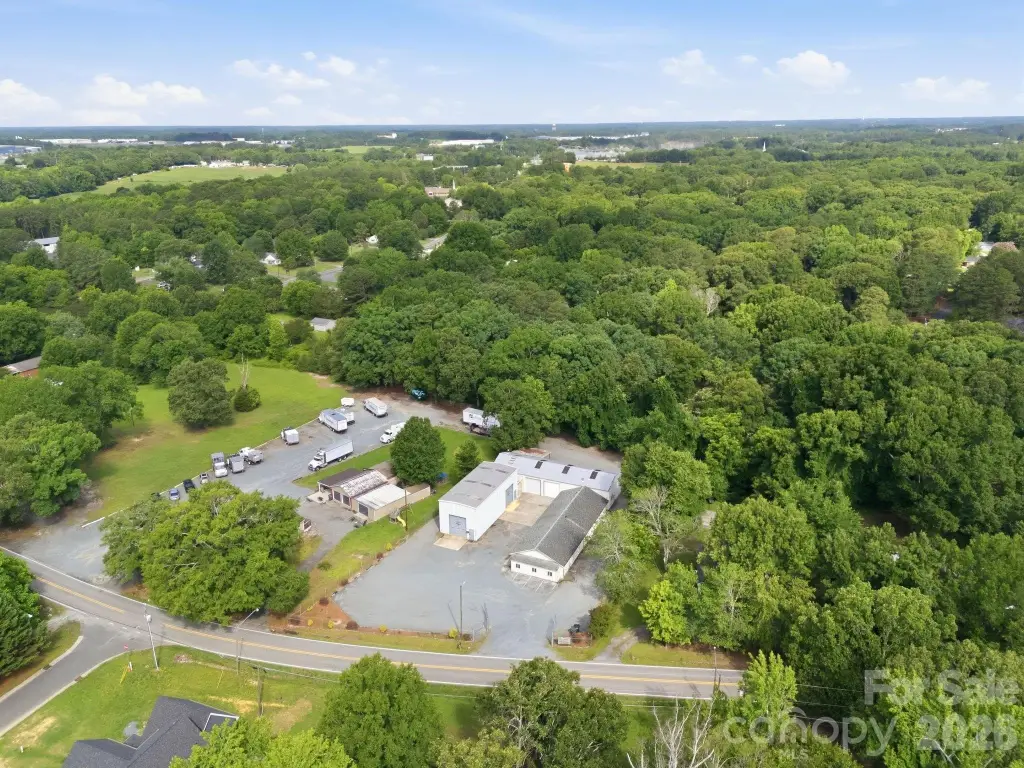
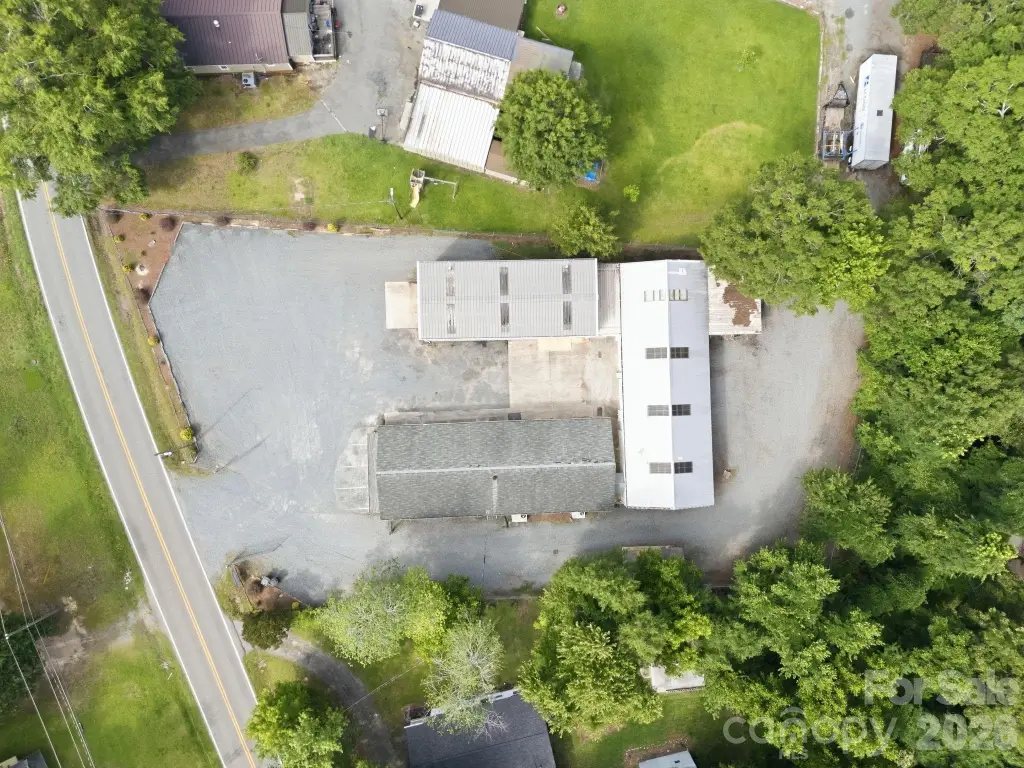
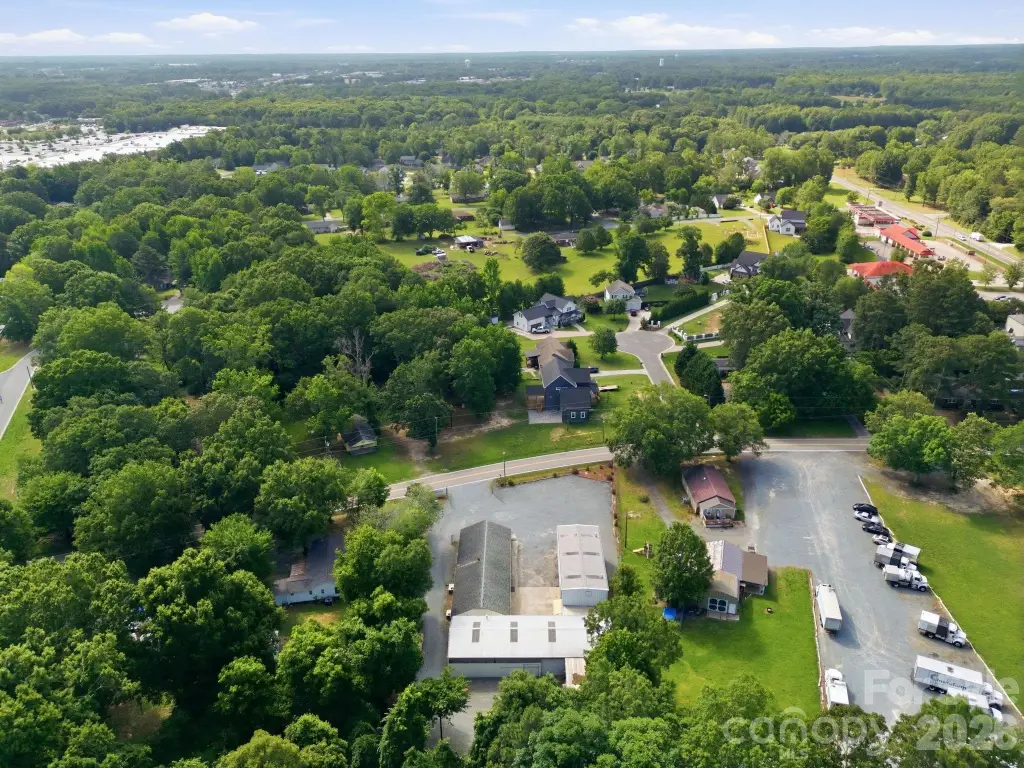
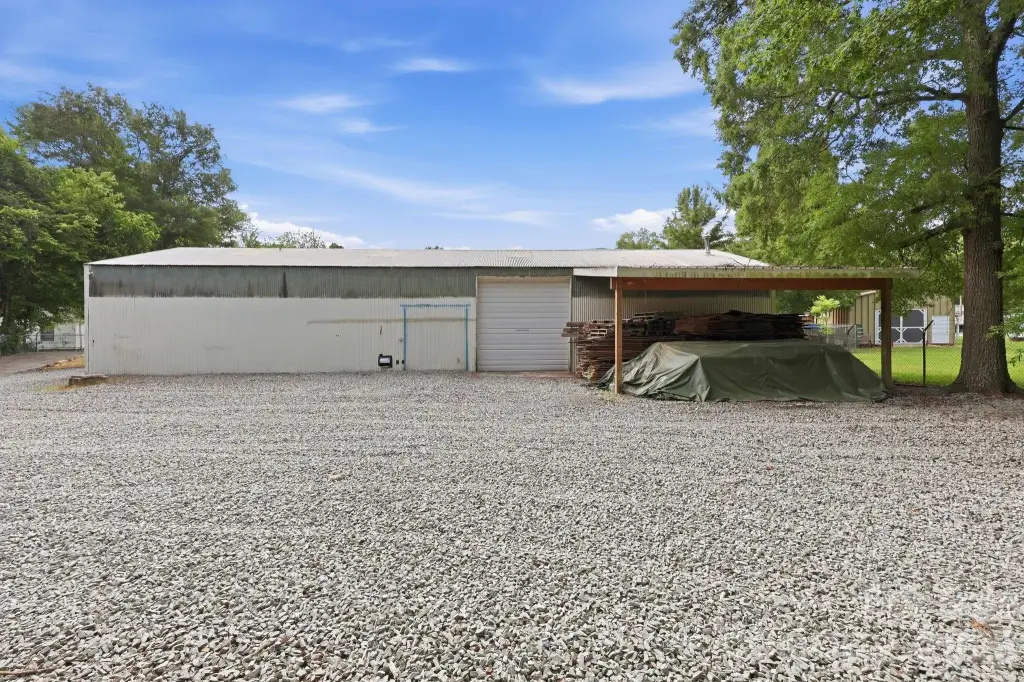
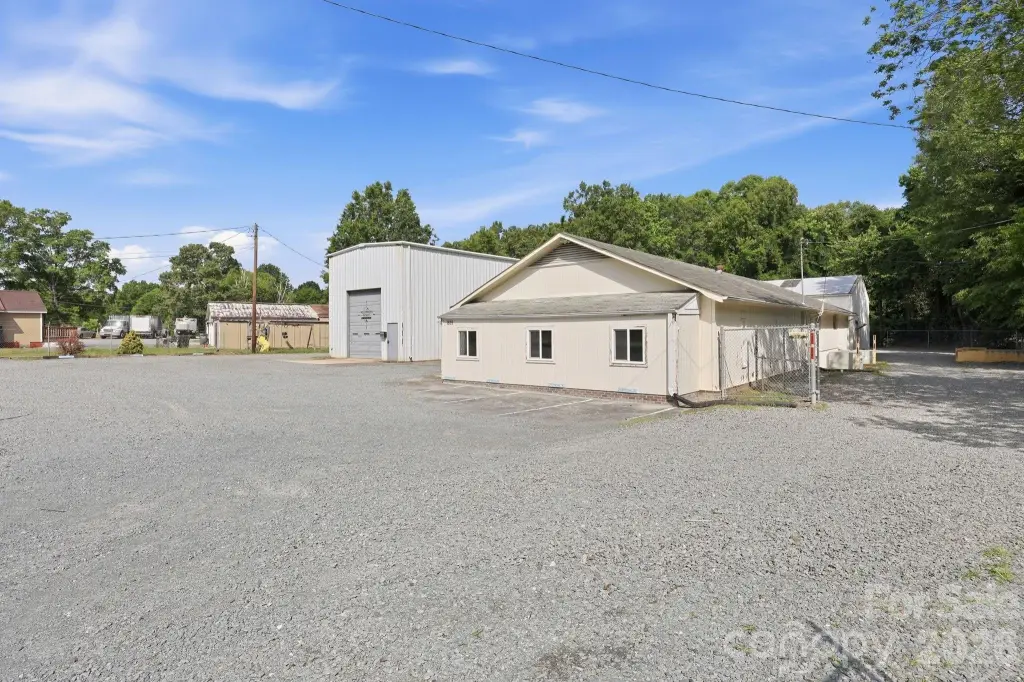
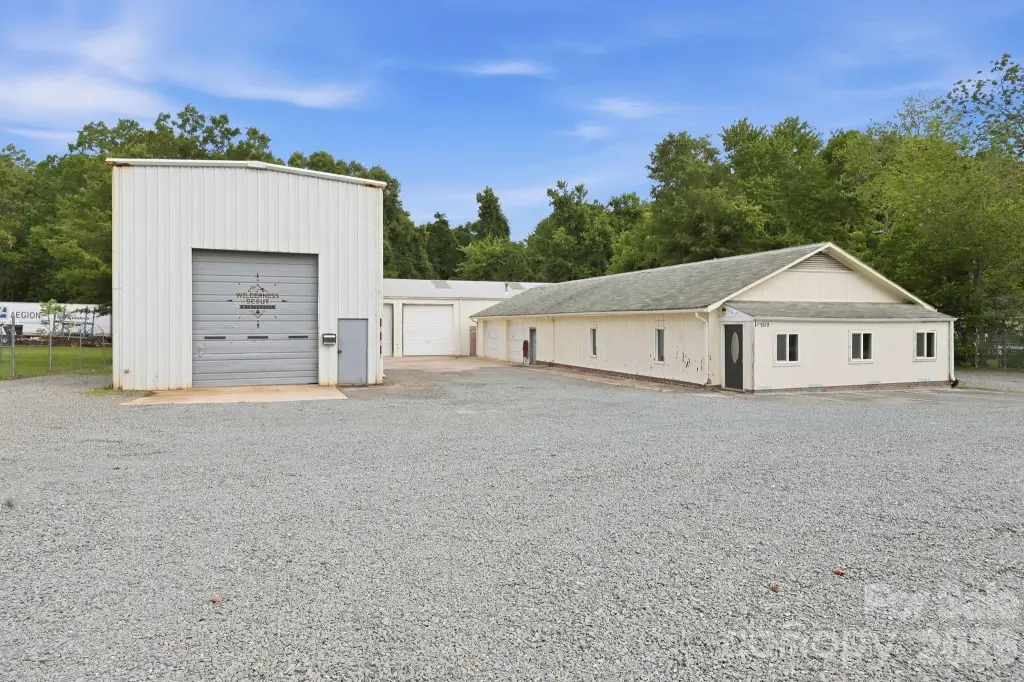
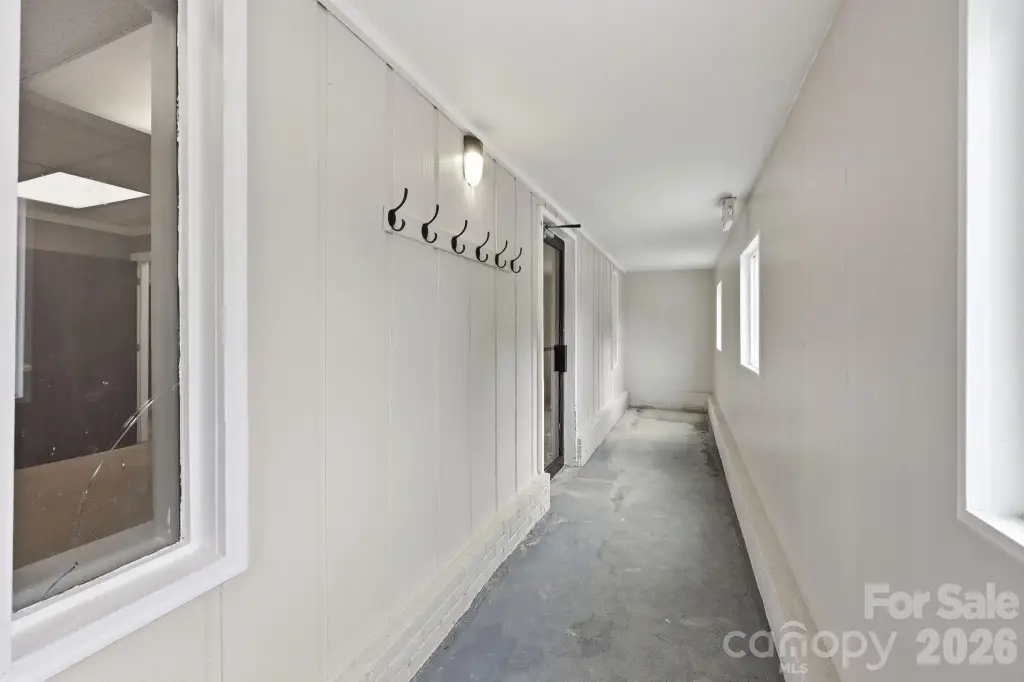
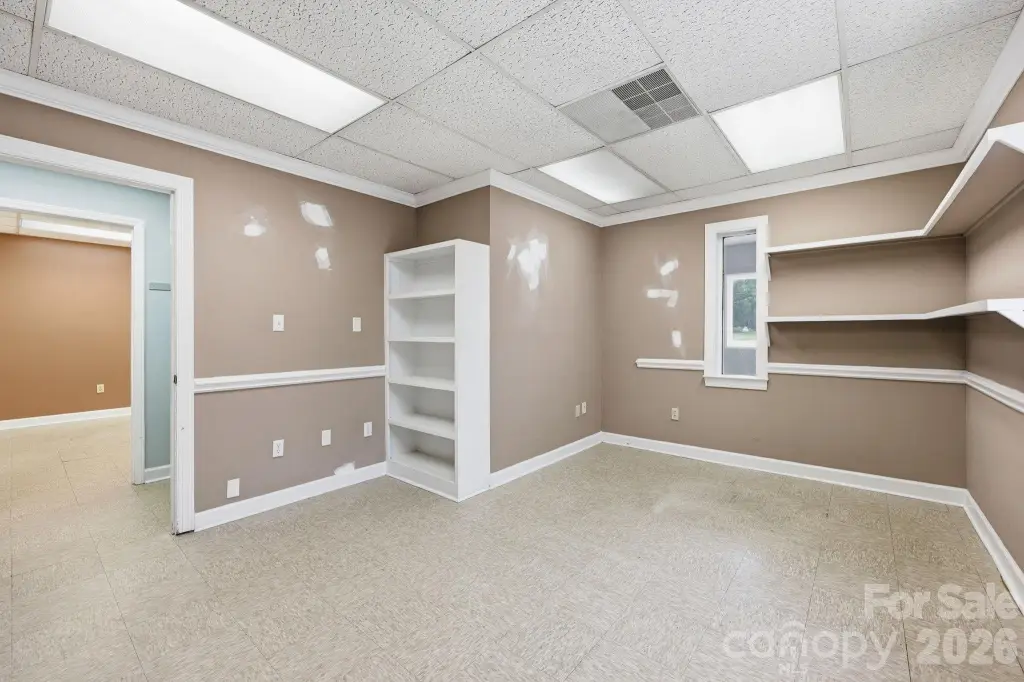
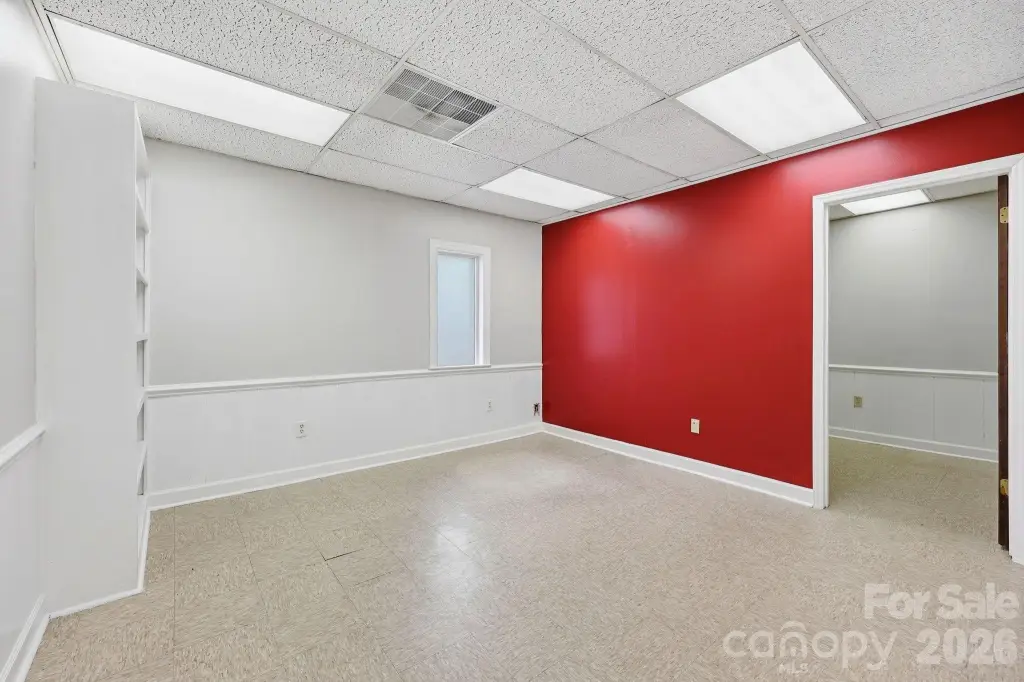
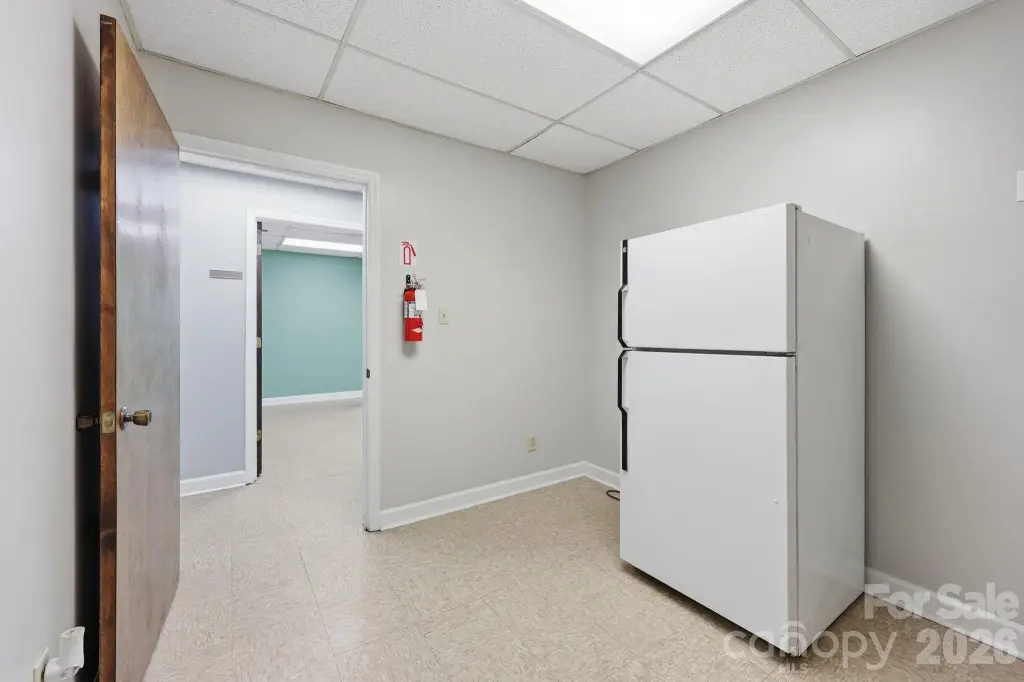
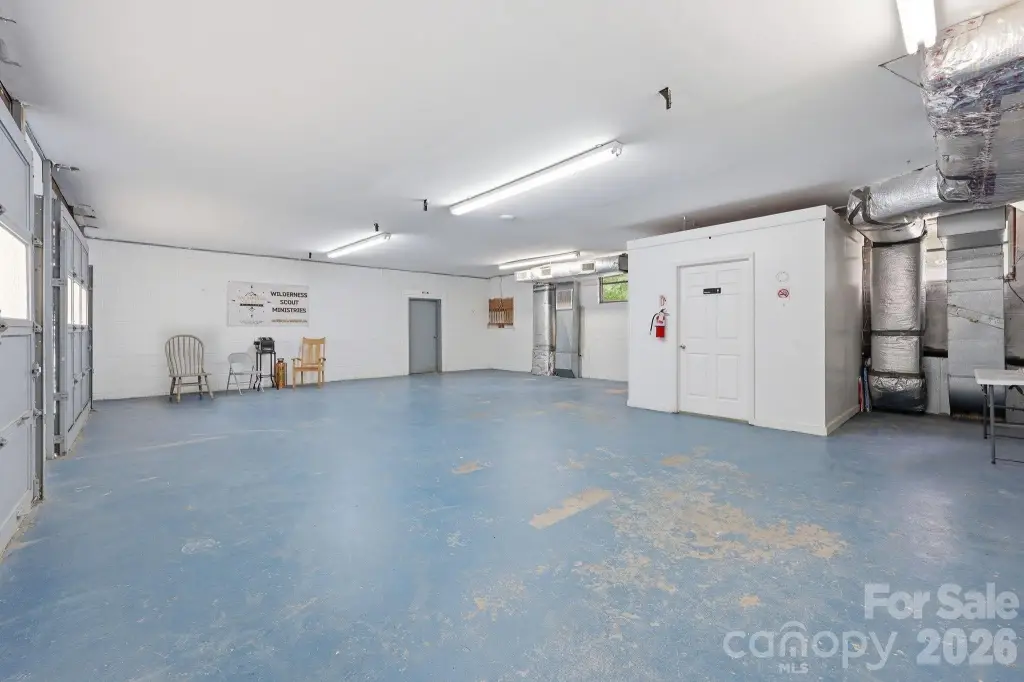
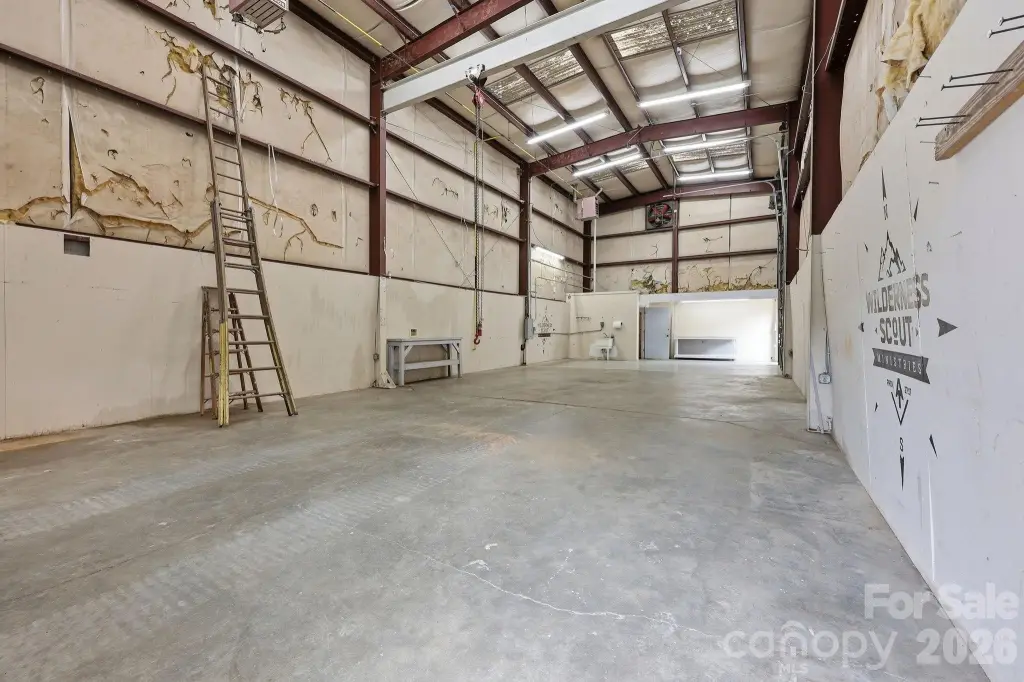
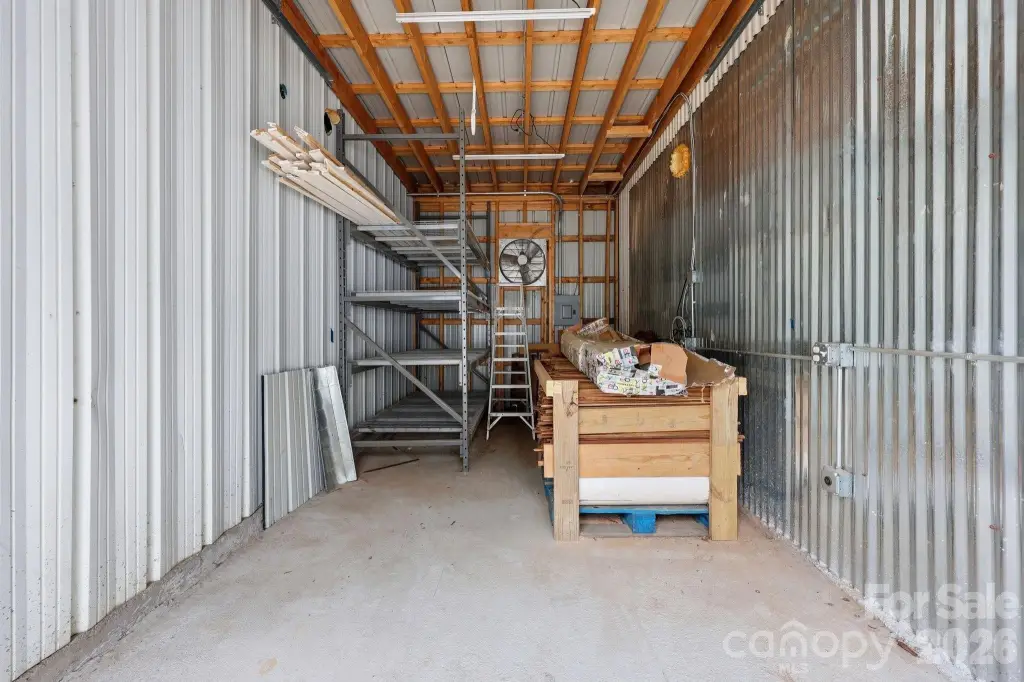
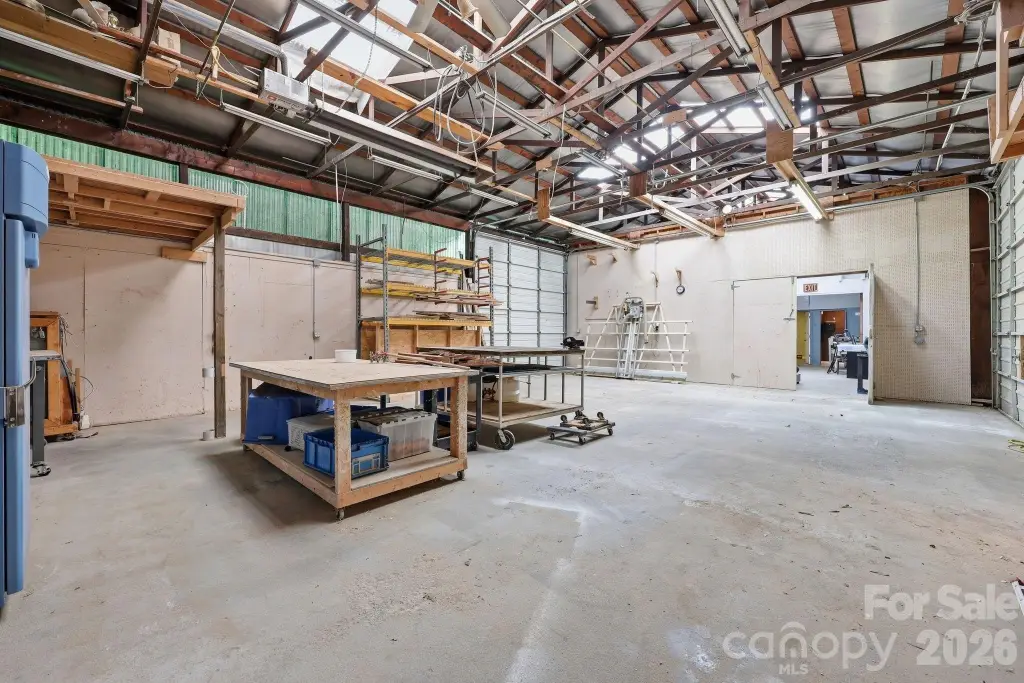
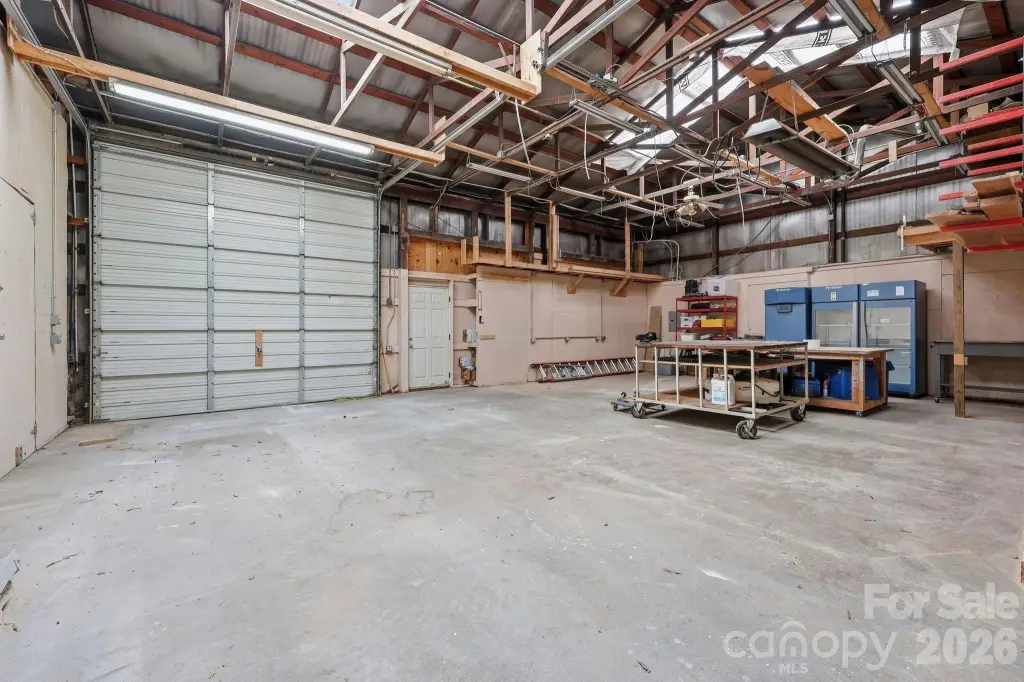
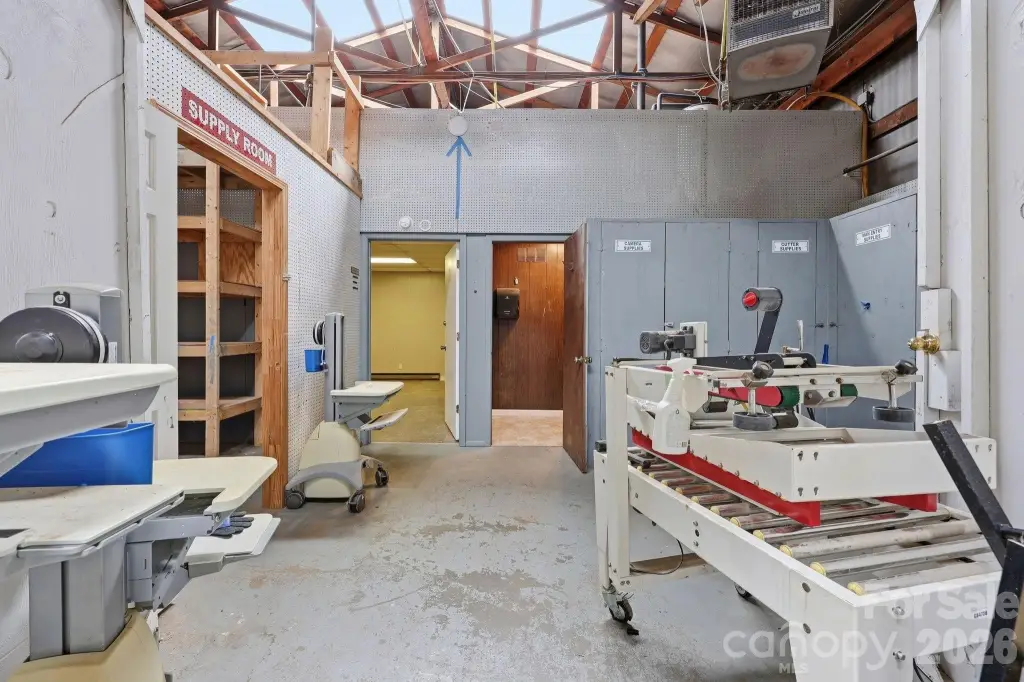
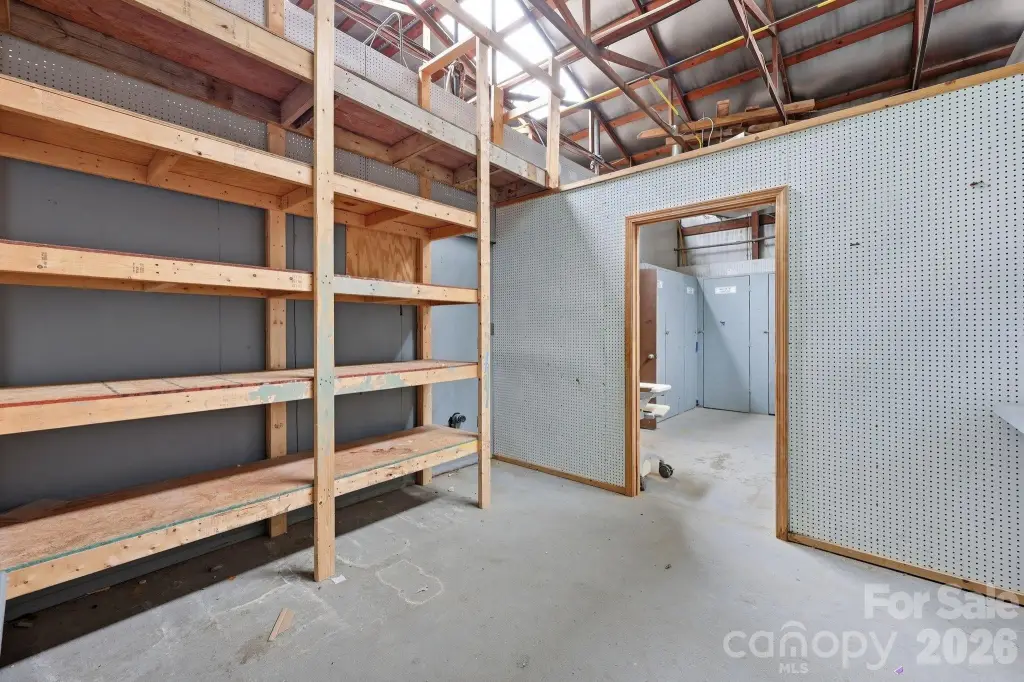
This occupied flex property comprises three buildings on a 0.82-acre site in Monroe, North Carolina. Public commercial records reference approximately 6,400 square feet of warehouse and light industrial improvements, with grade-level access supporting storage, fabrication, distribution, light manufacturing, and service operations. The multi-building arrangement provides separate areas for ongoing commercial activity and can accommodate owner-user or multi-tenant use.
Built in 1965, the property is located on John Moore Road in Union County, with access to major transportation corridors serving the county and the broader Charlotte region. Existing occupancy provides established operational use, while the combination of land area, multiple structures, and industrial improvements offers functional flexibility for businesses requiring warehouse, contractor, service, or flex space.
Built in 1965, the property is located on John Moore Road in Union County, with access to major transportation corridors serving the county and the broader Charlotte region. Existing occupancy provides established operational use, while the combination of land area, multiple structures, and industrial improvements offers functional flexibility for businesses requiring warehouse, contractor, service, or flex space.
Key Highlights
- Three‑building occupied commercial property
- Approximately 6,400 square feet of warehouse/light industrial improvements
- 0.82‑acre site on John Moore Road
Financial Insights
Estimated NOI and Cap Rate
NOI / Yr
$74,141
Cap Rate
6.18%
Suggested Prices Based on Cap Rates
Cap Rate 5%
$1,482,820
$1.5M
Cap Rate 7%
$1,059,157
$1.1M
Cap Rate 9%
$823,789
$823.8K
Market Conditions
NOI Build-Up for 6,400 SF
Gross rent
$121.3K $18.96/SF
− Vacancy
−$7.3K −$1.14/SF
EGI
$114.1K $17.82/SF
− OpEx
−$39.9K −$6.24/SF
NOI
$74.1K $11.58/SF
Area
Union County, NC
Vacancy
6.00%
Lease Rate
$18.96 /SF/Yr
Expense Ratio
35.00%
Simulate Cap Rate and NOI
Suggested Prices Based on Cap Rates
Cap Rate 5%
$1,482,820
Cap Rate 7%
$1,059,157
Cap Rate 9%
$823,789
Alternative Uses
Best Use
Flex RnD
$1.06M
$926.8K – $1.24M
NOI $74,141 @ 7.0% cap · market cap 6.18%
Second Best
Warehouse
$664.5K
$581.4K – $775.2K
NOI $46,512 @ 7.0% cap · market cap 3.88%
Theoretical Best
Office A
$1.98M
$1.73M – $2.31M
NOI $138,378 @ 7.0% cap · market cap 11.53%
Zoning and permitted uses should be independently verified with authorities.
How Realmo checks its estimates
Property Analytics
Unlock full access to Insights
Subscribe to Realmo Intelligence
Open Analytics
Current Use
Location Intelligence
Trade Area within ½ mile
206
Businesses Nearby
Under-served
Demand for This Use
Explore this area
Business Placement
Demographics for 28110, NC
53,316
Population
20,236
Households
2.6
Avg Household Size
37
Median Age
24%
College-Educated
87%
High-School Grad
127.4 sq mi
ZIP Area
418
Density / Sq Mi
$81,221
Median Household Income
$41,425
Median Earnings
$1,313
Median Rent
$302,600
Median Home Value
Check the figures for this property
Cap Rate, Value Estimation, Potential NOI and more
View Realmo Analytics
Market
Vacancy Rate% for Industrial in South region


Frequently Asked Questions
What type of property is this?
Flex space - Industrial improvements provide grade-level access for active commercial use.
Where is this flex space located?
The property is located at 1819 John Moore Road Monroe, NC.
What is the asking price?
The asking price for this property is $1,200,000.
What are key features of this property?
This property features: Three‑building occupied commercial property; Approximately 6,400 square feet of warehouse/light industrial improvements; 0.82‑acre site on John Moore Road


