Mixed-Use Property with Detached
For Sale
$585,000
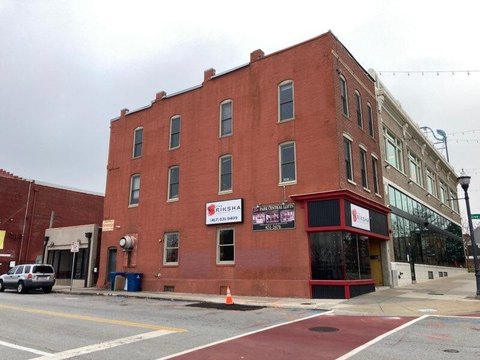
1816 S Franklin Avenue, Springfield, MO 65807
Commercial Sale, Springfield, MO
Property SizeContact for details
Lot Size0.42 Acres
Days on Market563
Property Features for 1816 S Franklin Avenue
General Information
Property type
Commercial Sale
Property subtype
Other
Zoning
HC
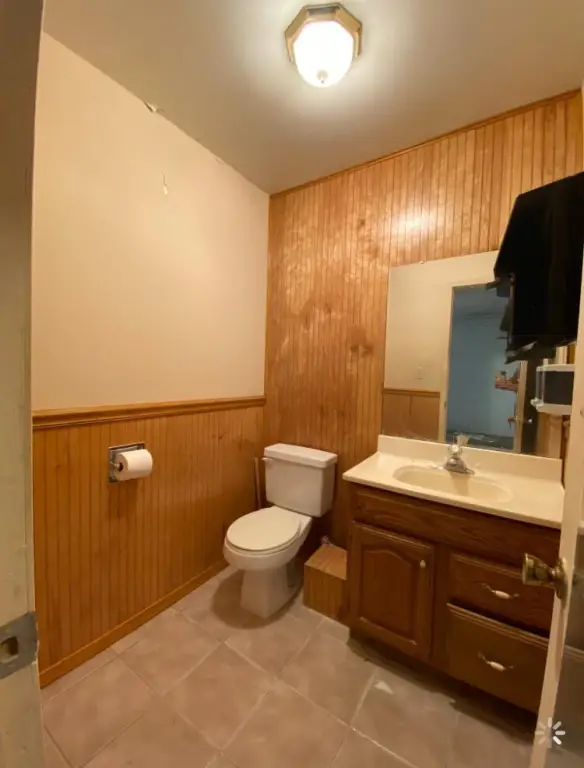
Bathrooms
2
Full bathrooms
2
Rooms
Bathroom 2, Bathroom 1
Parking features
Garage - Detached
Fencing
Perimeter, Chain Link
Subdivision
Highland Terr
Lot features
Level
Directions
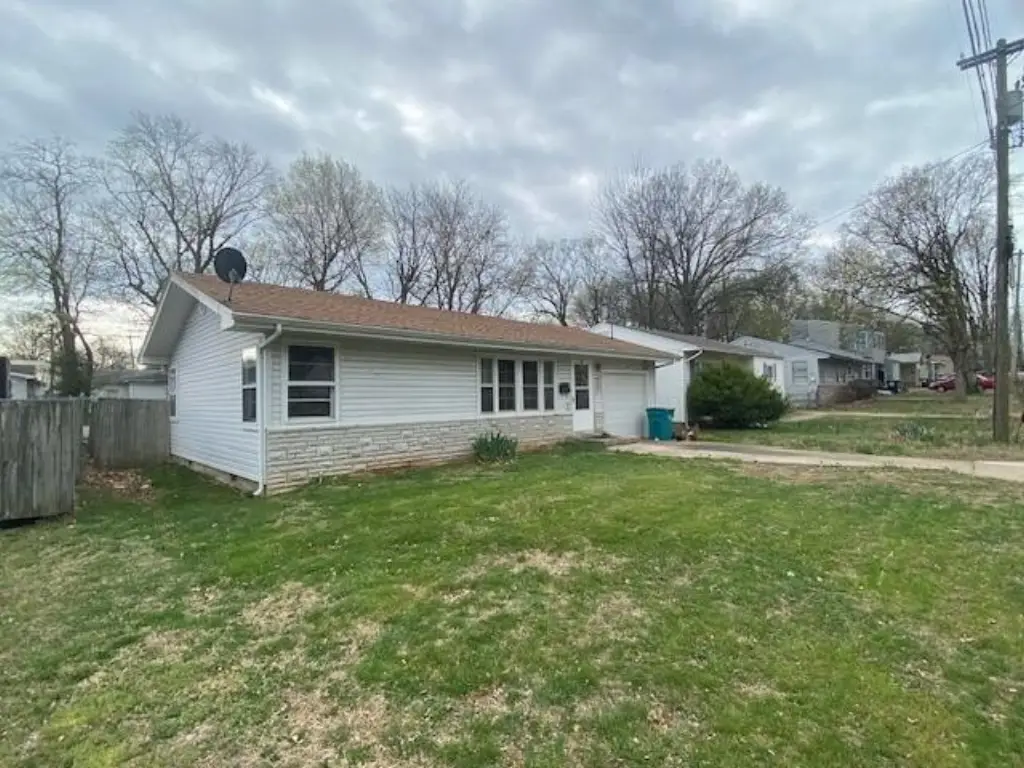
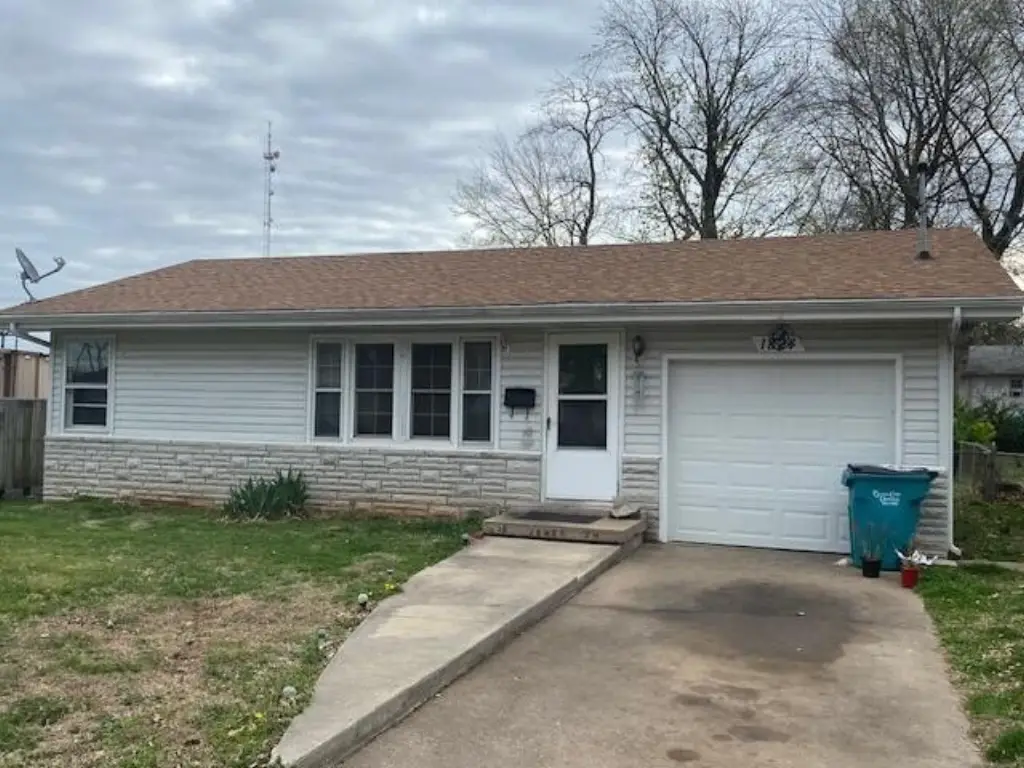
At Kansas and Sunshine travel East to Franklin then turn Right. Business is on the left and Additional Comm space is directly behind the primary. Residential home is to the right of the primary comm space.
Standard status
Active
APN
1335204027
Lot size
0.42 Acres
Taxes and HOA fees
Tax Year
2024
Tax Description
HIGHLAND TERR LOT 6 7 & 27 BLK C
Tax Annual Amount
2543
Legal Description
HIGHLAND TERR LOT 6 7 & 27 BLK C
Utilities
Heating system
Forced Air, Natural Gas
Cooling system
Electric, Central Air
Amenities
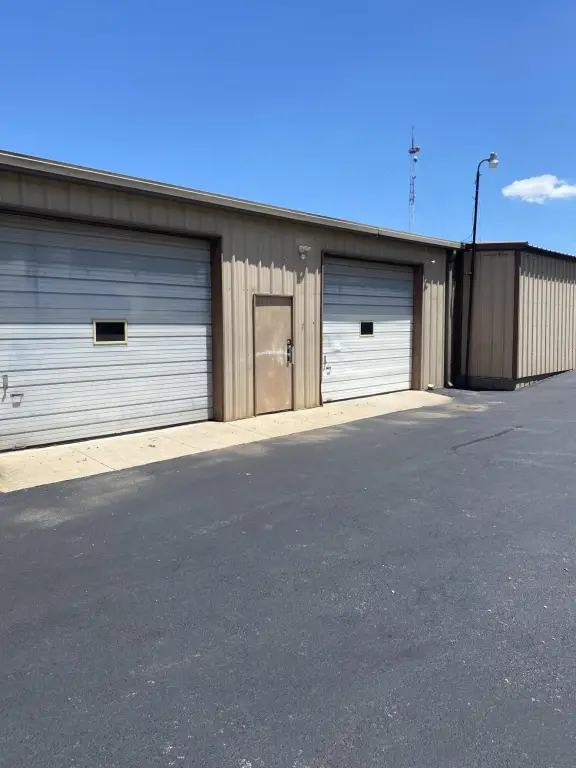
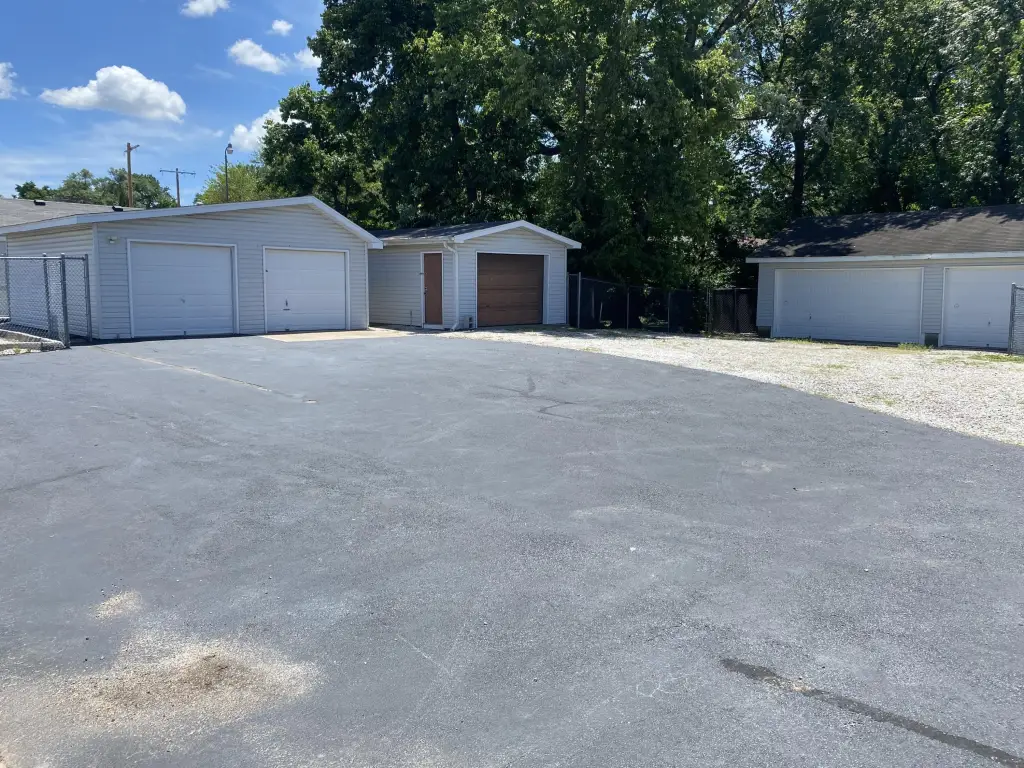
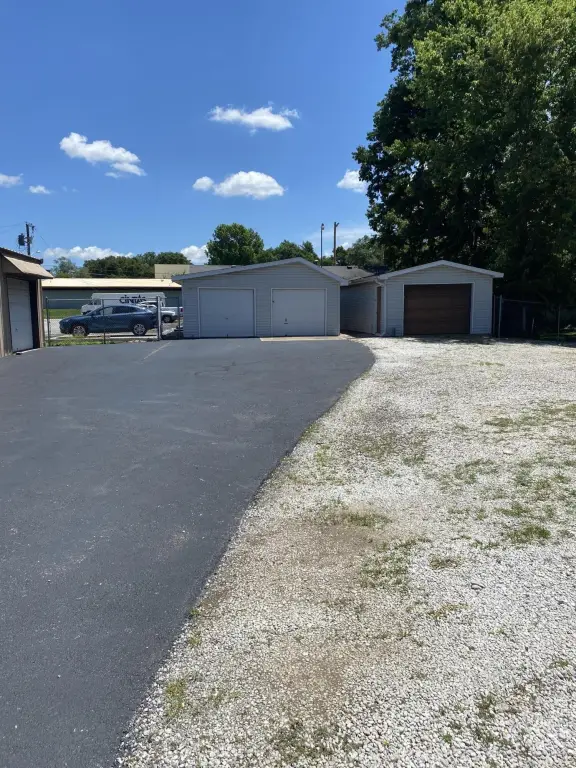
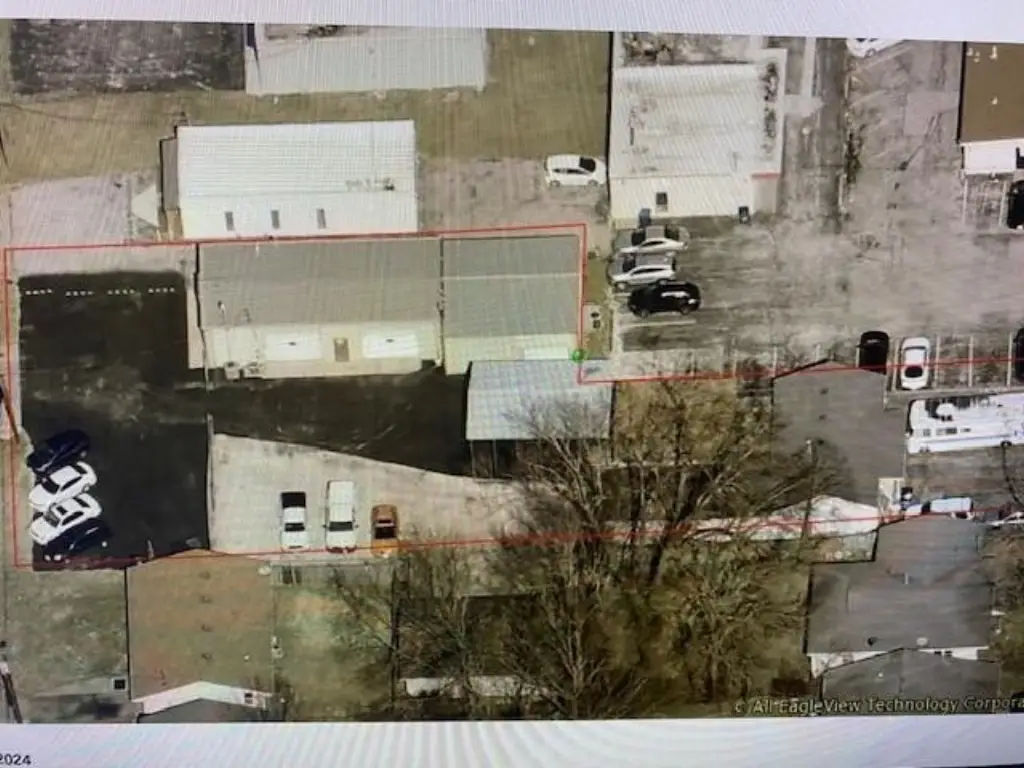
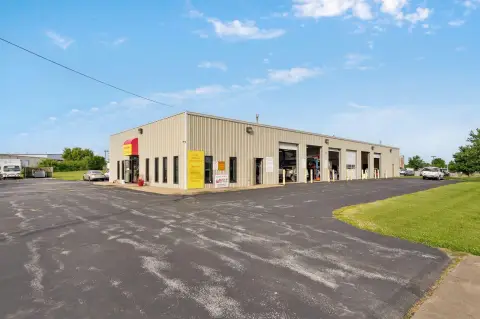
detached garages
newly paved asphalt
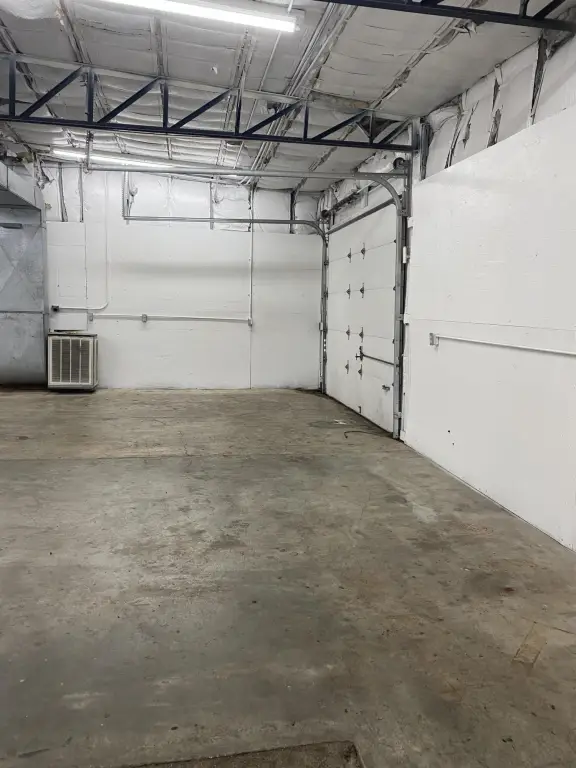
bay doors
Building Details
Year built
1984
Number of units
2
Listing Agency:
Alpha Realty MO, LLC
(417) 719-1560
Listed By:
Ryan Stewart · License #2016017272
(417) 818-4215
Added: Mar 28, 2025
Changed: Sep 16
Last Checked: Oct 11 at 10:06AM
MLS# 60290355
Copyright © 2026 Southern Missouri Regional MLS, LLC (SOMO). All rights reserved. All information provided by the listing agent/broker is deemed reliable but is not guaranteed and should be independently verified.
Investment Insights
Based on property information with market context.
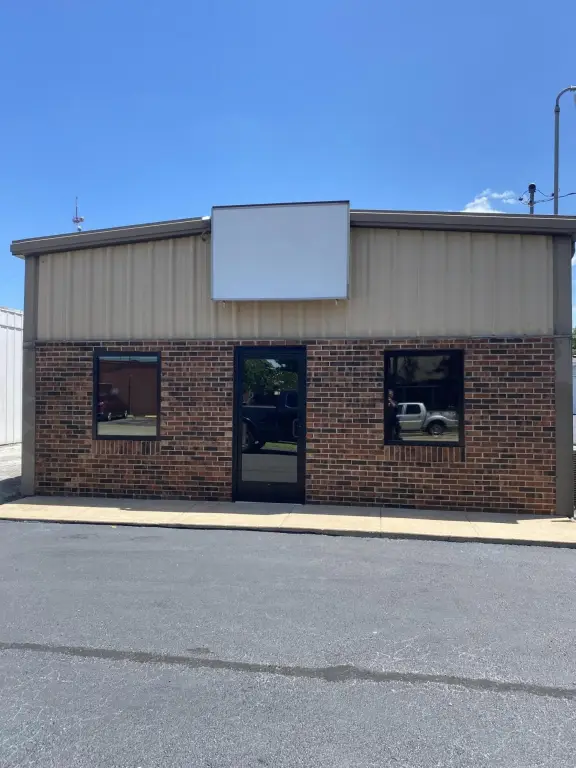
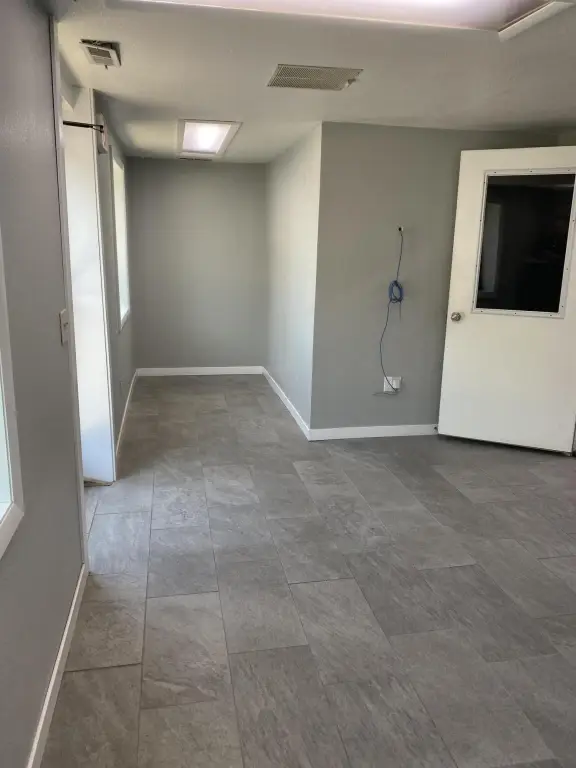
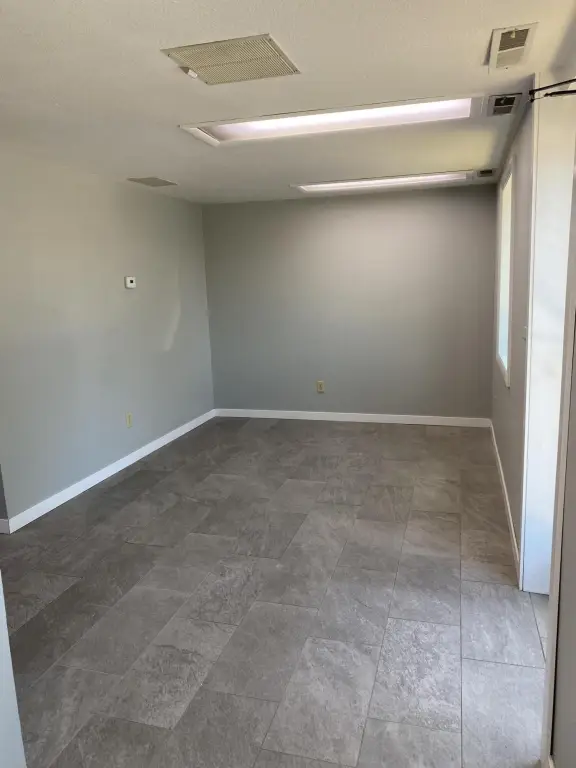
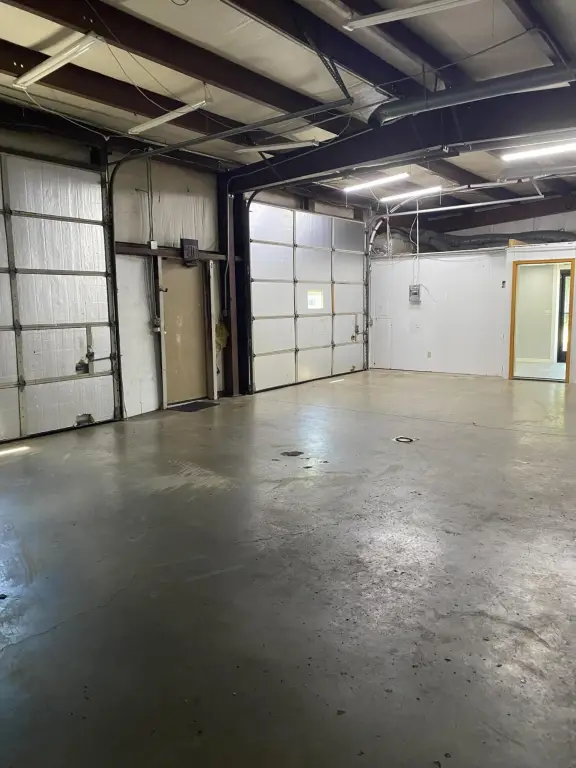
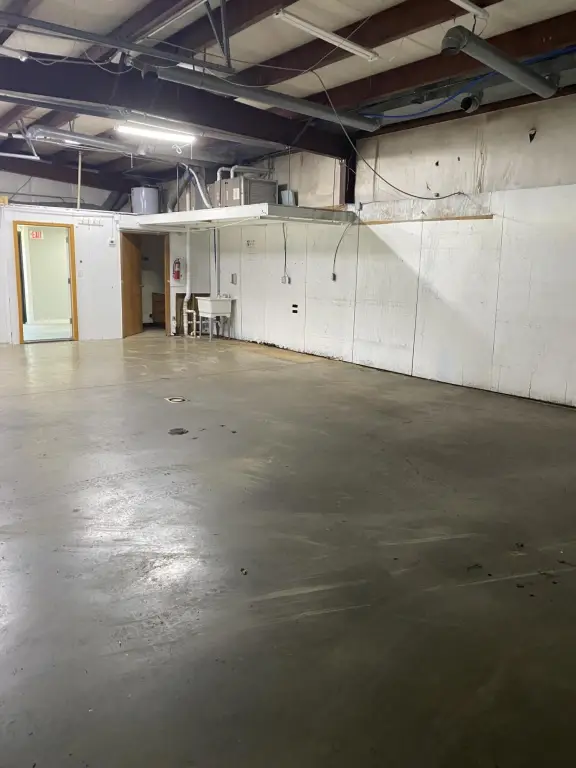
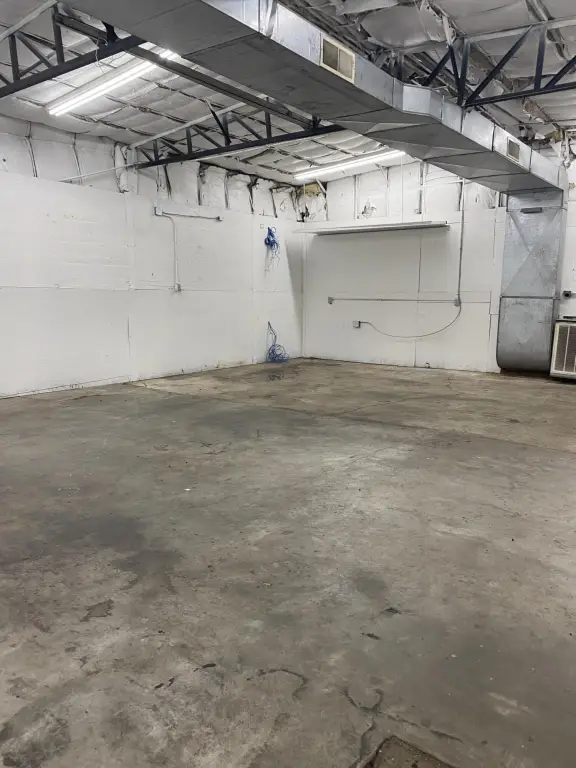
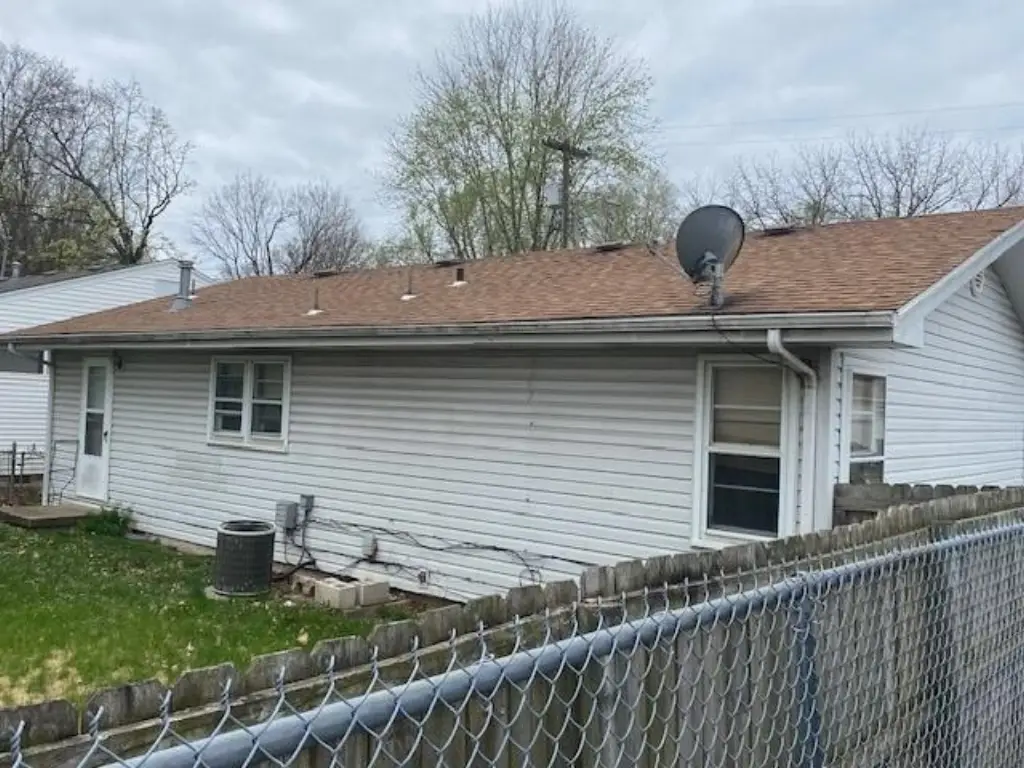
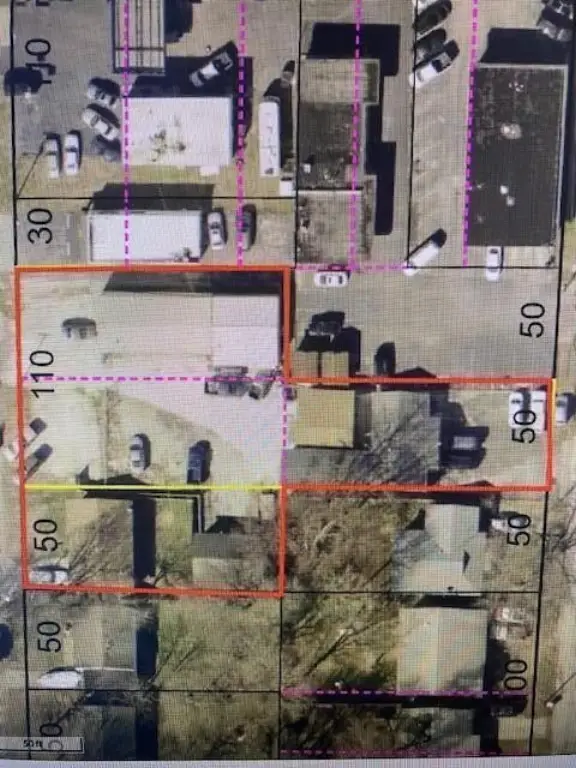
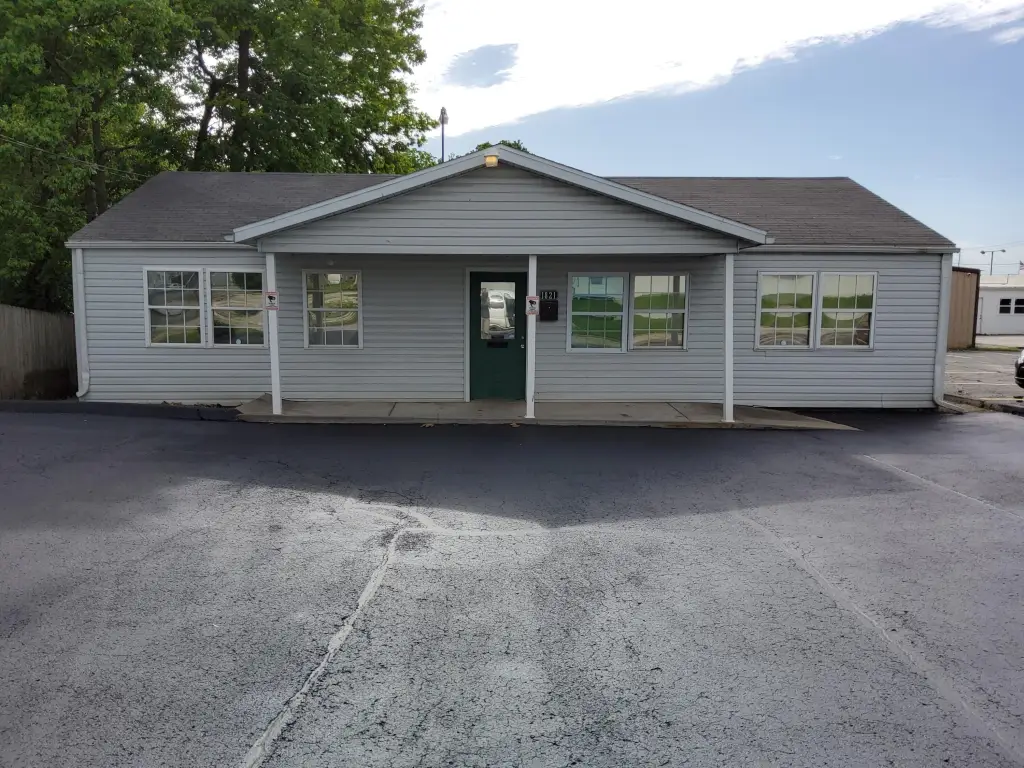
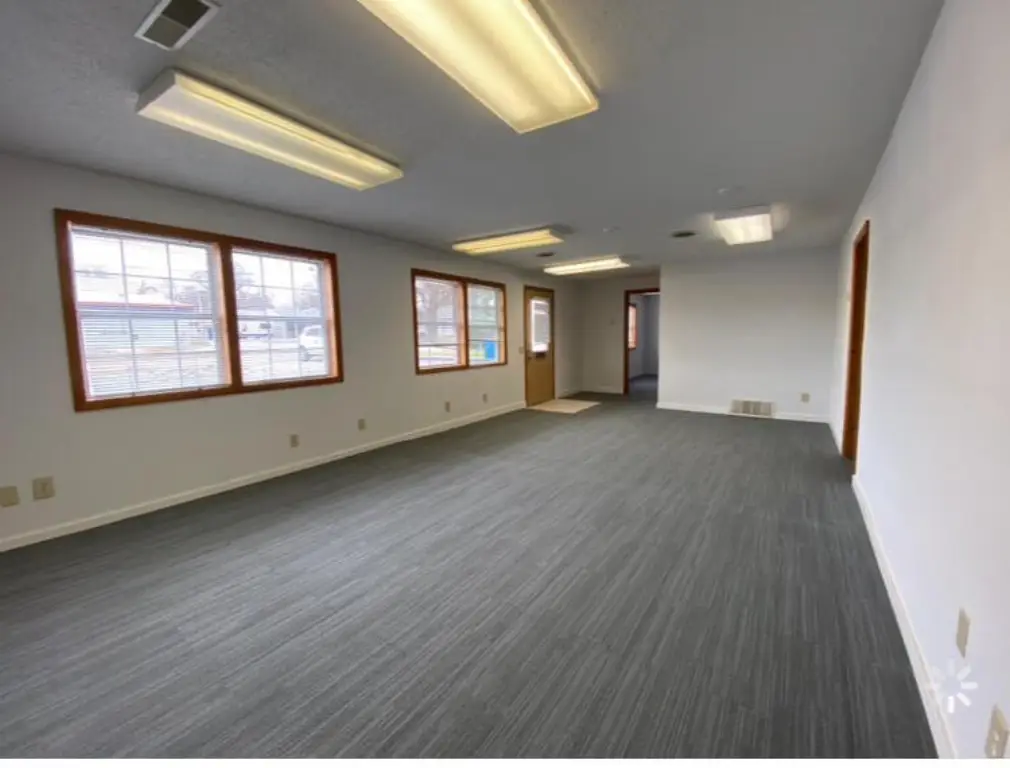
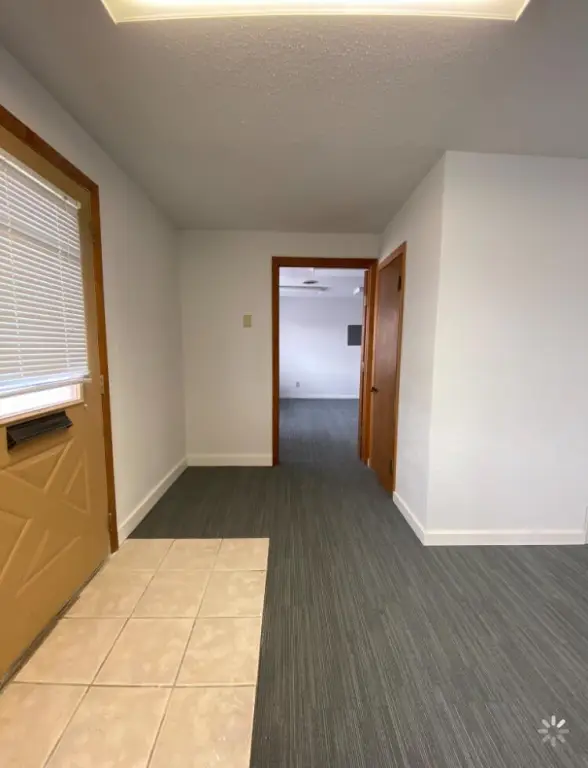
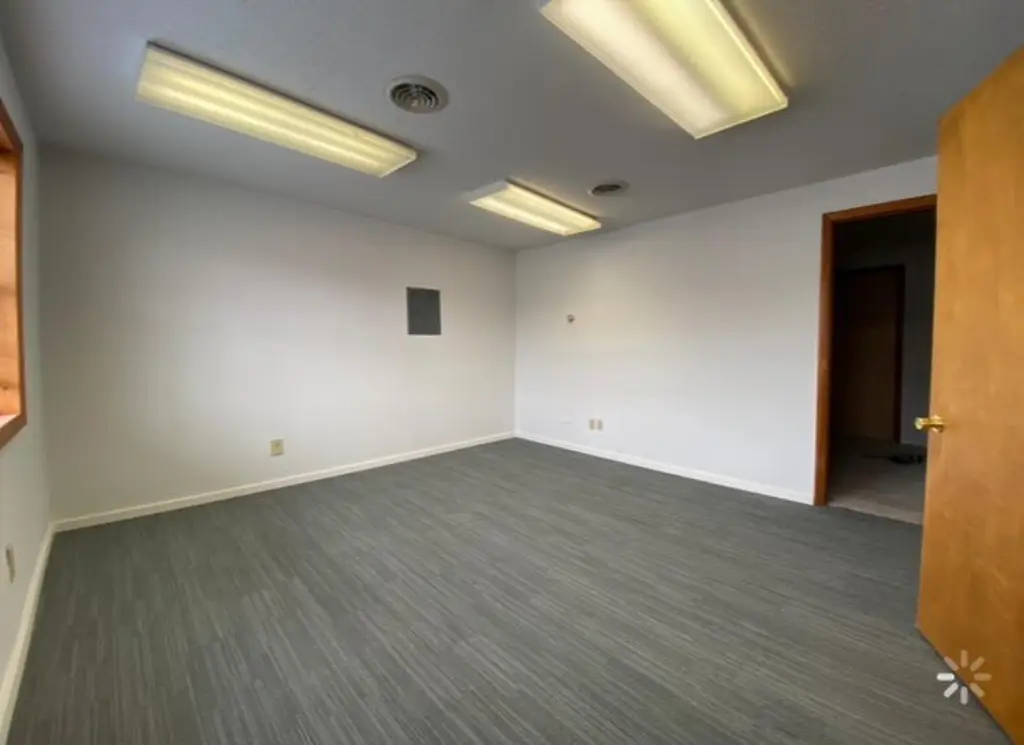
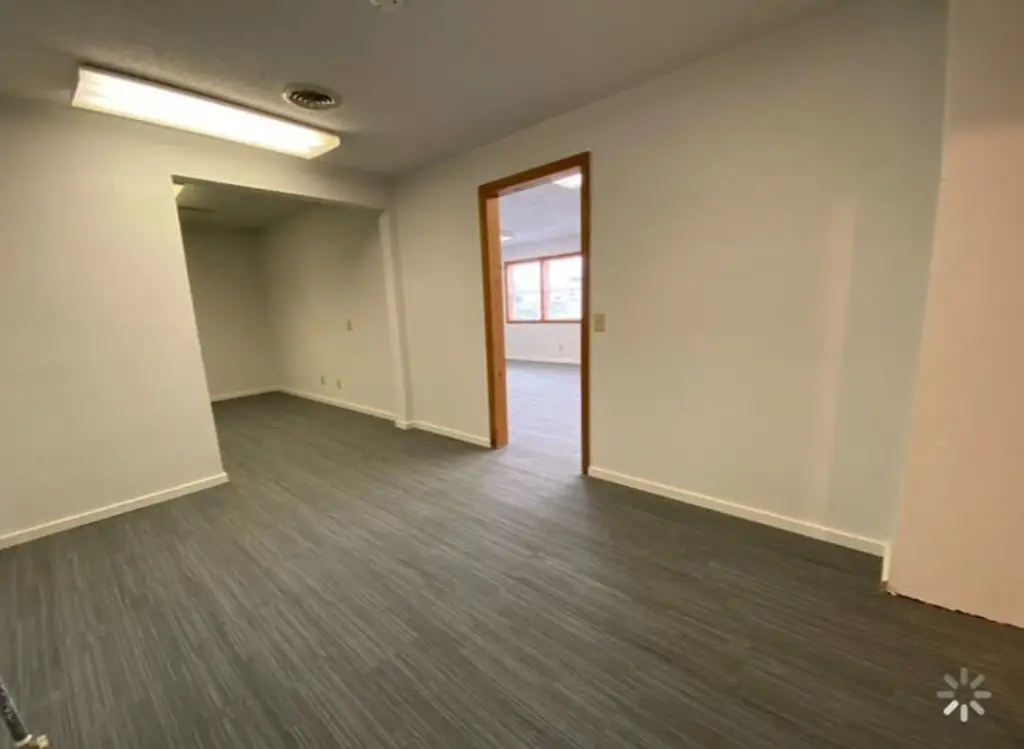
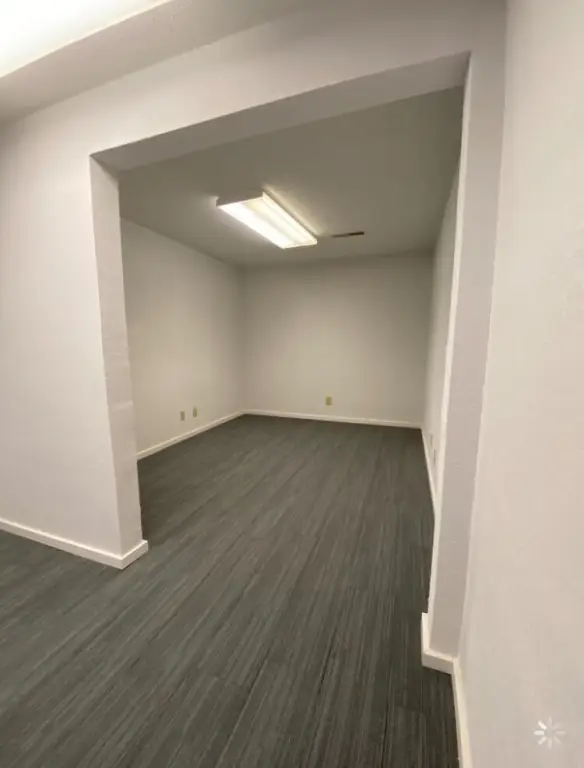
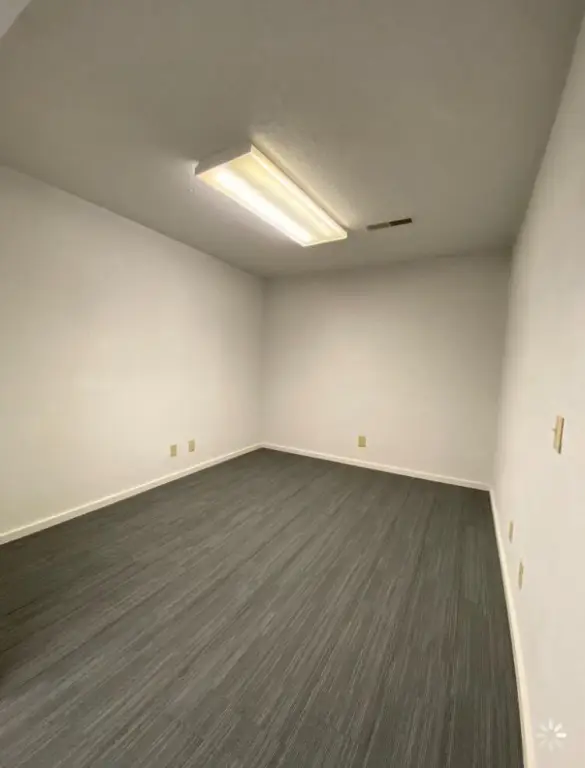
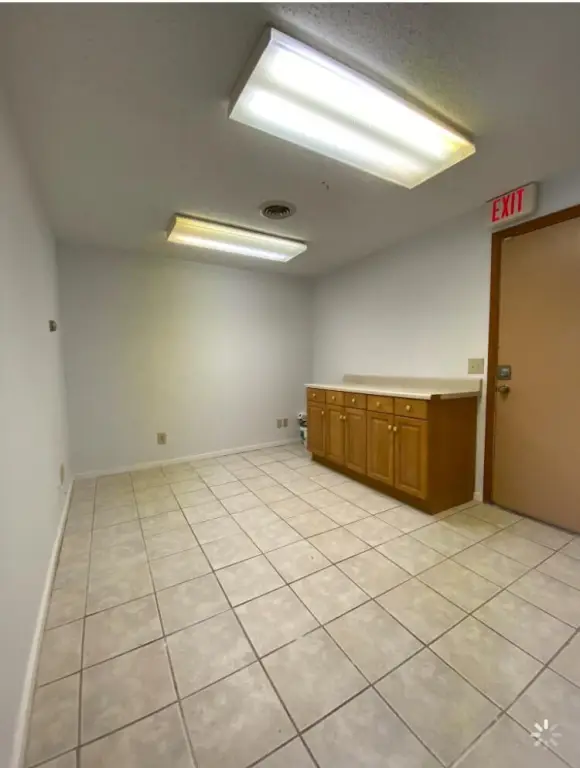
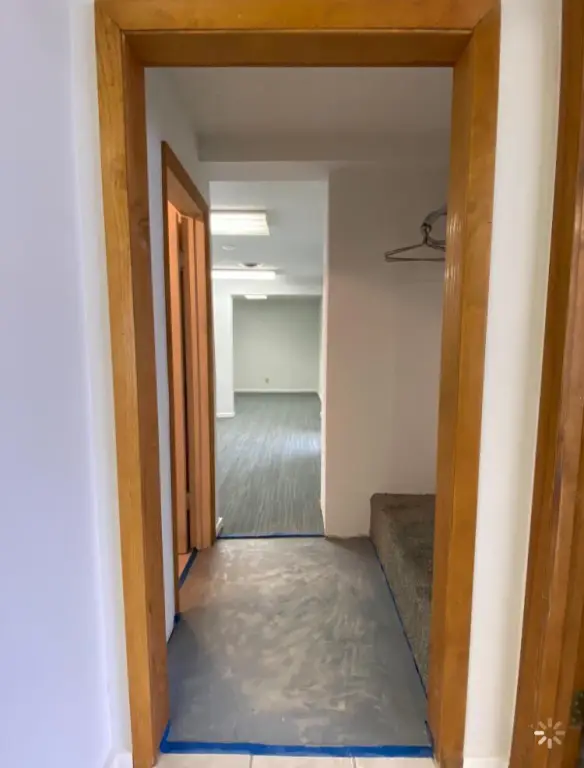
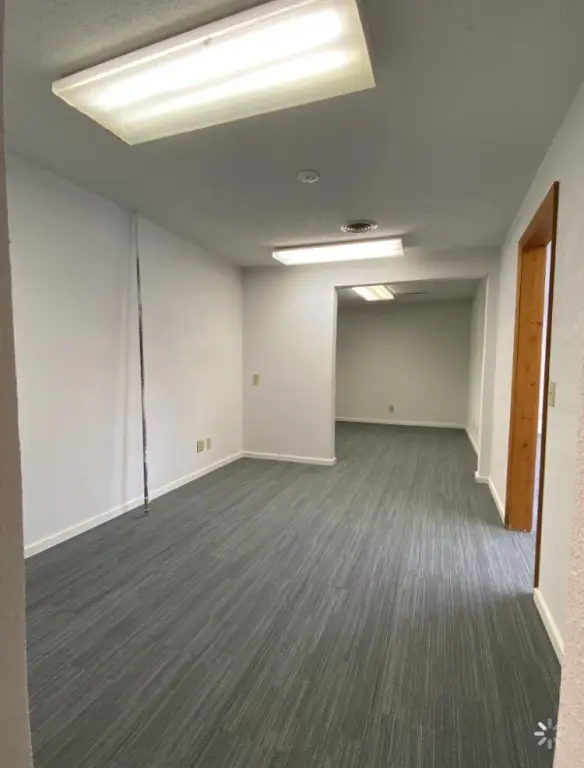
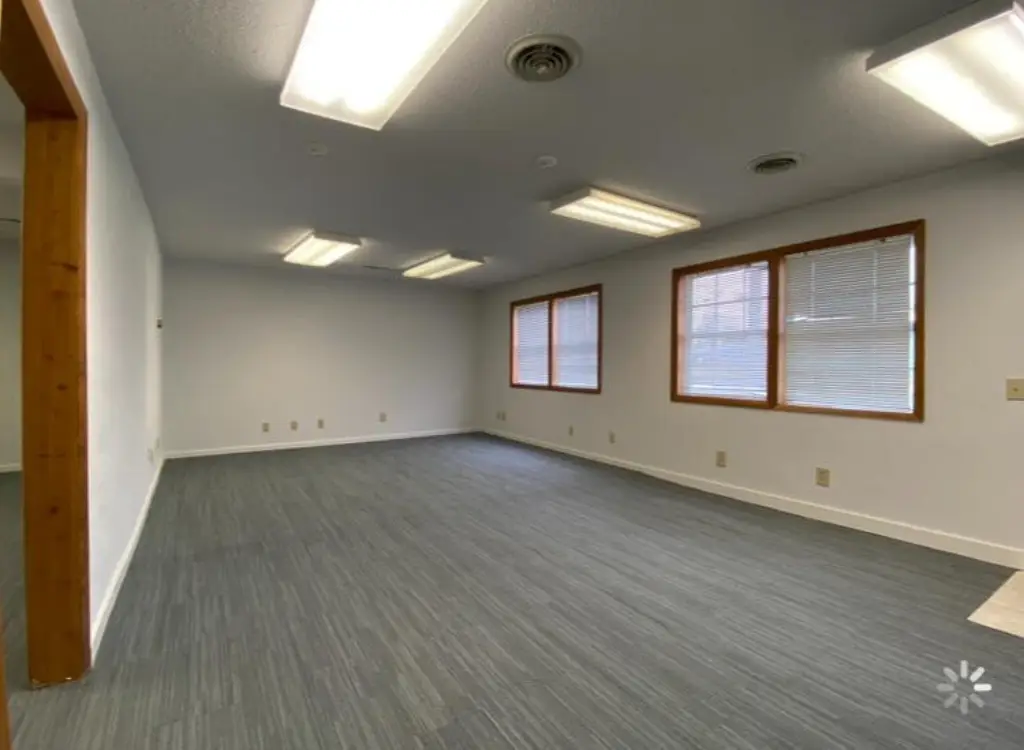
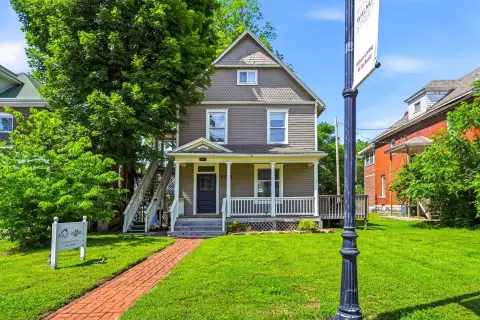
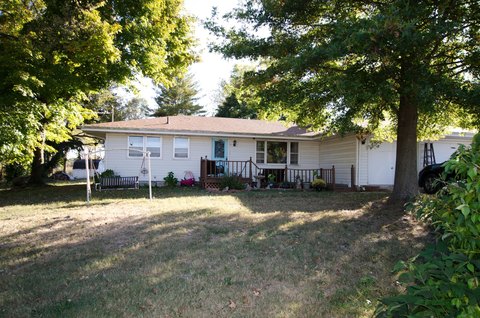
This mixed-use package includes two commercial spaces and a residential home next door to the primary commercial building. The commercial component totals 3,156 square feet, while the residence contains 850 square feet. A recently paved asphalt area provides a finished surface in front of the main commercial space, and detached garages add enclosed storage for vehicles or equipment. Perimeter and chain-link fencing are also present.
The property occupies 0.42 acres near Bass Pro and just off Sunshine and Fort. Two of the three properties are currently income producing. HC zoning requires the commercial and residential components to be sold together rather than separately. The configuration includes bay-door and work-space characteristics identified for automotive, roofing, utility, and other service-related operations.
The property occupies 0.42 acres near Bass Pro and just off Sunshine and Fort. Two of the three properties are currently income producing. HC zoning requires the commercial and residential components to be sold together rather than separately. The configuration includes bay-door and work-space characteristics identified for automotive, roofing, utility, and other service-related operations.
Key Highlights
- Two commercial spaces plus one residential home sold as a single package
- 3,156 SF of total commercial space and 850 SF of residential space
- 0.42‑acre property near Bass Pro and just off Sunshine and Fort
Property Analytics
Unlock full access to Insights
Subscribe to Realmo Intelligence
Open Analytics
Current Use
Lease Details
Yes
Highway access
Yes
Paved road access
Location Intelligence
Trade Area within ½ mile
531
Businesses Nearby
Explore this area
Business Placement
Demographics for 65807, MO
55,168
Population
28,546
Households
1.9
Avg Household Size
36
Median Age
33%
College-Educated
94%
High-School Grad
21.0 sq mi
ZIP Area
2,627
Density / Sq Mi
$50,271
Median Household Income
$33,510
Median Earnings
$994
Median Rent
$174,000
Median Home Value
Check the figures for this property
Cap Rate, Value Estimation, Potential NOI and more
View Realmo Analytics
Market
Vacancy Rate% for Retail in Midwest region

Questions? Ask Rey
Realmo’s AI knows this listing — price, zoning, demand, history. Ask anything.





Frequently Asked Questions
What type of property is this?
Mixed-use property - HC-zoned package combines commercial space with a neighboring residential home.
Where is this mixed-use property located?
The property is located at 1816 S Franklin Avenue Springfield, MO.
What is the asking price?
The asking price for this property is $585,000.
What are key features of this property?
This property features: Two commercial spaces plus one residential home sold as a single package; 3,156 SF of total commercial space and 850 SF of residential space; 0.42‑acre property near Bass Pro and just off Sunshine and Fort


