Mixed-Use Property with
For Sale
Contact for pricing
18 Mckabe Road, Colton, NY 13625
Restaurant operations, living quarters, equipment, garage space, and landscaped outdoor amenities are combined in one property.
Property Size4,500 SF
Price / SF$85.56
Days on Market165
Property Features for 18 Mckabe Road
General Information
Standard status
Active
Size
4,500 SF
Total Parking Spaces
4
Property subtype
Retail, Mixed Use, Business for Sale
Additional Details
Business Included
Yes
Equipment Included
Yes
Listing Agency:
Trego Realty Group LLC
Listed By:
Liz Trego · License #10491210659
Source:
Crexi
Added: May 6
Changed: Oct 3
Last Checked: Oct 16 at 8:37AM
Displayed information is deemed reliable but is not guaranteed and should be independently verified. All listing content including descriptions, pricing, images are the copyrighted material of Trego Realty Group LLC

Ask AI about this property
Review the available facts, identify missing information and prepare questions for the agent.
Investment Insights
Based on property information with market context.
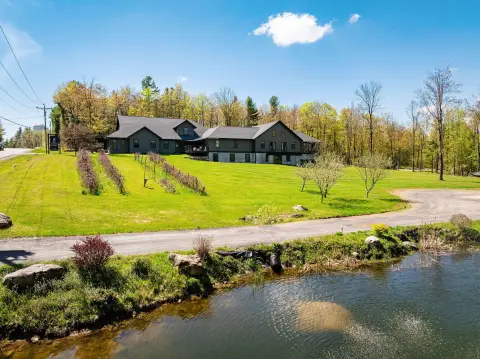
This 4,500 SF mixed-use property combines an established take-out restaurant with an attached residential component and substantial accessory improvements. The restaurant area includes commercial equipment installed new 4 years ago, a reception and checkout area, prep room, half bathroom, separate employee entrance, storage and delivery garage, and a paved, lined parking area. The adjoining 3/4-bedroom living space offers a primary suite, modern kitchen, pantry, breakfast bar, living room, recreation room, two propane fireplaces, bar, and finished interior details.
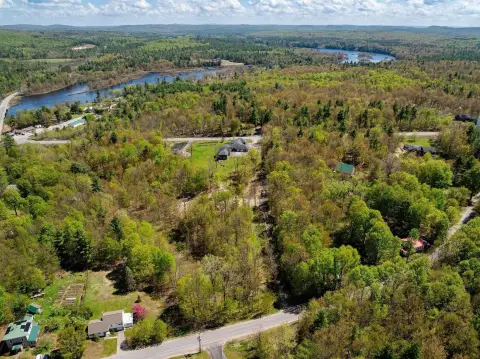
A 3-year-old, 44' x 40' insulated, finished, heated garage addition provides additional workspace along with two finished offices. Outdoor improvements include a covered deck, an 18' x 40' oval above-ground pool, hot tub enclosure, paver pathways, cooking fireplace, elevated garden and sitting area, waterfall, pond, and landscaped lawn. The property is located near the Racquette River and state parks in the foothills of the Adirondacks.
A 3-year-old, 44' x 40' insulated, finished, heated garage addition provides additional workspace along with two finished offices. Outdoor improvements include a covered deck, an 18' x 40' oval above-ground pool, hot tub enclosure, paver pathways, cooking fireplace, elevated garden and sitting area, waterfall, pond, and landscaped lawn. The property is located near the Racquette River and state parks in the foothills of the Adirondacks.
Key Highlights
- 4,500 SF mixed‑use property with restaurant and attached 3/4‑bedroom living space
- Restaurant equipment installed new 4 years ago, with prep room and reception area
- 3‑year‑old, 44' x 40' insulated, finished, heated garage addition
Financial Insights
Estimated NOI and Cap Rate
NOI / Yr
$30,375
Cap Rate
7.89%
Suggested Prices Based on Cap Rates
Cap Rate 5%
$607,500
$607.5K
Cap Rate 7%
$433,929
$433.9K
Cap Rate 9%
$337,500
$337.5K
Market Conditions
NOI Build-Up for 4,500 SF
Gross rent
$54.0K $12.00/SF
− Vacancy
−$5.4K −$1.20/SF
EGI
$48.6K $10.80/SF
− OpEx
−$18.2K −$4.05/SF
NOI
$30.4K $6.75/SF
Area
St. Lawrence County, NY
Vacancy
10.00%
Lease Rate
$12.00 /SF/Yr
Expense Ratio
37.50%
Simulate Cap Rate and NOI
Suggested Prices Based on Cap Rates
Cap Rate 5%
$607,500
Cap Rate 7%
$433,929
Cap Rate 9%
$337,500
Alternative Uses
Best Use
Specialty Retail
$997.7K
$873.0K – $1.16M
NOI $69,838 @ 7.0% cap · market cap 18.14%
Second Best
Mixed Use
$433.9K
$379.7K – $506.3K
NOI $30,375 @ 7.0% cap · market cap 7.89%
Theoretical Best
Office A
$1.12M
$976.9K – $1.30M
NOI $78,149 @ 7.0% cap · market cap 20.30%
Zoning and permitted uses should be independently verified with authorities.
How Realmo checks its estimates
Property Analytics
Unlock full access to Insights
Subscribe to Realmo Intelligence
Open Analytics
Current Use
Lease Details
Turnkey business
Opportunity
Location Intelligence
Trade Area within ½ mile
47
Businesses Nearby
3k
Monthly Visits Nearby
Explore this area
Business Placement
Foot Traffic Nearby
Shops & Services 100%
Dollar General
Shops & Services
2,930 visits/mo
0.3 miles
Demographics for 13625, NY
1,834
Population
1,119
Households
1.6
Avg Household Size
47
Median Age
32%
College-Educated
95%
High-School Grad
54.5 sq mi
ZIP Area
34
Density / Sq Mi
$76,711
Median Household Income
$42,358
Median Earnings
$381
Median Rent
$161,900
Median Home Value
Check the figures for this property
Cap Rate, Value Estimation, Potential NOI and more
View Realmo Analytics
Market
Vacancy Rate% for Retail in Northeast region
Frequently Asked Questions
What type of property is this?
Mixed-use property - Restaurant operations, living quarters, equipment, garage space, and landscaped outdoor amenities are combined in one property.
Where is this mixed-use property located?
The property is located at 18 Mckabe Road Colton, NY.
What is the asking price?
The asking price for this property is $385,000.
What are key features of this property?
This property features: 4,500 SF mixed‑use property with restaurant and attached 3/4‑bedroom living space; Restaurant equipment installed new 4 years ago, with prep room and reception area; 3‑year‑old, 44' x 40' insulated, finished, heated garage addition


