10-Room SRO Multifamily
For Sale
Contact for pricing
18 Maple Avenue, Staten Island, NY 10302
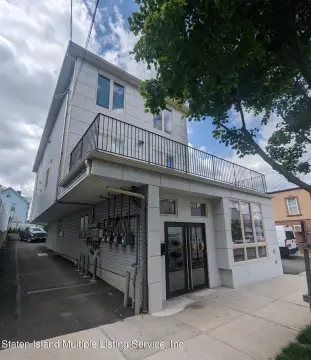
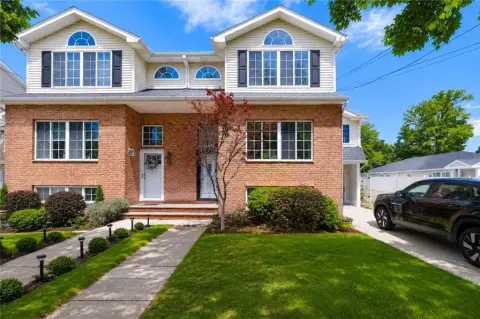
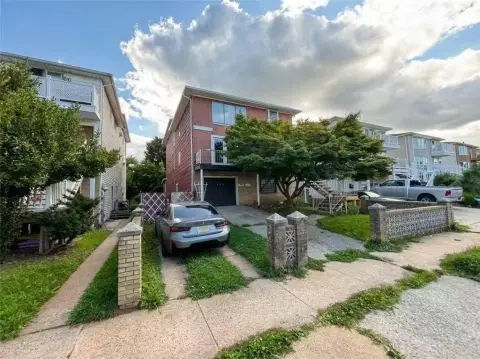
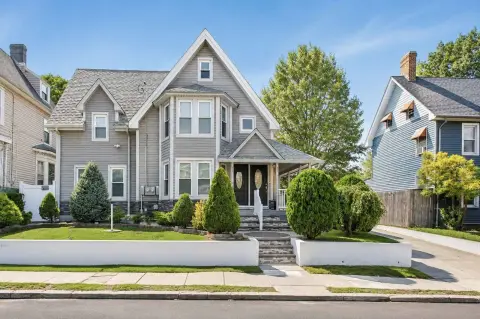
Renovated kitchens, bathrooms, electrical systems, and fire-rated partitions support the rooming-house configuration.
Property Size3,818 SF
Price / SF$235.46
Days on Market164
Property Features for 18 Maple Avenue
General Information
Standard status
Active
Size
3,818 SF
Class
Class B
Property subtype
Special Purpose
Zoning
R4 / C2-1
Occupancy
60%
Lease Type
Gross
Investment Type
Value Add
Net Operating Income
$51,623
Financials
Gross Income
$114,278
Opportunity Zone
Yes
Site & Location
Highway Access
Yes
Public Transit
Yes
Additional Details
Multifamily Units
10
Amenities
shared kitchen
shared bathroom
master-metered utilities
Building Details
Year Built
1899
Year Renovated
2017
Buildings
1
Stories
3
Units
10
Tenancy
Multi
Listing Agency:
Cornerstone Realty
Listed By:
Francis Rizzo · License #NY 10311205734
Source:
Crexi
Added: May 13
Changed: Oct 19
Last Checked: Oct 23 at 7:22AM
Displayed information is deemed reliable but is not guaranteed and should be independently verified. All listing content including descriptions, pricing, images are the copyrighted material of Cornerstone Realty

Ask AI about this property
Review the available facts, identify missing information and prepare questions for the agent.
Investment Insights
Based on property information with market context.
This 3,818-square-foot multifamily property is a 10-room Class B SRO rooming house built in 1899. Six rooms are leased and four are vacant, with shared kitchen and bathroom facilities serving the rooms. Prior improvements include updated kitchens and bathrooms, electrical work, and fire-rated interior partitions associated with 2017 legalization plans. Utilities are master-metered.
The property is located at 18 Maple Avenue in Staten Island’s Port Richmond / North Shore submarket. Nearby transportation and regional connections include Richmond Terrace, Bayonne Bridge access, Staten Island Expressway access, and public transit toward the St. George Ferry Terminal. Richmond University Medical Center, Faber Park, and waterfront amenities are also identified in the surrounding area.
The asset is zoned R4 / C2-1 and lies within a designated Opportunity Zone. The property’s SRO registration, legal use, occupancy, zoning, violations, and regulatory compliance require independent verification.
The property is located at 18 Maple Avenue in Staten Island’s Port Richmond / North Shore submarket. Nearby transportation and regional connections include Richmond Terrace, Bayonne Bridge access, Staten Island Expressway access, and public transit toward the St. George Ferry Terminal. Richmond University Medical Center, Faber Park, and waterfront amenities are also identified in the surrounding area.
The asset is zoned R4 / C2-1 and lies within a designated Opportunity Zone. The property’s SRO registration, legal use, occupancy, zoning, violations, and regulatory compliance require independent verification.
Key Highlights
- 10‑room Class B SRO rooming house with 3,818 square feet
- 6 of 10 rooms leased; 4 rooms vacant
- Renovated kitchens and bathrooms, updated electrical, and fire‑rated partitions
Property Analytics
Unlock full access to Insights
Subscribe to Realmo Intelligence
Open Analytics
Lease Details
10
Residential units
Yes
Highway access
Location Intelligence
Trade Area within ½ mile
1,206
Businesses Nearby
Explore this area
Business Placement
Demographics for 10302, NY
20,931
Population
6,927
Households
3
Avg Household Size
35
Median Age
29%
College-Educated
85%
High-School Grad
1.2 sq mi
ZIP Area
17,443
Density / Sq Mi
$76,089
Median Household Income
$43,608
Median Earnings
$1,800
Median Rent
$586,300
Median Home Value
Check the figures for this property
Cap Rate, Value Estimation, Potential NOI and more
View Realmo Analytics
Market
Vacancy Rate% for Multifamily in Northeast region

Frequently Asked Questions
What type of property is this?
Multifamily property - Renovated kitchens, bathrooms, electrical systems, and fire-rated partitions support the rooming-house configuration.
Where is this multifamily property located?
The property is located at 18 Maple Avenue Staten Island, NY.
What is the asking price?
The asking price for this property is $899,000.
What are key features of this property?
This property features: 10‑room Class B SRO rooming house with 3,818 square feet; 6 of 10 rooms leased; 4 rooms vacant; Renovated kitchens and bathrooms, updated electrical, and fire‑rated partitions


