Retail Showroom with
For Sale
$1,200,000
1717-1721 State Street, Schenectady, NY 12304
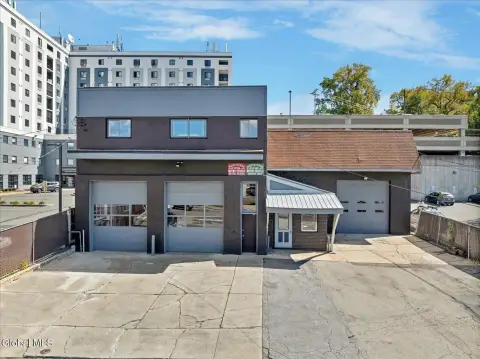
Large showroom includes front counter, offices, breakroom, restrooms, and a fenced yard with separate access.
Property Size8,425 SF
Price / SF$142.43
Days on Market88
Property Features for 1717-1721 State Street
General Information
Standard status
Active
Size
8,425 SF
Total Parking Spaces
25
Property subtype
Industrial
Site & Location
Traffic Count
14,178 vehicles/day
Fenced Yard
Yes
Building Details
Building Size
8,425 SF
Listing Agency:
Pyramidbrokerage
Listed By:
Pyramid Brokerage Albany
(518) 489-9199
Source:
Pyramidbrokerage
Added: Jul 14
Changed: Sep 10
Last Checked: Oct 7 at 8:42AM
Displayed information is deemed reliable but is not guaranteed and should be independently verified. All listing content including descriptions, pricing, images are the copyrighted material of Pyramidbrokerage
Investment Insights
Based on property information with market context.
The property is a built-out retail showroom designed with a prominent counter up front, along with private offices, a breakroom, bathrooms, and rear storage. A full basement is included for storage and maintenance, with grade level door access for convenient handling. The site also features a fenced-in yard, providing an additional controlled outdoor area.
Main parking is accessible via State Street (Route 5), which reports an AADT traffic count of 14,178 (2025). The fenced yard is accessible via Steers Avenue.
On-site parking totals 25 spaces, supporting customer access and day-to-day operations. The combination of showroom interior improvements, basement access, and an enclosed yard makes the space well-suited for retail uses that benefit from both customer-facing presentation and behind-the-scenes storage needs.
Main parking is accessible via State Street (Route 5), which reports an AADT traffic count of 14,178 (2025). The fenced yard is accessible via Steers Avenue.
On-site parking totals 25 spaces, supporting customer access and day-to-day operations. The combination of showroom interior improvements, basement access, and an enclosed yard makes the space well-suited for retail uses that benefit from both customer-facing presentation and behind-the-scenes storage needs.
Key Highlights
- Large showroom build‑out with front counter, private offices, breakroom, restrooms, and rear storage
- ±25 parking spaces with main parking lot access via State Street (Route 5)
- Excellent visibility along State Street (Route 5) with 2025 AADT traffic count of 14,178
Financial Insights
Estimated NOI and Cap Rate
NOI / Yr
$101,696
Cap Rate
8.47%
Suggested Prices Based on Cap Rates
Cap Rate 5%
$2,033,920
$2.0M
Cap Rate 7%
$1,452,800
$1.5M
Cap Rate 9%
$1,129,956
$1.1M
Market Conditions
NOI Build-Up for 8,425 SF
Gross rent
$151.7K $18.00/SF
− Vacancy
−$6.4K −$0.76/SF
EGI
$145.3K $17.24/SF
− OpEx
−$43.6K −$5.17/SF
NOI
$101.7K $12.07/SF
Area
Schenectady County, NY
Vacancy
4.20%
Lease Rate
$18.00 /SF/Yr
Expense Ratio
30.00%
Simulate Cap Rate and NOI
Suggested Prices Based on Cap Rates
Cap Rate 5%
$2,033,920
Cap Rate 7%
$1,452,800
Cap Rate 9%
$1,129,956
Alternative Uses
Best Use
Retail
$1.45M
$1.27M – $1.69M
NOI $101,696 @ 7.0% cap · market cap 8.47%
Second Best
—
—
no second resolved use
Theoretical Best
Office A
$2.52M
$2.21M – $2.94M
NOI $176,521 @ 7.0% cap · market cap 14.71%
Zoning and permitted uses should be independently verified with authorities.
Property Analytics
Current Use
Lease Details
14,178 VPD
Traffic count
Yes
Fenced yard
Location Intelligence
Trade Area within ½ mile
478
Businesses Nearby
Under-served
Demand for This Use
Explore this area
Business Placement
Demographics for 12304, NY
21,513
Population
9,438
Households
2.3
Avg Household Size
40
Median Age
25%
College-Educated
88%
High-School Grad
6.7 sq mi
ZIP Area
3,211
Density / Sq Mi
$67,688
Median Household Income
$43,824
Median Earnings
$1,049
Median Rent
$171,500
Median Home Value
Market
Vacancy Rate% for Retail in Northeast region

Questions? Ask Rey
Realmo’s AI knows this listing — price, zoning, demand, history. Ask anything.






Similar Off Market Nearby
- Risa LLC — 1491 state st, schenectady, ny 12304
- The Tile Man — 1868 Hexam Rd W, Niskayuna, NY 12309
Frequently Asked Questions
What type of property is this?
Showroom - Large showroom includes front counter, offices, breakroom, restrooms, and a fenced yard with separate access.
Where is this showroom located?
The property is located at 1717-1721 State Street Schenectady, NY.
What is the asking price?
The asking price for this property is $1,200,000.
What are key features of this property?
This property features: Large showroom build‑out with front counter, private offices, breakroom, restrooms, and rear storage; ±25 parking spaces with main parking lot access via State Street (Route 5); Excellent visibility along State Street (Route 5) with 2025 AADT traffic count of 14,178