Mid-Century Duplex with Attached
1716 Empire Avenue Loveland, CO 80538
For Sale
$530,000
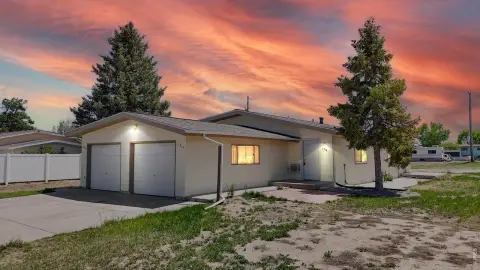
A 1964 duplex with two 2-bedroom, 1-bath units and 1-car attached garages on a large flat lot.
Property Size1,840 SF
Lot Size0.21 Acres
Price / SF$288.04
Days on Market33
Property Features for 1716 Empire Avenue
General Information
- Standard status
- Active
- Size
- 1,840 SF
- Lot size
- 0.21 Acres
- Property subtype
- Multi Family
Building Details
- Year Built
- 1964
Listing Agency:
Compass - Denver
(303) 478-3502
Listed By:
Nancy Kraatz · License #1324558
(303) 478-3502
Source:
Exitrealty
Added: Jun 22
Changed: Jul 20
Last Checked: Jul 23 at 5:05AM
Displayed information is deemed reliable but is not guaranteed and should be independently verified. All listing content including descriptions, pricing, images are the copyrighted material of Compass - Denver
Investment Insights
Based on property information with market context.
Built in 1964, this mid-century duplex offers two mirrored sides, each with 2 bedrooms and 1 full bath, plus a 1-car attached garage. The owner-occupied side (1718) features original pink bathroom elements, original cabinets, and original light fixtures. Photos provided represent the 1718 unit, while the other side (1716) is tenant occupied.
The property sits on a large, flat lot of over 9,000 sf. The tenant in 1716 has been in place for 3+ years and the unit is currently rented at $1,695 per month, with water split 50/50. The lease term runs through 3/31/2027.
1716 is described as being in similar condition, with an updated bathroom. The configuration supports options to live in one side and rent the other, or rent both sides, subject to the current lease on 1716.
The property sits on a large, flat lot of over 9,000 sf. The tenant in 1716 has been in place for 3+ years and the unit is currently rented at $1,695 per month, with water split 50/50. The lease term runs through 3/31/2027.
1716 is described as being in similar condition, with an updated bathroom. The configuration supports options to live in one side and rent the other, or rent both sides, subject to the current lease on 1716.
Key Highlights
- 1964 duplex with two 2‑bedroom, 1‑bath units and 1‑car attached garages on each side.
- Large flat lot over 9,000 SF.
- 1716 side is tenant occupied with 3+ year tenant and rent of $1,695/month; water split 50/50.
Financial Insights For Multifamily LT 5
Simulate Cap Rate and NOI
NOI Build-Up
- Vacancy
- income lost from leasable area expected to sit empty during the year — subtracted from gross rent.
- EGI (Effective Gross Income)
- gross rent minus vacancy losses — the realistic income before paying operating costs.
- OpEx (Operating Expenses)
- recurring costs to operate the property (property tax, insurance, utilities, maintenance, management) — excludes financing and capital improvements.
- NOI (Net Operating Income)
- income a property generates after operating costs but before financing and taxes.
| Component | $ | $/SF |
|---|---|---|
| Gross rent | $28.3k | $15.36 |
| − Vacancy | −$1.2k | −$0.66 |
| EGI | $27.1k | $14.70 |
| − OpEx | −$8.1k | −$4.41 |
| NOI | $18.9k | $10.29 |
1,840 SF · lease $15.36/SF/yr · vacancy 4.27% · expense 30.00%
Alternative Uses
Best Use
Multifamily LT 5
$270.6K
$236.7K – $315.7K
NOI $18,939 @ 7.0% cap · market cap 3.57%
Second Best
Apartment 5plus
$250.2K
$218.9K – $291.9K
NOI $17,512 @ 7.0% cap · market cap 3.30%
Theoretical Best
Office A
$493.9K
$432.2K – $576.2K
NOI $34,572 @ 7.0% cap · market cap 6.52%
Zoning and permitted uses should be independently verified with local authorities.
Property Analytics
Location Intelligence
Current Use by Public Records
Duplexes


FAQs
What type of property is this?
Duplex - A 1964 duplex with two 2-bedroom, 1-bath units and 1-car attached garages on a large flat lot.
Where is this duplex located?
The property is located at 1716 Empire Avenue Loveland, CO.
What is the asking price?
The asking price for this property is $530,000.
What are key features of this property?
This property features: 1964 duplex with two 2‑bedroom, 1‑bath units and 1‑car attached garages on each side.; Large flat lot over 9,000 SF.; 1716 side is tenant occupied with 3+ year tenant and rent of $1,695/month; water split 50/50.


