Santa Barbara-Style Mixed-Use
For Sale
$1,995,000
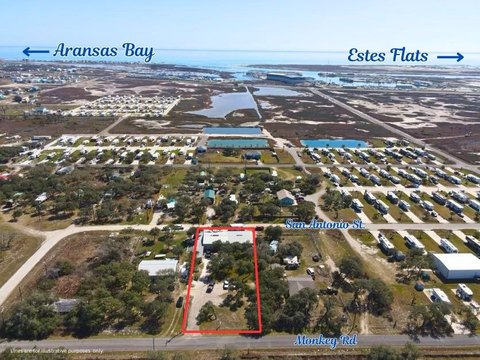
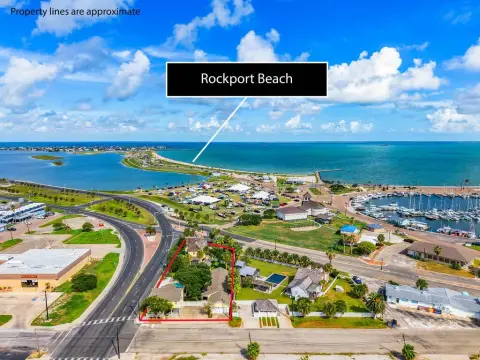
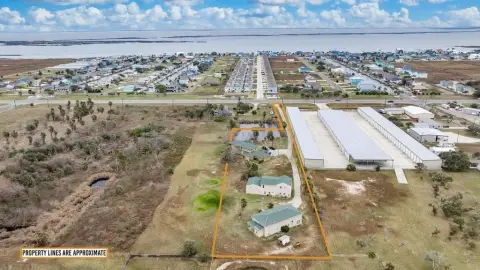
1703 Highway 35 S, Rockport, TX 78382
Office, storage, warehouse, and residential components create a flexible owner-user or investment property.
Property Size10,688 SF
Price / SF$186.66
Days on Market435
Property Features for 1703 Highway 35 S
General Information
Standard status
Active
Size
10,688 SF
Property subtype
Commercial
Additional Details
Warehouse Space
3,900 SF
Amenities
entry patio with ponds and natural landscaping
hurricane-rated windows
Building Details
Year Built
2006
Construction
ICF
Abandoned
No
Listing Agency:
Kuper Sotheby's Intl Realty
Listed By:
Adam Rivera · License #0645190
(210) 872-8683
Source:
Phyllisbrowning
Added: Aug 8, 2025
Changed: Oct 15
Last Checked: Oct 14 at 11:41PM
Displayed information is deemed reliable but is not guaranteed and should be independently verified. All listing content including descriptions, pricing, images are the copyrighted material of Kuper Sotheby's Intl Realty

Ask AI about this property
Review the available facts, identify missing information and prepare questions for the agent.
Investment Insights
Based on property information with market context.
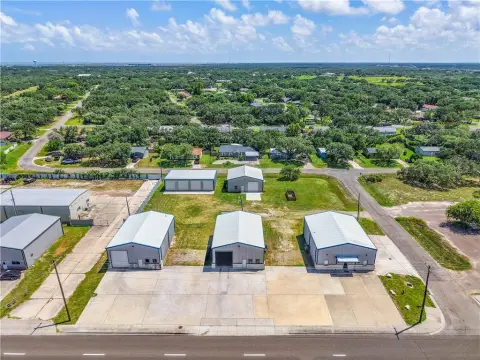
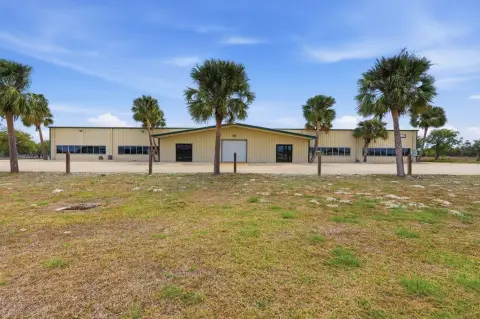
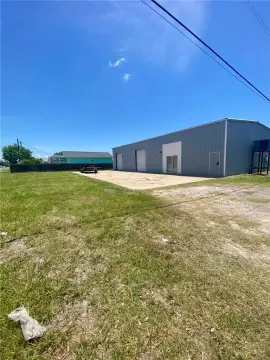
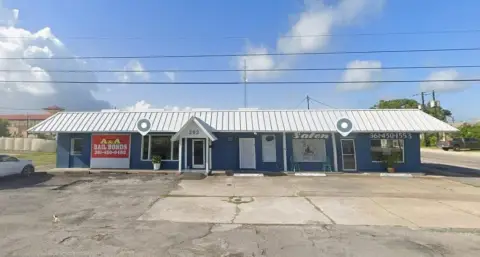
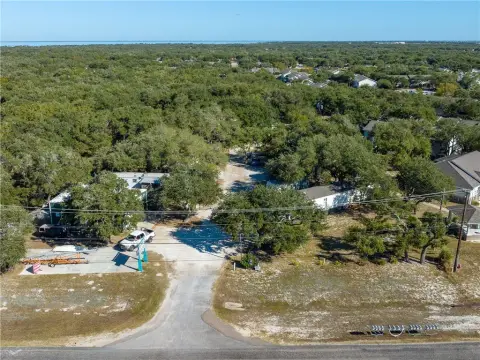
This Santa Barbara-inspired mixed-use property in Rockport combines office, showroom, storage, warehouse, and residential components. The primary 4,281-square-foot office/showroom includes two executive offices, six support offices, a conference room, file room, break room, two restrooms, and a reception and waiting area. Attached storage adds approximately 1,922 square feet with dual half-baths, while a separate 3,900-square-foot warehouse provides additional operational space. The property also includes a 2,680-square-foot residence above the commercial space.
Built in 2006, the structure features ICF construction and hurricane-rated windows. The entry patio includes two ponds with a circulation system, mature palms, natural landscaping, and parking with decorative inlaid slab rock. Located at 1703 Highway 35 S in Rockport, Texas, the property brings multiple commercial and residential components together in one building arrangement.
Built in 2006, the structure features ICF construction and hurricane-rated windows. The entry patio includes two ponds with a circulation system, mature palms, natural landscaping, and parking with decorative inlaid slab rock. Located at 1703 Highway 35 S in Rockport, Texas, the property brings multiple commercial and residential components together in one building arrangement.
Key Highlights
- 4,281‑square‑foot primary office/showroom with two executive offices and six support offices
- Approximately 1,922 square feet of attached storage with dual half‑baths
- Separate 3,900‑square‑foot warehouse
Financial Insights
Estimated NOI and Cap Rate
NOI / Yr
$152,312
Cap Rate
7.63%
Suggested Prices Based on Cap Rates
Cap Rate 5%
$3,046,240
$3.0M
Cap Rate 7%
$2,175,886
$2.2M
Cap Rate 9%
$1,692,356
$1.7M
Market Conditions
NOI Build-Up for 10,688 SF
Gross rent
$238.6K $22.32/SF
− Vacancy
−$35.5K −$3.32/SF
EGI
$203.1K $19.00/SF
− OpEx
−$50.8K −$4.75/SF
NOI
$152.3K $14.25/SF
Area
Aransas County, TX
Vacancy
14.87%
Lease Rate
$22.32 /SF/Yr
Expense Ratio
25.00%
Simulate Cap Rate and NOI
Suggested Prices Based on Cap Rates
Cap Rate 5%
$3,046,240
Cap Rate 7%
$2,175,886
Cap Rate 9%
$1,692,356
Alternative Uses
Best Use
Office B
$2.18M
$1.90M – $2.54M
NOI $152,312 @ 7.0% cap · market cap 7.63%
Second Best
Mixed Use
$1.65M
$1.44M – $1.92M
NOI $115,430 @ 7.0% cap · market cap 5.79%
Theoretical Best
Office A
$4.09M
$3.58M – $4.77M
NOI $286,003 @ 7.0% cap · market cap 14.34%
Zoning and permitted uses should be independently verified with authorities.
How Realmo checks its estimates
Property Analytics
Unlock full access to Insights
Subscribe to Realmo Intelligence
Open Analytics
Current Use
Location Intelligence
Trade Area within ½ mile
390
Businesses Nearby
Explore this area
Business Placement
Demographics for 78382, TX
19,432
Population
13,048
Households
1.5
Avg Household Size
53
Median Age
30%
College-Educated
92%
High-School Grad
79.9 sq mi
ZIP Area
243
Density / Sq Mi
$63,434
Median Household Income
$38,741
Median Earnings
$1,147
Median Rent
$238,200
Median Home Value
Check the figures for this property
Cap Rate, Value Estimation, Potential NOI and more
View Realmo Analytics
Market
Vacancy Rate% for Office in South region



Frequently Asked Questions
What type of property is this?
Mixed-use property - Office, storage, warehouse, and residential components create a flexible owner-user or investment property.
Where is this mixed-use property located?
The property is located at 1703 Highway 35 S Rockport, TX.
What is the asking price?
The asking price for this property is $1,995,000.
What are key features of this property?
This property features: 4,281‑square‑foot primary office/showroom with two executive offices and six support offices; Approximately 1,922 square feet of attached storage with dual half‑baths; Separate 3,900‑square‑foot warehouse


