Storefront Property in C-1
For Sale
$895,000
1659 Route 9, Clifton Park, NY 12065
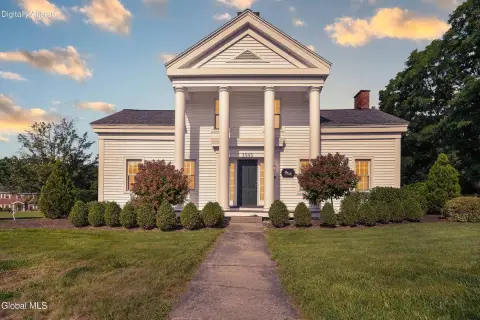
C-1 storefront on Route 9 with a windowed main level, walkout lower space, central air, and two-zone baseboard heat.
Property Size4,584 SF
Lot Size0.66 Acres
Price / SF$195.24
Days on Market113
Property Features for 1659 Route 9
General Information
Standard status
Active
Size
4,584 SF
Lot size
0.66 Acres
Property subtype
Commercial
Zoning
C-1
Site & Location
Traffic Count
19,708 vehicles/day
Highway Access
Yes
Road Access
Yes
Utilities to Site
Yes
Building Details
Year Built
1965
Buildings
1
Listing Agency:
Re Max Solutions
Listed By:
Ferdinando Bruno · License #10491208177
(518) 318-3800
Source:
Signatureonerealtygroup
Added: Jun 21
Changed: Oct 10
Last Checked: Oct 11 at 10:07AM
Displayed information is deemed reliable but is not guaranteed and should be independently verified. All listing content including descriptions, pricing, images are the copyrighted material of Re Max Solutions
Investment Insights
Based on property information with market context.
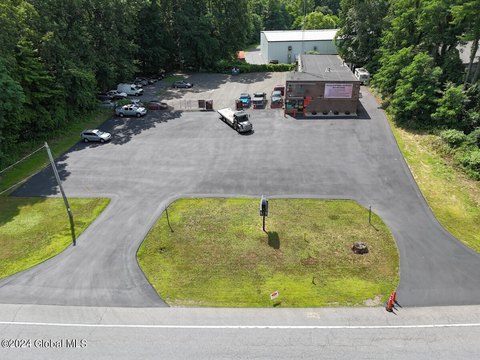
Ideally located on the busiest Clifton Park/Halfmoon commercial corridor just south of the Route 146 and Route 9 intersection near Exit 9 of I-87, this C-1 storefront property offers strong visibility with AADT 19,708 in 2025. The 0.66-acre parcel features 134' of frontage and includes a building with approximately 4,600 SF of usable space and over 25 parking spaces.
The main level totals 2,580 SF with multiple rooms and a window front well suited for retail or office use. A walkout lower level is accessible from the interior and has 3 different exterior doors, providing flexible space for a variety of uses. Paved parking spaces are available at the front, with a larger parking lot area to the rear.
The building includes efficient 2-zone hot water baseboard heating and central air. Utilities include public water and septic, with public sewer accessibility. The property was built in 1965.
The main level totals 2,580 SF with multiple rooms and a window front well suited for retail or office use. A walkout lower level is accessible from the interior and has 3 different exterior doors, providing flexible space for a variety of uses. Paved parking spaces are available at the front, with a larger parking lot area to the rear.
The building includes efficient 2-zone hot water baseboard heating and central air. Utilities include public water and septic, with public sewer accessibility. The property was built in 1965.
Key Highlights
- 0.66‑acre parcel with 134' of frontage on Route 9 near Exit 9 of I‑87
- Approximately 4,600 SF of usable building space for C‑1 uses
- Main level is 2,580 SF with multiple rooms and a window front
Financial Insights
Estimated NOI and Cap Rate
NOI / Yr
$62,008
Cap Rate
6.93%
Suggested Prices Based on Cap Rates
Cap Rate 5%
$1,240,160
$1.2M
Cap Rate 7%
$885,829
$885.8K
Cap Rate 9%
$688,978
$689.0K
Market Conditions
NOI Build-Up for 4,584 SF
Gross rent
$99.0K $21.60/SF
− Vacancy
−$16.3K −$3.56/SF
EGI
$82.7K $18.04/SF
− OpEx
−$20.7K −$4.51/SF
NOI
$62.0K $13.53/SF
Area
Saratoga County, NY
Vacancy
16.50%
Lease Rate
$21.60 /SF/Yr
Expense Ratio
25.00%
Simulate Cap Rate and NOI
Suggested Prices Based on Cap Rates
Cap Rate 5%
$1,240,160
Cap Rate 7%
$885,829
Cap Rate 9%
$688,978
Alternative Uses
Best Use
Office B
$885.8K
$775.1K – $1.03M
NOI $62,008 @ 7.0% cap · market cap 6.93%
Second Best
Retail
$790.5K
$691.7K – $922.2K
NOI $55,333 @ 7.0% cap · market cap 6.18%
Theoretical Best
Office A
$1.37M
$1.20M – $1.60M
NOI $96,044 @ 7.0% cap · market cap 10.73%
Zoning and permitted uses should be independently verified with authorities.
Property Analytics
Unlock full access to Insights
Subscribe to Realmo Intelligence
Open Analytics
Current Use
Lease Details
19,708 VPD
Traffic count
Yes
Highway access
Yes
Paved road access
Yes
Utilities to site
Location Intelligence
Trade Area within ½ mile
546
Businesses Nearby
Under-served
Demand for This Use
Explore this area
Business Placement
Demographics for 12065, NY
43,893
Population
19,506
Households
2.3
Avg Household Size
42
Median Age
53%
College-Educated
95%
High-School Grad
35.1 sq mi
ZIP Area
1,251
Density / Sq Mi
$115,681
Median Household Income
$61,692
Median Earnings
$1,419
Median Rent
$356,900
Median Home Value
Check the figures for this property
Cap Rate, Value Estimation, Potential NOI and more
View Realmo Analytics
Market
Vacancy Rate% for Office in Northeast region

Questions? Ask Rey
Realmo’s AI knows this listing — price, zoning, demand, history. Ask anything.






Frequently Asked Questions
What type of property is this?
Storefront property - C-1 storefront on Route 9 with a windowed main level, walkout lower space, central air, and two-zone baseboard heat.
Where is this storefront property located?
The property is located at 1659 Route 9 Clifton Park, NY.
What is the asking price?
The asking price for this property is $895,000.
What are key features of this property?
This property features: 0.66‑acre parcel with 134' of frontage on Route 9 near Exit 9 of I‑87; Approximately 4,600 SF of usable building space for C‑1 uses; Main level is 2,580 SF with multiple rooms and a window front


