Freestanding Retail-Industrial
For Sale
Contact for pricing
1601 South Riverside Drive, Fort Worth, TX 76104
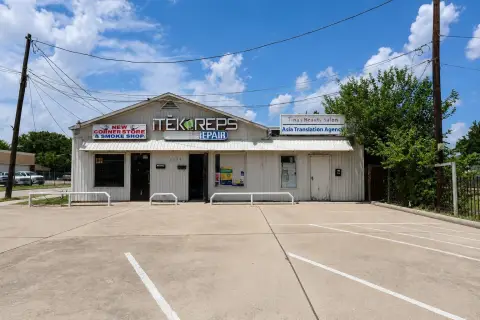
Freestanding building on a major corridor, zoned industrial and suited for service retail or light industrial uses.
Property Size4,449 SF
Price / SF$88.78
Days on Market126
Property Features for 1601 South Riverside Drive
General Information
Standard status
Active
Size
4,449 SF
Class
C
Property subtype
Retail
Zoning
I
Building Details
Year Built
1966
Buildings
1
Stories
1
Units
1
Listing Agency:
Vision Commercial Real Estate
Listed By:
Trenton Price · License #TX-0652029
(817) 803-3287
Source:
Crexi
Added: Jun 11
Changed: Oct 6
Last Checked: Oct 12 at 7:48PM
Displayed information is deemed reliable but is not guaranteed and should be independently verified. All listing content including descriptions, pricing, images are the copyrighted material of Vision Commercial Real Estate
Investment Insights
Based on property information with market context.
This freestanding retail/industrial building contains 4,449 square feet and was built in 1966. The property is positioned to support a flexible operating footprint, with a layout that can accommodate a range of service retail or light industrial and contractor-type concepts. Zoned “I” Industrial, the building offers an owner-operator or investor a workable base for repositioning, upgrades, or repurposing as needed.
Located along South Riverside Drive in Fort Worth within Tarrant County, the asset benefits from visibility along a major commercial corridor. The property sits at a prominent hard-corner site, supporting direct exposure to passing traffic and making it convenient for customers or crews approaching from surrounding transportation routes.
For tenants or buyers seeking an adaptable building with industrial zoning, this facility provides a practical canvas for modernization while remaining aligned with industrial use parameters. The combination of corridor visibility, a freestanding configuration, and “I” zoning makes it a strong fit for users looking for a straightforward site to operate from and improve over time.
Located along South Riverside Drive in Fort Worth within Tarrant County, the asset benefits from visibility along a major commercial corridor. The property sits at a prominent hard-corner site, supporting direct exposure to passing traffic and making it convenient for customers or crews approaching from surrounding transportation routes.
For tenants or buyers seeking an adaptable building with industrial zoning, this facility provides a practical canvas for modernization while remaining aligned with industrial use parameters. The combination of corridor visibility, a freestanding configuration, and “I” zoning makes it a strong fit for users looking for a straightforward site to operate from and improve over time.
Key Highlights
- Freestanding 4,449 SF retail/industrial building built in 1966
- Zoned I (Industrial), offering a versatile footprint for service retail or light industrial/contractor‑type uses
- Located along S Riverside Drive in Fort Worth with visibility on a major commercial corridor
Financial Insights
Estimated NOI and Cap Rate
NOI / Yr
$36,116
Cap Rate
9.14%
Suggested Prices Based on Cap Rates
Cap Rate 5%
$722,320
$722.3K
Cap Rate 7%
$515,943
$515.9K
Cap Rate 9%
$401,289
$401.3K
Market Conditions
NOI Build-Up for 4,449 SF
Gross rent
$61.4K $13.80/SF
− Vacancy
−$5.8K −$1.31/SF
EGI
$55.6K $12.49/SF
− OpEx
−$19.4K −$4.37/SF
NOI
$36.1K $8.12/SF
Area
Fort Worth, TX
Vacancy
9.50%
Lease Rate
$13.80 /SF/Yr
Expense Ratio
35.00%
Simulate Cap Rate and NOI
Suggested Prices Based on Cap Rates
Cap Rate 5%
$722,320
Cap Rate 7%
$515,943
Cap Rate 9%
$401,289
Alternative Uses
Best Use
Flex RnD
$515.9K
$451.5K – $601.9K
NOI $36,116 @ 7.0% cap · market cap 9.14%
Second Best
Industrial
$401.0K
$350.9K – $467.9K
NOI $28,072 @ 7.0% cap · market cap 7.11%
Theoretical Best
Office A
$1.62M
$1.41M – $1.89M
NOI $113,129 @ 7.0% cap · market cap 28.64%
Zoning and permitted uses should be independently verified with authorities.
How Realmo checks its estimates
Property Analytics
Unlock full access to Insights
Subscribe to Realmo Intelligence
Open Analytics
Current Use
Location Intelligence
Trade Area within ½ mile
281
Businesses Nearby
Under-served
Demand for This Use
Explore this area
Business Placement
Demographics for 76104, TX
21,571
Population
9,605
Households
2.2
Avg Household Size
32
Median Age
21%
College-Educated
74%
High-School Grad
5.9 sq mi
ZIP Area
3,656
Density / Sq Mi
$56,848
Median Household Income
$38,131
Median Earnings
$1,385
Median Rent
$145,000
Median Home Value
Check the figures for this property
Cap Rate, Value Estimation, Potential NOI and more
View Realmo Analytics
Market
Vacancy Rate% for Industrial in South region

Questions? Ask Rey
Realmo’s AI knows this listing — price, zoning, demand, history. Ask anything.








Frequently Asked Questions
What type of property is this?
Flex space - Freestanding building on a major corridor, zoned industrial and suited for service retail or light industrial uses.
Where is this flex space located?
The property is located at 1601 South Riverside Drive Fort Worth, TX.
What is the asking price?
The asking price for this property is $395,000.
What are key features of this property?
This property features: Freestanding 4,449 SF retail/industrial building built in 1966; Zoned I (Industrial), offering a versatile footprint for service retail or light industrial/contractor‑type uses; Located along S Riverside Drive in Fort Worth with visibility on a major commercial corridor