Multi-Tenant Flex Industrial
For Sale
$12,000,000
1600 Las Colonias Drive, Grand Junction, CO 81505
CommercialSale, Grand Junction, CO
Property Size37,680 SF
Lot Size3.00 Acres
Price / SF$318.47
Days on Market48
Property Features for 1600 Las Colonias Drive
General Information
Property type
Commercial Sale
Property subtype
Other
Zoning description
PD
Lot features
Corner Lot
Directions
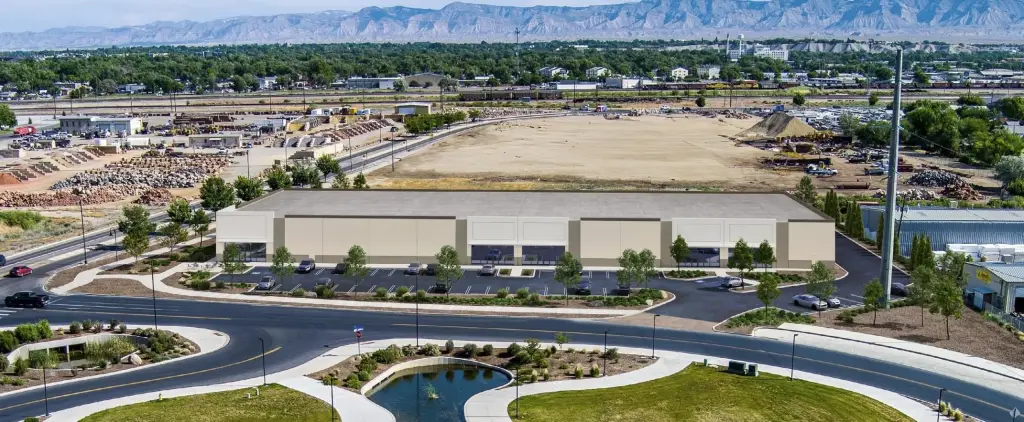
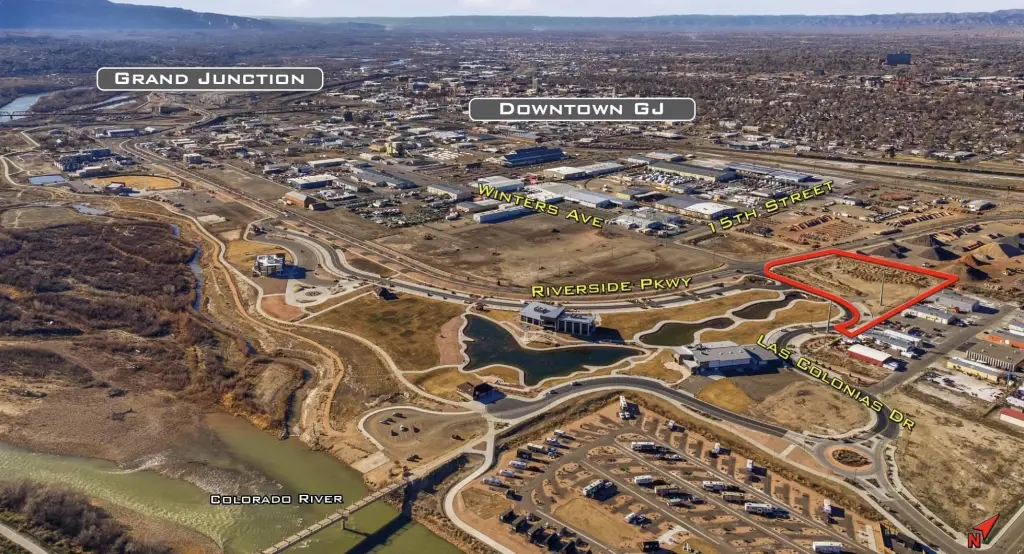
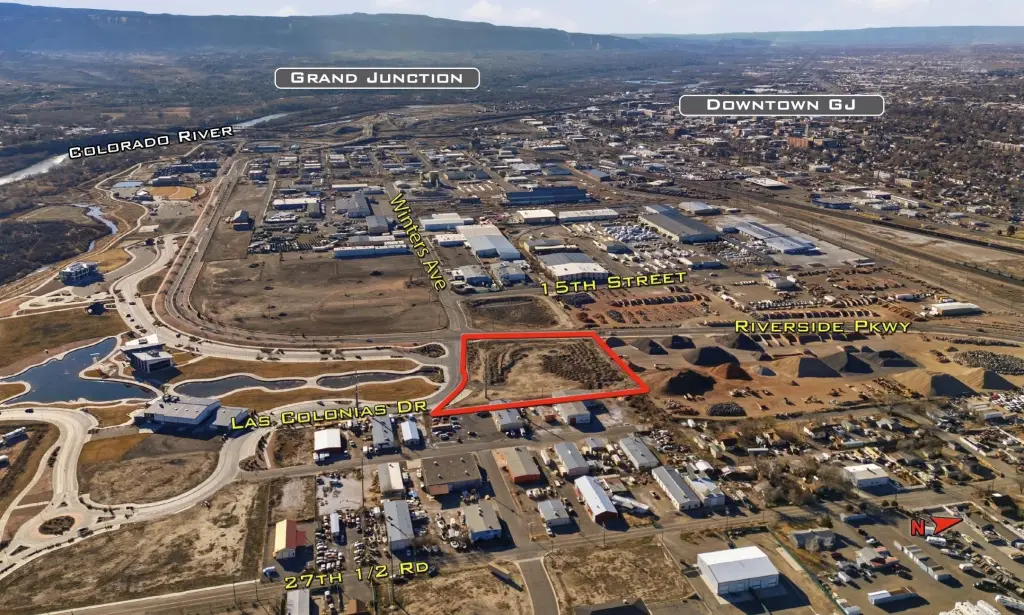
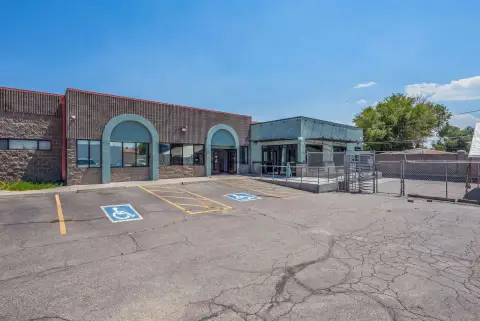
Located in the Los Colonias business park on the far North side. Directly North of the butterfly pond. Turn right on las Colonias Drive while heading North on Riverside Parkway. Property is on the North side.
Subdivision
Grand Junction City
Standard status
Active
Lot size
3.00 Acres
Taxes and HOA fees
Tax Annual Amount
72000
Listing Agency:
COLDWELL BANKER DISTINCTIVE PROPERTIES
(970) 243-0456
Listed By:
John Metcalf
(760) 685-4995
Added: Sep 1
Changed: Oct 8
Last Checked: Oct 18 at 8:06PM
MLS# 20264403
Copyright © 2026 Grand Junction Area Association of Realtors. All rights reserved. All information provided by the listing agent/broker is deemed reliable but is not guaranteed and should be independently verified.

Ask AI about this property
Review the available facts, identify missing information and prepare questions for the agent.
Investment Insights
Based on property information with market context.
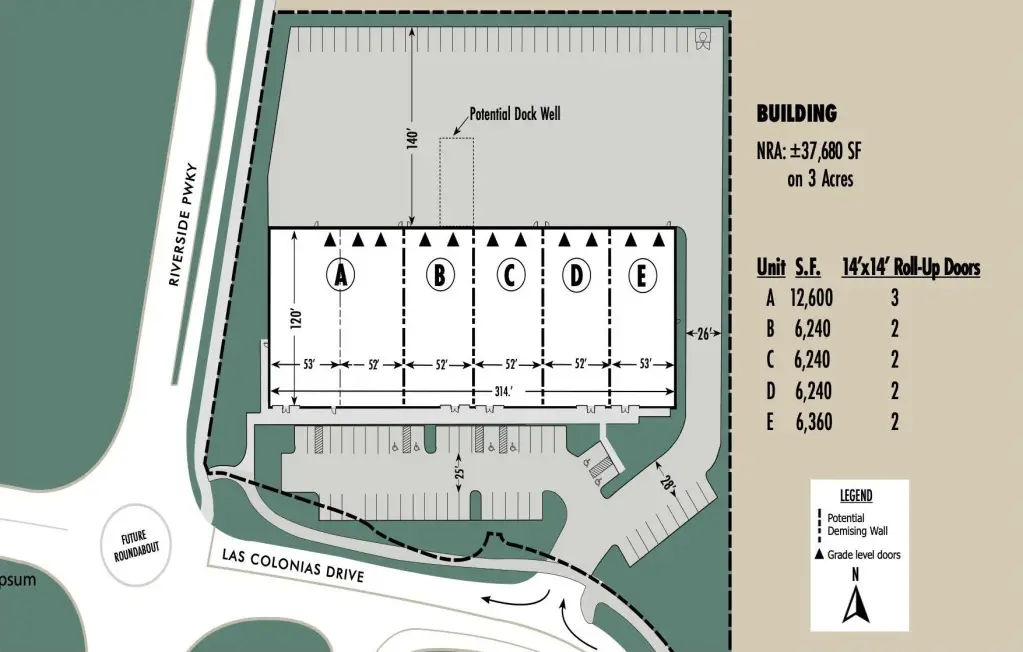
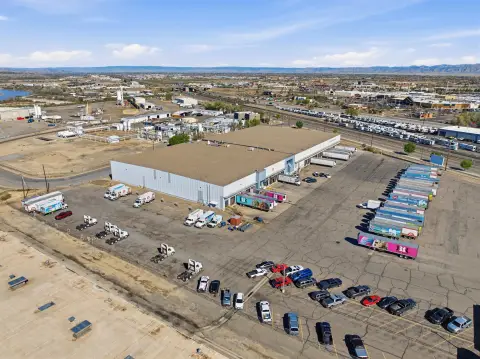
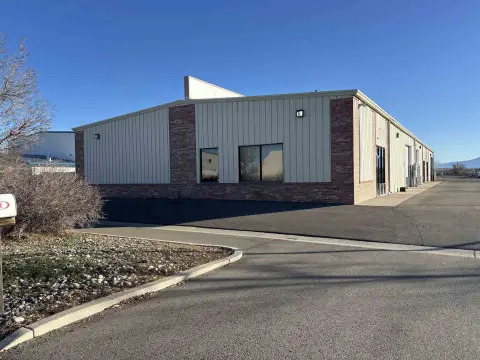
Monument Business Park is a planned flex industrial development spanning approximately 37,680 SF across roughly 3 acres. The multi-tenant property is designed around adaptable suite configurations and supports industrial, manufacturing, technology, distribution, and office uses. Building features include minimum clear heights of 20 feet, 11 grade-level overhead doors measuring 14 by 14 feet, one or two dock wells, ample parking, a large rear yard, and significant power capacity.
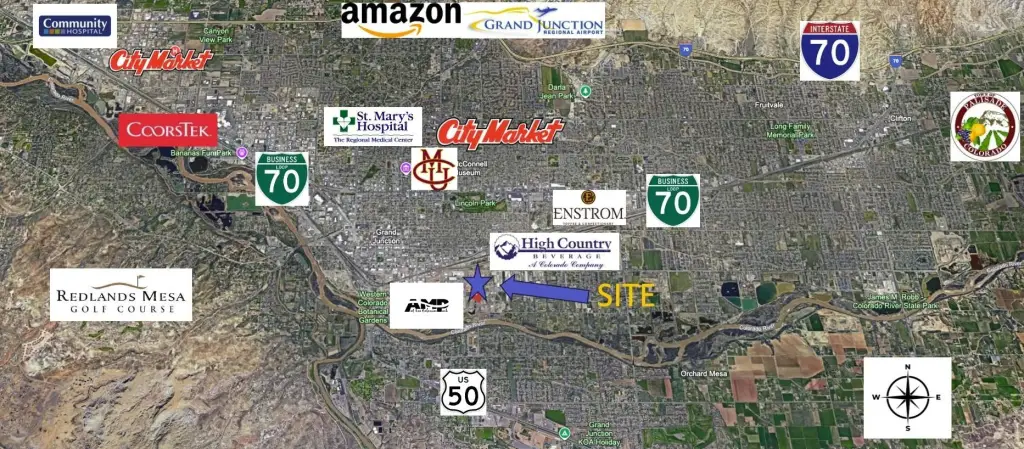
The development is positioned near I-70 and downtown Grand Junction, providing access to regional transportation and the city center. The offering is subject to a long-term ground lease with the Las Colonias Development Corporation, with approximately 91 years remaining. The property is presented for owner-user, investment, and build-to-suit applications, subject to verification of development plans, permitted uses, and ground lease terms.
The development is positioned near I-70 and downtown Grand Junction, providing access to regional transportation and the city center. The offering is subject to a long-term ground lease with the Las Colonias Development Corporation, with approximately 91 years remaining. The property is presented for owner-user, investment, and build-to-suit applications, subject to verification of development plans, permitted uses, and ground lease terms.
Key Highlights
- Approximately 37,680 SF flex industrial development on approximately 3 acres
- 11 grade‑level overhead doors measuring 14X14ft
- Minimum clear heights of 20 feet
Financial Insights
Estimated NOI and Cap Rate
NOI / Yr
$393,133
Cap Rate
3.28%
Suggested Prices Based on Cap Rates
Cap Rate 5%
$7,862,660
$7.9M
Cap Rate 7%
$5,616,186
$5.6M
Cap Rate 9%
$4,368,144
$4.4M
Market Conditions
NOI Build-Up for 37,680 SF
Gross rent
$655.6K $17.40/SF
− Vacancy
−$50.8K −$1.35/SF
EGI
$604.8K $16.05/SF
− OpEx
−$211.7K −$5.62/SF
NOI
$393.1K $10.43/SF
Area
Mesa County, CO
Vacancy
7.75%
Lease Rate
$17.40 /SF/Yr
Expense Ratio
35.00%
Simulate Cap Rate and NOI
Suggested Prices Based on Cap Rates
Cap Rate 5%
$7,862,660
Cap Rate 7%
$5,616,186
Cap Rate 9%
$4,368,144
Alternative Uses
Best Use
Flex RnD
$5.62M
$4.91M – $6.55M
NOI $393,133 @ 7.0% cap · market cap 3.28%
Second Best
Warehouse
$5.03M
$4.40M – $5.87M
NOI $352,302 @ 7.0% cap · market cap 2.94%
Theoretical Best
Healthcare Medical
$71.51M
$62.57M – $83.42M
NOI $5,005,411 @ 7.0% cap · market cap 41.71%
Zoning and permitted uses should be independently verified with authorities.
How Realmo checks its estimates
Property Analytics
Unlock full access to Insights
Subscribe to Realmo Intelligence
Open Analytics
Current Use
Lease Details
20 ft
Clear height
11
Drive-in doors
Multi-tenant
Tenancy
Location Intelligence
Trade Area within ½ mile
528
Businesses Nearby
Balanced
Demand for This Use
Explore this area
Business Placement
Demographics for 81505, CO
11,791
Population
5,379
Households
2.2
Avg Household Size
41
Median Age
42%
College-Educated
96%
High-School Grad
72.1 sq mi
ZIP Area
164
Density / Sq Mi
$87,677
Median Household Income
$46,560
Median Earnings
$1,424
Median Rent
$436,800
Median Home Value
Check the figures for this property
Cap Rate, Value Estimation, Potential NOI and more
View Realmo Analytics
Market
Vacancy Rate% for Industrial in West region

Frequently Asked Questions
What type of property is this?
Flex space - Planned development offers adaptable suites for industrial, manufacturing, technology, distribution, and office users.
Where is this flex space located?
The property is located at 1600 Las Colonias Drive Grand Junction, CO.
What is the asking price?
The asking price for this property is $12,000,000.
What are key features of this property?
This property features: Approximately 37,680 SF flex industrial development on approximately 3 acres; 11 grade‑level overhead doors measuring 14X14ft; Minimum clear heights of 20 feet


