Office Building with
For Sale
Contact for pricing
Pending
150n 9th Street, West Columbia, SC 29169
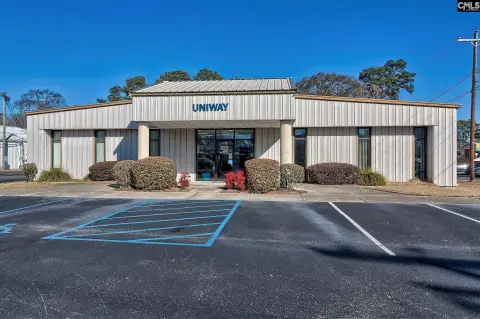
Configured for professional operations with perimeter offices, conference space, restrooms, break rooms, and on-site parking.
Property Size6,100 SF
Days on Market52
Property Features for 150n 9th Street
General Information
Standard status
Pending
Size
6,100 SF
Total Parking Spaces
20
Property subtype
Office
Amenities
conference room
break rooms
Building Details
Building Size
6,100 SF
Listing Agency:
Choice Realty
Listed By:
Jonathan Lee · License #SC
(854) 205-3527
Source:
Crexi
Added: Sep 2
Changed: Oct 11
Last Checked: Oct 20 at 9:33PM
Displayed information is deemed reliable but is not guaranteed and should be independently verified. All listing content including descriptions, pricing, images are the copyrighted material of Choice Realty

Ask AI about this property
Review the available facts, identify missing information and prepare questions for the agent.
Investment Insights
Based on property information with market context.
This office building provides approximately 6,100 square feet arranged for professional use. The interior includes a front reception area, perimeter offices, a conference room, four restrooms, and two break rooms, creating a practical layout for day-to-day operations and meetings. Twenty parking spaces are included on site.
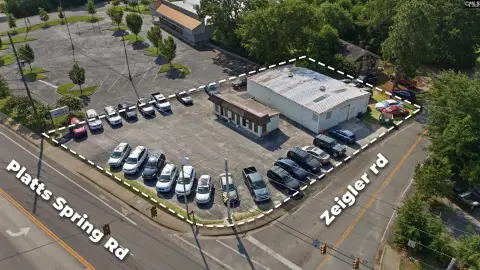
The property is located at 150n 9th Street in West Columbia, South Carolina. Downtown Columbia is approximately a 5-minute drive away, while Columbia Metropolitan Airport is about 15-minutes by car. The combination of office accommodations, parking, and proximity to these destinations supports a range of professional office requirements.
The property is located at 150n 9th Street in West Columbia, South Carolina. Downtown Columbia is approximately a 5-minute drive away, while Columbia Metropolitan Airport is about 15-minutes by car. The combination of office accommodations, parking, and proximity to these destinations supports a range of professional office requirements.
Key Highlights
- Approximately 6,100 sq ft of office space
- Front reception area with perimeter offices
- Conference room, 4 restrooms, and 2 break rooms
Financial Insights
Estimated NOI and Cap Rate
NOI / Yr
$81,792
Cap Rate
7.44%
Suggested Prices Based on Cap Rates
Cap Rate 5%
$1,635,840
$1.6M
Cap Rate 7%
$1,168,457
$1.2M
Cap Rate 9%
$908,800
$908.8K
Market Conditions
NOI Build-Up for 6,100 SF
Gross rent
$116.4K $19.08/SF
− Vacancy
−$7.3K −$1.20/SF
EGI
$109.1K $17.88/SF
− OpEx
−$27.3K −$4.47/SF
NOI
$81.8K $13.41/SF
Area
Lexington County, SC
Vacancy
6.30%
Lease Rate
$19.08 /SF/Yr
Expense Ratio
25.00%
Simulate Cap Rate and NOI
Suggested Prices Based on Cap Rates
Cap Rate 5%
$1,635,840
Cap Rate 7%
$1,168,457
Cap Rate 9%
$908,800
Alternative Uses
Best Use
Office B
$1.17M
$1.02M – $1.36M
NOI $81,792 @ 7.0% cap · market cap 7.44%
Second Best
—
—
no second resolved use
Theoretical Best
Office A
$1.64M
$1.43M – $1.91M
NOI $114,680 @ 7.0% cap · market cap 10.43%
Zoning and permitted uses should be independently verified with authorities.
How Realmo checks its estimates
Property Analytics
Current Use
Location Intelligence
Trade Area within ½ mile
509
Businesses Nearby
Explore this area
Business Placement
Demographics for 29169, SC
22,768
Population
11,087
Households
2.1
Avg Household Size
40
Median Age
39%
College-Educated
89%
High-School Grad
11.6 sq mi
ZIP Area
1,963
Density / Sq Mi
$53,673
Median Household Income
$38,268
Median Earnings
$1,081
Median Rent
$189,900
Median Home Value
Market
Vacancy Rate% for Office in South region




Frequently Asked Questions
What type of property is this?
Office building - Configured for professional operations with perimeter offices, conference space, restrooms, break rooms, and on-site parking.
Where is this office building located?
The property is located at 150n 9th Street West Columbia, SC.
What is the asking price?
The asking price for this property is $1,100,000.
What are key features of this property?
This property features: Approximately 6,100 sq ft of office space; Front reception area with perimeter offices; Conference room, 4 restrooms, and 2 break rooms


