Oceanfront Condo with Rental
For Sale
$88,000
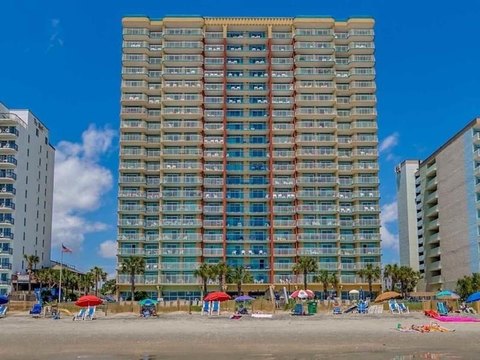
1501 S Ocean Blvd. #1115 Myrtle, Myrtle Beach, SC 29577
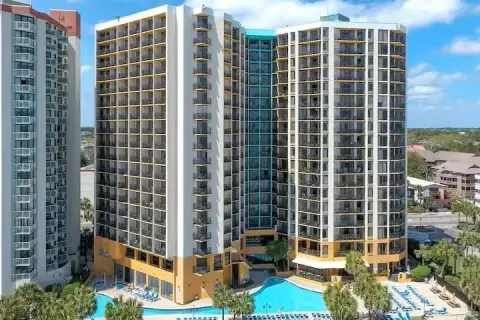
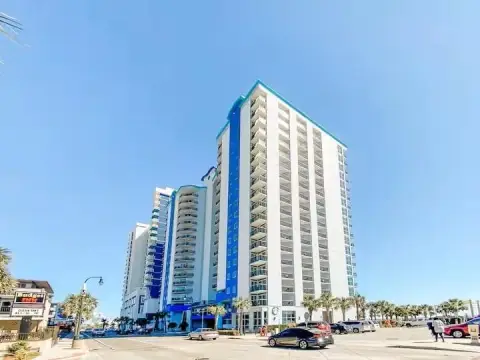
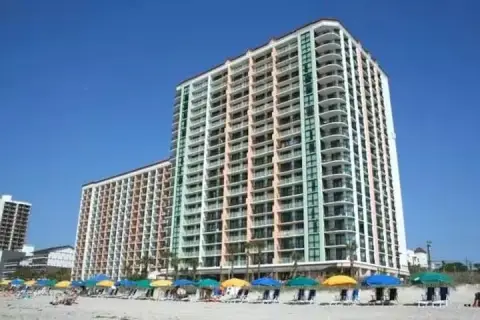
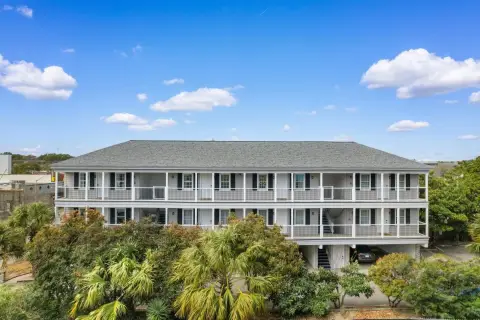
Updated oceanfront condo in Myrtle Beach with strong rental demand.
Property Size360 SF
Days on Market462
Property Features for 1501 S Ocean Blvd. #1115 Myrtle
General Information
Standard status
Active
Size
360 SF
Property subtype
Condominium
Amenities
Cable Ready
Wall/Window Unit(s)
Electric
Range
Refrigerator
Deck, Pool, Cable Available, Electricity Available, Phone Available, Sewer Available, Septic Available, Water Available, High Speed Internet Available, Trash Collection
Building Details
Building Size
360 SF
Year Built
1973
Listing Agency:
Keller Williams Myrtle Beach
Listed By:
Brad Emond · License #100092
(843) 503-0033
Source:
Kw
Added: Jul 3, 2025
Changed: Aug 8
Last Checked: May 19 at 8:49PM
Displayed information is deemed reliable but is not guaranteed and should be independently verified. All listing content including descriptions, pricing, images are the copyrighted material of Keller Williams Myrtle Beach
Investment Insights
Based on property information with market context.
Located at 1501 S Ocean Blvd in Myrtle Beach, this resort-style condo presents an investment opportunity in a high-performing vacation rental property. The unit, updated in 2022, features renovations that add style and value. Updates include removal of the popcorn ceiling, fresh paint throughout, and new vinyl flooring. A custom-built fireplace serves as a modern focal point, while a sliding barn door adds charm to the bathroom. The hallway includes cabinets and a quartz countertop for extra storage. The unit also features new furniture. Amenities include indoor and outdoor pools, a hot tub, a lazy river, a fitness center, and on-site dining. Top attractions are minutes away, including the SkyWheel, Boardwalk, Broadway at the Beach, and Barefoot Landing. The location provides access to golf, live entertainment, amusement parks, and water sports.
Key Highlights
- Oceanfront location in Myrtle Beach with direct beach access.
- High‑performing vacation rental property with strong rental demand.
- Updated in 2022 with new flooring, paint, custom fireplace, and bathroom improvements.
Financial Insights
Estimated NOI and Cap Rate
NOI / Yr
$3,323
Cap Rate
3.78%
Suggested Prices Based on Cap Rates
Cap Rate 5%
$66,460
$66.5K
Cap Rate 7%
$47,471
$47.5K
Cap Rate 9%
$36,922
$36.9K
Market Conditions
NOI Build-Up for 360 SF
Gross rent
$6.3K $17.52/SF
− Vacancy
−$265 −$0.74/SF
EGI
$6.0K $16.78/SF
− OpEx
−$2.7K −$7.55/SF
NOI
$3.3K $9.23/SF
Area
Horry County, SC
Vacancy
4.20%
Lease Rate
$17.52 /SF/Yr
Expense Ratio
45.00%
Simulate Cap Rate and NOI
Suggested Prices Based on Cap Rates
Cap Rate 5%
$66,460
Cap Rate 7%
$47,471
Cap Rate 9%
$36,922
Alternative Uses
Best Use
Apartment 5plus
$47.5K
$41.5K – $55.4K
NOI $3,323 @ 7.0% cap · market cap 3.78%
Second Best
Hotel Hospitality
$33.0K
$28.9K – $38.5K
NOI $2,309 @ 7.0% cap · market cap 2.62%
Theoretical Best
Office A
$91.2K
$79.8K – $106.5K
NOI $6,387 @ 7.0% cap · market cap 7.26%
Zoning and permitted uses should be independently verified with authorities.
Property Analytics
Unlock full access to Insights
Subscribe to Realmo Intelligence
Open Analytics
Current Use
Location Intelligence
Trade Area within ½ mile
1,255
Businesses Nearby
Explore this area
Business Placement
Demographics for 29577, SC
34,109
Population
22,630
Households
1.5
Avg Household Size
48
Median Age
30%
College-Educated
91%
High-School Grad
22.8 sq mi
ZIP Area
1,496
Density / Sq Mi
$48,561
Median Household Income
$33,591
Median Earnings
$1,130
Median Rent
$273,700
Median Home Value
Check the figures for this property
Cap Rate, Value Estimation, Potential NOI and more
View Realmo Analytics
Market
Vacancy Rate% for Multifamily in South region

Questions? Ask Rey
Realmo’s AI knows this listing — price, zoning, demand, history. Ask anything.



Frequently Asked Questions
What type of property is this?
Short term rental property - Updated oceanfront condo in Myrtle Beach with strong rental demand.
Where is this short term rental property located?
The property is located at 1501 S Ocean Blvd. #1115 Myrtle Myrtle Beach, SC.
What is the asking price?
The asking price for this property is $88,000.
What are key features of this property?
This property features: Oceanfront location in Myrtle Beach with direct beach access.; High‑performing vacation rental property with strong rental demand.; Updated in 2022 with new flooring, paint, custom fireplace, and bathroom improvements.



